
 ?Mathematical formulae have been encoded as MathML and are displayed in this HTML version using MathJax in order to improve their display. Uncheck the box to turn MathJax off. This feature requires Javascript. Click on a formula to zoom.
Abstract
A water-based particle size magnifier (WPSM) was designed and applied to the wet sampling of airborne nanoparticles at the air-liquid interface (ALI). A T-shaped micromixer was employed to supersaturate the water vapor by instantaneous turbulent mixing between a cold aerosol and hot water vapor-laden gas. The nucleation efficiency of the size-selected test particles of sodium chloride (10 to 40 nm) and lithium sulfate (30 to 150 nm) was evaluated by changing the operation parameters of the WPSM. It was found that over 80% of the test particles (>30 nm) successfully grew into droplets larger than 2.3 µm, which is the cutoff diameter of the impactor. The condensational growth of the water droplets was also confirmed experimentally using an optical particle sizer as well as theoretical calculations. To realize stable deposition at the ALI, a cold wall condenser was employed for draining the excess water vapor from the WPSM. As a result of inertial deposition on the water surface, airborne particles were transported from air to the liquid phase through the ALI, and aqueous ions (Li+) were successfully detected by ion chromatography (IC). The detection limit of the WPSM-IC system was as low as 0.33 µg m−3-air, which corresponded to the 10-minute sampling of 30-nm particles with a number concentration of approximately 10,000 particles mL−1.
Copyright © 2021 American Association for Aerosol Research
EDITOR:
1. Introduction
Condensation growth of aerosol particles is an effective technique to enhance particle collection efficiency by inertia (Wang et al. Citation2020; Eiguren Fernandez, Lewis, and Hering Citation2014; Weber et al. Citation2001), centrifugal force (Orsini et al. Citation2008), electrostatic force (Chen et al. Citation2014), gravity, and other size-dependent collection mechanisms. The collection of aerosol-containing droplets into the liquid phase, especially into water, enables highly sensitive chemical analyses of soluble components using ion chromatography (IC) and other online/offline analytical instruments (Eiguren Fernandez, Lewis, and Hering Citation2014; Weber et al. Citation2001). In contrast to the filter-based extraction method, the entire aerosol particles, including the solid and water-insoluble contents, can be directly transferred into water (or any liquid). Therefore, it can be applied to prepare aerosol-containing droplets or colloidal suspensions for various applications, such as in vitro toxicological studies that require the reproduction of inhaled particle deposition at the air-liquid interface (ALI) (Tilly et al. Citation2019).
Various continuous-flow water condensation techniques, such as laminar flow (Hering et al. Citation2005), single-flow mixing (Romay et al. Citation2016), and turbulent mixing of superheated steam jet (Weber et al. Citation2001), have been developed. Considering the thermodynamic properties of water vapor, i.e., the large diffusivity and low thermal conductivity, a laminar flow device that introduces cold aerosol into the hot vapor region (the principle behind the water-based condensation particle counter [CPC]) is highly beneficial to activate nanoparticles as small as 2 nm (Hering et al. Citation2017).
A particle size magnifier (PSM) is another condensation growth device that utilizes turbulent mixing of cold aerosol with hot vapor to achieve supersaturation with a very short residence time (Okuyama, Kousaka, and Motouchi Citation1984). Various working fluids, such as dibutyl phthalate (Gamero-Castaño and de la Mora Citation2000, Citation2002; Seto et al. Citation1997), ethylene glycol (Ito et al. Citation2011; Kim, Okuyama, and Fernández de la Mora Citation2003), and diethylene glycol (Vanhanen et al. Citation2011), were used to activate aerosol nanoparticles and molecular ions as small as 1−2 nm. However, the applicability of water to PSM systems is limited. In fact, the general design of the particle into liquid sampler (PILS) was based on the PSM (Weber et al. Citation2001); however, the PILS adopted a superheater for water vapor generation that requires a large amount of water consumption for activating aerosol particles. The limitation of water as a working fluid of the PSM originates from the abovementioned unique thermodynamic properties of water vapor (Kousaka et al. Citation1991) and the difficulty in the continuous vapor supply system.
In this study, a constant-flow rate evaporator system (Ito et al. Citation2011) was first applied to generate saturated water vapor for size magnification of size-classified aerosol nanoparticles. A T-shaped micromixer (Kim, Okuyama, and Fernández de la Mora Citation2003) was employed to achieve supersaturation by quasi-adiabatic (instantaneous) mixing between cold aerosols and hot water vapor. The condensation growth of the aerosol was validated by measuring the droplet size distribution. Then, the ALI particle collection efficiency was evaluated using an inertial impactor against the water surface.
2. Basic design of the water-based PSM
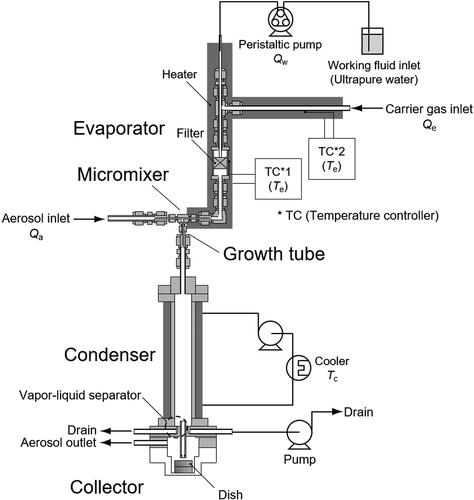
shows an overview of the PSM. Most parts of the PSM were prepared using stainless steel tubes and conventional connectors that were available from Swagelok and other manufacturers. A T-shaped connector (1/16 inches T-connector, SS-100-3) served as a micromixer between a cold aerosol (room temperature) and hot water vapor. A constant-flow rate evaporator (Ito et al. Citation2011) was used to generate high-temperature (150 °C) water vapor. Ultrapure water was fed into the stainless steel porous media filter (Swagelok inline filter with a pore size of 7 µm, SS-4F-T7-7) using a peristaltic pump (ATTO SJ-1211II-L) with a water flow rate of Qw [m3 min−1]. The tip of the transfer tube (stainless steel tube with an outer diameter of 1.6 mm and an inner diameter of 1.0 mm) was in contact with the porous media for stable feeding of water. The carrier gas (filtered room air) was introduced using an air pump (KNF N86KT.18) while controlling its mass flow rate, Ge [kg min−1], by a mass flow controller (Koflok 3660). The whole evaporator system was heated by a tape heater and covered with an insulator while controlling its temperature to 150 °C by temperature controllers (Misumi MTCS for TC1, As one TS-K for TC2).
Figure 1. Schematic diagram of the PSM.
The humidity level after vapor-aerosol mixing, H [kg-water (kg-dry air)−1], can be calculated by the following relationship:
(1)
(1)
where ρW is the density of water (1,000 kg m−3) and Ge and Ga [kg min−1] are the mass flow rates of the evaporator and aerosol, respectively. In this study, Qw was varied from 0 to 5.65 × 10⁻⁷ m3 min−1 (= 33.9 mL hr−1), and Ge and Ga were fixed at 1.2 × 10⁻³ kg min−1 (volumetric flow rate, Qe = 1.0 L min−1) and 1.8 × 10⁻³ kg min−1 (Qa = 1.5 L min−1), respectively. As a result, H was controlled to range from dry conditions (H ∼ 0 kg-water (kg-dry air)−1) to supersaturated conditions (H = 0.194 kg-water (kg-dry air)−1), which is much higher than the saturation humidity, Hs (Hs = 0.008 kg-water (kg-dry air)−1 @10 °C and 0.018 kg-water (kg-dry air)−1@20 °C).
Since supersaturation conditions were created by turbulent mixing in the T-shaped micromixer (Reynolds number >3,000), we can assume that hot vapor and the cold aerosol were mixed quasi-adiabatically. To calculate the theoretical supersaturation ratio under adiabatic mixing conditions, the partial pressure of water vapor, pw [kPa], was calculated by the following molar fraction relationship (Dalton’s law).
(2)
(2)
where PT is the total pressure (101.3 kPa) and the values 18 and 29 are the molecular weights of water and air, respectively. The theoretical supersaturation ratio, Sth, was calculated as
(3)
(3)
where ps [kPa] is the water vapor pressure at saturation, which is calculated as a function of temperature, T [°C], by following Antoine’s equation.
(4)
(4)
Under adiabatic mixing conditions, the temperature of the nucleation tube () is also estimated as
(5)
(5)
where Ta is the aerosol temperature (room temperature) and Te is the hot vapor temperature, which was fixed at 150 °C, as mentioned previously. For example, when the ambient temperature is 23 °C, Tmix is calculated as 73.8 °C; however, the actual nucleation temperature might be lower than this value because of thermal conduction to the surroundings. Therefore, the nucleation temperature, Tn, was experimentally determined, which is described in the experimental section. As a result of turbulent mixing, heterogeneous nucleation can take place in the very short residence time in the nucleation tube (approximately 27 ms), and the particle-containing water droplets were grown to a micron size. It should be noted that condensation of the water vapor on the wall (vapor loss) of the nucleation tube was not observed under our experimental conditions.
Generated droplets and excess water vapor were then introduced to the condenser (). The diameter of the condenser was 20 mm, which is greater than the diameter of the nucleation tube, which resulted in a long residence time (approximately 1.2 s). The condenser wall temperature was controlled to 10 to 20 °C by a coolant circulation system that created gradient of temperature and water vapor concentration in the radial direction from the center to the wall. Due to the larger diffusivity of water vapor than of droplets, the excess water vapor was removed from the aerosol stream by radial diffusion and condensation on the condenser wall. The water deposits then fell due to gravity and were drained using a vapor-liquid separator and water/air pump (Denso Sangyo DSC-2F-12W) which was operated continuously with flow rate of 0.02 L min−1 (). This drainage system successfully removed the condensate from the PSM, which prevents clogging of the impactor nozzle for a long-term collection process. Finally, only the grown droplets and saturated air were fed into the collector.
The collector was designed for sampling droplets directly into a liquid. As shown in , an impactor nozzle with a diameter Dj of 2 mm was used to create a gas jet with velocity U = 13.3 m s−1 (at a total flow rate of 2.5 L min−1). The Stokes number of the current nozzle was calculated by the following equation.
(6)
(6)
where ρp is the particle density, Dd is the droplet diameter after condensation growth, CC is the Cunningham slip correction factor, and µ is the gas viscosity. Under the critical condition (a collection efficiency of 50%, Stk50 = 0.24; [Hinds Citation1999]), Dd50 and the Reynolds number, Re, are estimated as follows.
(7)
(7)
Thus, droplets larger than 2.3 µm can be captured at the ALI. In fact, a higher collection efficiency is predicted for a higher gas jet velocity (U > 13.3 m s−1); however, in this case, significant water deformation and water splashing were observed at the ALI (see in the online supplementary information [SI]). Therefore, the nozzle inner diameter was carefully chosen to be 2 mm in the present study.
The ALI collection system consisted of an aluminum Petri dish (diameter 21 mm, height 7.5 mm) filled with 1.5 mL of ultrapure water placed in the collector. The initial nozzle-to-water surface distance was adjusted to 4 mm, but the distance may have changed due to the slight deformation of the water surface by the injection of the gas.
To analyze the overall collection efficiency of the aerosol via the ALI, 1) the nucleation efficiency, 2) growth rate, 3) mass balance of water vapor (vapor loss), and 4) collection yield were experimentally evaluated under various operating conditions. It should be noted that the current nozzle system was designed for the chemical analysis of water-soluble components, and the nozzle diameter and jet velocity should be tuned for the future study on the ALI cell exposure.
3. Experimental procedures
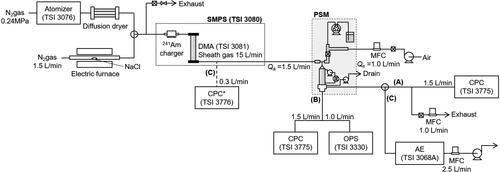
shows the experimental setup used in this study, and it is composed of a test aerosol generator, a size classifier, a PSM and particle counters. Lithium sulfate (Li2SO4) and sodium chloride (NaCl) were chosen as the test particles of the water-soluble components. Lithium sulfate nanoparticles (30 to 150 nm) were prepared by a spray-dry process using a collision atomizer (TSI model 3076). NaCl nanoparticles (10 to 40 nm) were generated by the evaporation-condensation technique. The size distribution of the generated polydisperse particles was measured by a scanning mobility particle sizer (SMPS, TSI model 3080). An electrostatic classifier (differential mobility analyzer, DMA, TSI model 3081 and 3086) was used to prepare the size-selected particles for testing size-dependent nucleation (and collection) efficiency. In the application to the chemical analysis of ambient aerosol, particularly for the particles larger than 100 nm, the multiply charged fractions which may be involved in the DMA-classification should be considered (see Table S2 in the SI). The mass fractions of multiply charged particles of test particles (100- and 150-nm) were eliminated less than 40% by using Li2SO4 particles with mobility diameter larger than peak diameter of the original size distribution as shown in Table S2. The flow rates and temperature of the PSM were precisely controlled except for the aerosol temperature and humidity (room temperature was 23 °C). The operating conditions of the PSM are given in the previous section.
Figure 2. Experimental setup for evaluating the (a) nucleation efficiency (based on the particle loss in the PSM collector), (b) droplet diameter distribution (by removing the collector), and (c) ALI collection efficiency using ion chromatography.
3.1. Evaluation of nucleation efficiency and nucleation temperature
Nucleation efficiency was evaluated by the flow (A) in . In this flow, the particle concentration at the outlet of the PSM was measured by a condensation particle counter (CPC, TSI model 3776) with/without water vapor introduction. An aluminum Petri dish filled with water was installed as an ALI collector of droplets that grow larger than 2.3 µm by inertial force. The nucleation efficiency, η, was obtained by the following equation.
(8)
(8)
where Noff is the particle number concentration without water vapor introduction and Non is that with water vapor. The effects of the PSM operating parameters, such as the water flow rate, Qw, from 3.8 to 33.9 mL hr−1 and the condenser temperature, Tc, from 10 °C to room temperature (23 °C), as well as the test particle diameter, Dp, from 10 to 150 nm, were evaluated in terms of η. The critical conditions for nucleation, corresponding to η = 50%, were experimentally obtained as a function of Tc and Dp. As mentioned previously, the actual nucleation temperature, Tn, was lower than the adiabatic mixing temperature, Tmix, given by EquationEquation (5)
(5)
(5) due to thermal conduction to the surroundings. Therefore, the nucleation temperature, Tn, was experimentally determined by following Kelvin’s equation.
(9)
(9)
where S* is the critical supersaturation, γ, M, and ρ are the surface tension, molecular weight, and density of water, respectively, and R is the gas constant. In the estimation of nucleation temperature, first, the partial vapor pressure, pw, was calculated using EquationEquation (2)
(2)
(2) from the experimental condition (Qw) corresponding to η = 50%. Eventually, the nucleation temperature Tn that satisfies Kelvin’s equation, EquationEquation (9)
(9)
(9) , was obtained by a goal seek method. In the case of the water-soluble aerosol particles such as NaCl and Li2SO4 test particles used in the experiments, the activation may take place at the smaller saturation ratio due to solute effects which can be described by Köhler equation (see in the SI). However, these droplets cannot be grown to micron size, because the solute concentration was decreased by the condensation of water vapor. Consequently, the difference of the calculated nucleation temperatures between Kelvin and Köhler relationship was less than 1 °C.
3.2. Evaluation of the droplet diameter distribution
The size distribution of the droplets was measured using an optical particle sizer (OPS, TSI model 3330), as shown in flow (B) in . In this flow, the impactor and collector were removed, and the condenser outlet was directly connected to the OPS inlet. Since the maximum particle number concentration of the OPS was approximately 3,000 particles mL−1, the test aerosol concentration was controlled by a dilution system using a medium-performance filter. It should be noted that the original test particles (Dp <150 nm) could not be counted by the OPS (the detection limit is 300 nm).
To evaluate the change in the droplet diameter, Dd, in the nucleation tube, the growth rate was calculated using the following equations.
(10a)
(10a)
(10b)
(10b)
where pw* is the partial pressure of water vapor calculate by EquationEquation (9)
(9)
(9) , Na is Avogadro number, m is the mass of a vapor molecule, k is Boltzmann constant, Dv is the diffusion coefficient and λ is the mean free path of the gas molecules. The residence time (volume/flow rate) in the nucleation tube was 27 ms.
3.3. Evaluation of the ALI collection efficiency
The ALI collection efficiency was evaluated using flow (C), as shown in . As previously mentioned, an aluminum Petri dish was filled with 1.5 mL of ultrapure water. Droplets containing lithium sulfate were collected in the ultrapure water by inertia and other collection mechanisms. After 10 and 60 min of sampling, the liquid solution was subjected to ion chromatography (IC, Thermo Scientific Dionex Integrion HPIC, AS-AP Autosampler) to analyze the ion concentration. During the sampling time, the test particle number concentration, Nin, at the PSM inlet was continuously monitored using the CPC (TSI model 3776), as shown in . The mass concentration, Cm (µg m−3), total mass, and Mp (µg) of the test lithium sulfate particles were calculated by the following equations.
(11)
(11)
(12)
(12)
where the units of Dp, Nin and Qa are m, particle m−3 and L min−1, respectively. ρp is the bulk density of lithium sulfate (2,220 kg m−3) and t (min) is the sampling time.
In the IC analyses, Li cations were used as target ion species because the background level of sulfuric acid ions was relatively high (approximately 30 ppb) to evaluate the collection efficiency. This level of contamination probably originated from the handling of liquid samples from the dish to the IC. Therefore, a direct connection between the collector and the IC might be necessary for ambient particle monitoring. On the other hand, the background level of the Li cation was approximately 3 µg L−1, which is reasonably low to evaluate the ALI collection efficiency. The Li cation-based collection efficiency was calculated from the following relationship.
(13)
(13)
where CLi+ (µg L−1) is the Li cation concentration measured by the IC, and Vw (mL) is the water volume in the Petri dish. MLi+ is the Li cation mass of the test particle, which is calculated by the following relationship.
(14)
(14)
where the values 6.941 and 109.952 are the atomic weight of Li and the molecular weight of lithium sulfate, respectively.
4. Results and discussion
4.1. Evaluation of the nucleation efficiency and nucleation temperature
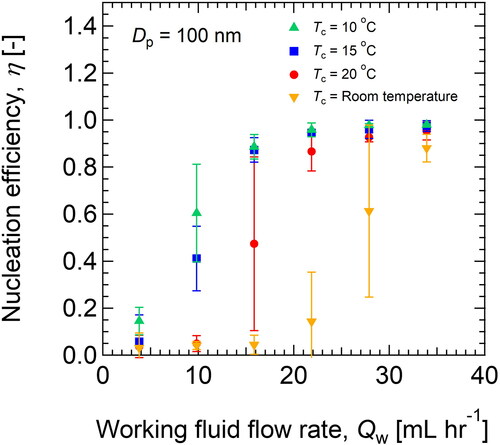
shows the nucleation efficiency, η, of 100-nm test particles plotted against the flow rate of the working fluid, Qw. When the condenser temperature was not controlled (room temperature was 23 °C), the nucleation efficiency gradually increased with Qw, and half of the test particles nucleated (and were collected by inertia) at Qw = 26 mL hr−1 (η = 50%). Finally, the nucleation efficiency increased to more than 90% at a Qw of 35 mL hr−1. Based on EquationEquation (5)(5)
(5) , the theoretical adiabatic mixing temperature Tmix was calculated to be 73.8 °C. In this case, the supersaturation ratio was not achieved (S = 0.35 from EquationEquation (3)
(3)
(3) ) under the adiabatic mixing assumption. Therefore, supersaturation occurred by turbulent mixing and additional heat conduction from the surroundings (nonadiabatic mixing, Kim et al. Citation2015). Based on EquationEquation (9)
(9)
(9) , the critical supersaturation ratio, S*, and nucleation temperature, Tn, were calculated to be 1.02 and 57.7 °C, respectively. Thus, the mixing temperature was decreased from 73.8 °C to 57.7 °C by heat conduction to the surroundings. Under this condition, a remarkable amount of vapor condensation was observed at the impactor nozzle, and it was difficult to stably operate the PSM for a long time. To prevent vapor condensation at the nozzle, the condenser temperature was controlled to 20, 15 and 10 °C by circulating a coolant in the jacket surrounding the condenser. The cooling operation was effective in removing the excess water vapor by condensation on the condenser wall, which can be confirmed by the increase in the amount of water drainage. Clogging of the impactor nozzle was observed occasionally at Tc = 20 °C, but water deposition was not seen when Tc was lower than 15 °C. As a result of a decrease in the condenser temperature, the nucleation efficiency of 100-nm particles was drastically improved. As shown in , η = 50% can be realized at the lower flow rate of the working fluid.
Figure 3. The nucleation efficiency, η, of 100-nm test particles (Li2SO4) when the water flow rate, Qw, condenser temperature, and Tc were changed.
summarizes the working fluid flow rate, Qw50, corresponding to η = 50%, and the nucleation temperature, Tn, calculated by EquationEquation (9)(9)
(9) . As shown in , both Qw50 and Tn decreased with decreasing condenser temperature due to the enhancement in the nucleation efficiency by the conductive cooling effect. shows the calculated nucleation temperature, Tn, as a function of condenser temperature. As shown in , cooling of the condenser wall reduced the nucleation temperature due to thermal conduction from the nucleation tube wall downstream. On the other hand, the water vapor available for nucleation may not increase to further decrease the condenser temperature to less than 10 °C. In this case, water vapor was immediately transported to the condenser wall by thermal diffusion, and the decrease in the nucleation temperature can be balanced with the loss of water vapor. In fact, a significant change in the nucleation efficiency was not observed between the results of Tc = 15 and 10 °C in .
Figure 4. Calculated nucleation temperature, Tn, at various condenser temperatures. The broken line shows the theoretical mixing temperature, Tmix.
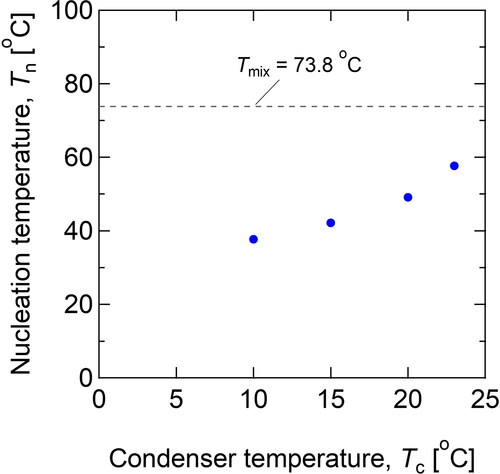
Table 1. Nucleation temperature, Tn, calculated under critical conditions (η = 50%).
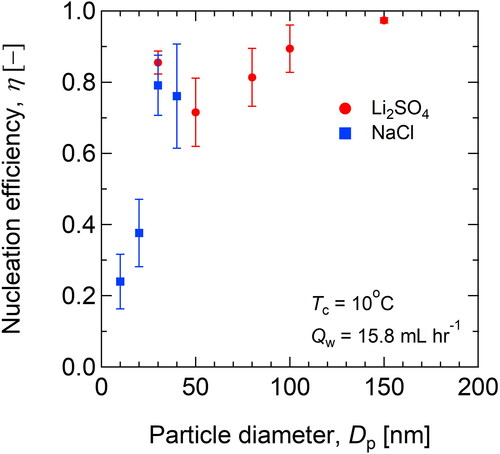
Considering the unitization of the PSM for aerosol wet sampling and for the ALI cell exposure study, a lower water flow rate would be advantageous. Therefore, we set the condenser temperature, Tc, equal to 10 °C, for further analyses of the nucleation efficiency against other particle diameters. shows the experimental results of the nucleation efficiency as a function of test particle diameter (10–150 nm). To enhance supersaturation, the working fluid flow rate was increased (Qw = 15.8 mL hr−1). As shown in , η maintained a high value (>80%) for particles larger than 30 nm, but it decreased for particles smaller than 20 nm. Based on the previous experimental results (), the nucleation temperature was considered to be 37.7 °C. The supersaturation ratio, S, corresponding to this condition (Qw = 15.8 mL hr−1, Tn = 37.7 °C) was calculated to be 1.81 from EquationEquation (3)(3)
(3) . Based on Kelvin’s equation (EquationEquation (9)
(9)
(9) ), the critical particle diameter was predicted to be Dp* = 3.3 nm. On the other hand, the experimental critical diameter at η = 50% was 22.9 nm. The reason for the difference between the experimental value and the theoretical value might be incomplete mixing in the nucleation tube. In fact, the increase in the water flow rate (ΔQw = 15.8 − 8.5 = 7.3 mL hr−1) contributed to an enhancement in the nucleation efficiency (the critical diameter decreased from 100 nm to 22.9 nm), but it did not completely contribute to an enhancement in the uniform supersaturation conditions in the micromixer. Similar results, such as decreasing nucleation efficiency, were reported for the PILS system (Weber et al. Citation2001), which might demonstrate the limits of applying water as the working fluid in mixed-type nucleation devices.
Figure 5. The experimental results of the nucleation efficiency as a function of the test particle diameter.
4.2. Evaluation of the droplet diameter distribution
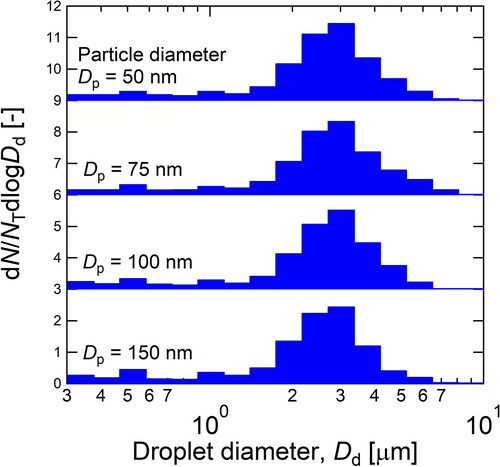
shows the droplet size distribution measured by the OPS at the outlet of the condenser. The experimental conditions were the same as those in (Qw = 15.8 mL hr−1, Tc, = 10 °C, and Tn = 37.7 °C). As shown in , the diameter mode of the droplets after their growth was approximately 3 µm regardless of the diameter of nuclei ranging from 50 to 150 nm. Although some of the large droplets (>3 µm) may be lost by inertia and gravity in the transfer tube from the PSM outlet to the OPS, most of the droplets grew larger than the cutoff diameter of the impactor (Dp50 = 2.3 µm). Therefore, it was found that the PSM successfully enhanced the particle size so that the particles were collected by the impactor.
Figure 6. Droplet size distribution measured by the OPS at the outlet of the condenser. N and NT are number concentration and total number concentration measured by the OPS, respectively. The size of nuclei, Dp, was 50–150 nm.
shows the time evolution of the droplet diameter due to condensation of water vapor, as calculated by EquationEquations (10a)(10a)
(10a) and Equation(10b)
(10b)
(10b) . Both equations were integrated by assuming that nucleation temperature was constant in the nucleation tube. The solid line in represents the change in droplet size under the experimental conditions in and (S = 1.09). As shown in , the droplet growth was very fast, and the droplet diameter exceeded the cutoff diameter of the impactor at a nucleation time of less than 20 ms. Moreover, the droplet size at the residence time (27 ms) was 3.2 µm, which was reasonably consistent with the size observed by the experiments using OPS (). Based on this consistency, condensation growth might be completed in the nucleation tube, and further growth might not take place in the condenser. Therefore, the excess water vapor was effectively trapped on the condenser wall by molecular diffusion to terminate further growth of the droplets.
Figure 7. Temporal change in the droplet diameter calculated by EquationEquations (10a)(10a)
(10a) and Equation(10b)
(10b)
(10b) . The solid lines represent the change in droplet sizes under the experimental conditions.
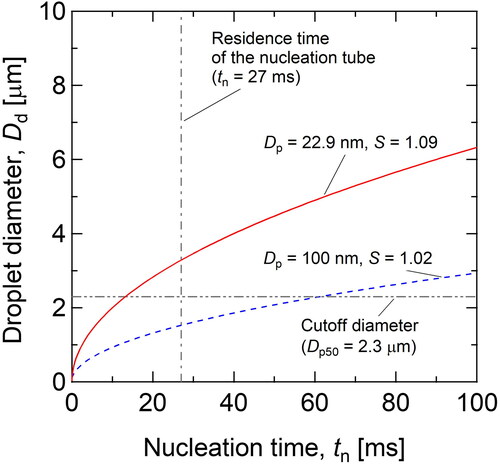
On the other hand, the broken line in shows the change in the droplet diameter under the condition of S = 1.02, which corresponds to η = 50% for particles of 100 nm (). In this case, the droplet diameter Dd increased to 1.5 µm at the residence time, and this diameter was slightly smaller than the cutoff diameter of the impactor. In fact, the droplet size distribution was not stably measured by the OPS, as shown by the large error bar for nucleation efficiency in under this condition (Qw = 8.5 mL hr−1).
4.3. Evaluation of the ALI collection yield
shows the ALI collection efficiency, EALI, against the aerosol mass, Mp. The upper horizontal axis is aerosol mass concentration (Cm) for 10-min sampling and Mp was calculated from Cm by EquationEquation (12)(12)
(12) . The upper axis also indicates theoretical detection limit of aerosol mass concentration for 10-min sampling. The solid line in indicates the theoretical line corresponding to EALI = 100%, which was calculated by EquationEquation (13)
(13)
(13) . The plots in represent the experimental data of the Li cation mass detected by IC with varying test particle diameters (30 to 150 nm) and sampling times (10 and 60 min). As a reference, Li+ concentration in the solution was also indicated at the right axis which was calculated from Li+ mass measured by the IC (left axis) divided by the water volume (15 mL) in the Petri dish.
Figure 8. The ALI collection efficiency, EALI, against the aerosol total mass. The solid line indicates the theoretical line corresponding to EALI = 100%. The plots represent the experimental data of the Li cation mass, as detected by IC.
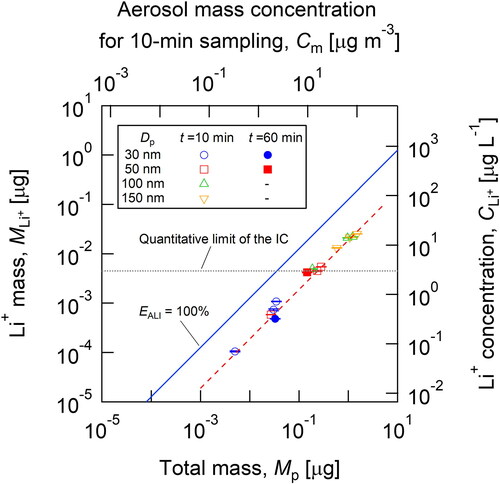
As shown in , the experimental data have a linear correlation with the aerosol mass introduced to the PSM, although the collection efficiency was approximately 20%. As previously mentioned, the nucleation efficiency was more than 80% for all particle sizes (30 to 150 nm); therefore, the lower ALI collection efficiency might originate from the loss of droplets due to deposition at the PSM outlet (drain) or from the difficulty of inertial collection at the ALI due to liquid surface fluctuations. Another possible reason is the difference in particle density, ρp = 2,220 kg m−3, used in the calculation of the particle mass according to EquationEquation (11)(11)
(11) . Because of the high hygroscopicity of the lithium sulfate nanoparticles, the test particles may contain residual water molecules, which reduce the apparent density of the test particles.
From , it was found that the present PSM-IC system successfully detected Li cations from test particles (>50 nm) beyond the quantitative limit of the IC (3 µg L−1), which is shown by the dotted line in . Under some conditions, such as with 30-nm (10 and 60 min) and 50-nm (10 min) particles, the Li cation concentrations were below the quantitative limit of the IC; however, the Li cation signal could be detected by the IC. It should be noted that Li+ ions were not detected under conditions without a working fluid supply. Therefore, it can be concluded that the current PSM could grow lithium sulfate nanoparticles by water vapor condensation, and the grown droplets were collected by the impactor at the ALI.
In the applications of the current system to atmospheric aerosol sampling and in vitro cell exposure studies, the time resolution of the device should be considered. From EquationEquation (11)(11)
(11) , the aerosol mass concentration of lithium sulfate (Li cation) test particles was estimated to be 0.3 µg m−3 (0.04 µg-Li+ m−3) for 30 nm and 40 µg m−3 (4.9 µg-Li+ m−3) for 150 nm when the sampling time was 10 min, and Nin was assumed to be 10,000 particles mL−1. The mass concentration of the water-soluble ionic components in the atmospheric aerosol ranged from sub-µg to µg m−3. For example, the sulfuric acid ion (SO42–) mass concentration ranges from the background level (below 1 µg m−3 [Weber et al. 2003]) to the level in highly polluted air (35 µg m−3 [Huang et al. Citation2013]). Therefore, the present PSM-IC system has a relatively high time resolution (10 min), and its use in various applications is expected, such as in semi-real-time analyses of ionic components and highly efficient particle sampling in cell exposure studies.
5. Summary
The nucleation characteristics of the newly developed water-based particle size magnifier were evaluated using test particles with diameters of 10 to 150 nm, and the following points were clarified.
The nucleation temperature, Tn, was lower than the ideal (adiabatic) mixing temperature due to nonadiabatic mixing and thermal conduction from the condenser. When the condenser temperature was 10 °C, Tn was estimated to be 37.7 °C. As a result, over 80% of the test particles (>30 nm) were grown and collected by the WPSM.
The growth of droplets larger than the cutoff diameter of the impactor (2.3 µm) was confirmed by the measurement of the droplets by the OPS. Theoretical calculations of the growth rate also indicate the rapid growth of the droplets in the nucleation tube before entering the condenser.
The condenser effectively trapped and drained water vapor, which enables stable sampling of aerosol particles into liquid for a long time.
Although the overall mass collection efficiency was approximately 20%, the present WPSM-IC system successfully detected Li cations originating from test aerosol particles with very low concentrations (0.3 µg m−3).
Since the current WPSM is mostly composed of conventional tube fittings, it can be easily combined with various aerosol instruments, such as samplers for atmospheric particles and bioaerosols, as well as in vitro cell exposure systems.
Supplemental Material
Download MS Word (752.2 KB)Additional information
Funding
References
- Chen, T.-M., C.-J. Tsai, S.-Y. Yan, and S.-N. Li. 2014. An efficient wet electrostatic precipitator for removing nanoparticles, submicron and micron-sized particles. Sep. Purif. Technol. 136:27–35. doi:10.1016/j.seppur.2014.08.032.
- Eiguren Fernandez, A., G. S. Lewis, and S. V. Hering. 2014. Design and laboratory evaluation of a sequential spot sampler for time-resolved measurement of airborne particle composition. Aerosol Sci. Technol. 48 (6):655–63. doi:10.1080/02786826.2014.911409.
- Gamero-Castaño, M., and J. F. de la Mora. 2000. A condensation nucleus counter (CNC) sensitive to singly charged sub-nanometer particles. J. Aerosol Sci. 31 (7):757–72. doi:10.1016/S0021-8502(99)00555-8.
- Gamero-Castaño, M., and J. F. de la Mora. 2002. Ion-induced nucleation: Measurement of the effect of embryo’s size and charge state on the critical supersaturation. J. Chem. Phys. 117 (7):3345–53. doi:10.1063/1.1492279.
- Hering, S. V., G. S. Lewis, S. R. Spielman, A. Eiguren-Fernandez, N. M. Kreisberg, C. Kuang, and M. Attoui. 2017. Detection near 1-nm with a laminar-flow, water-based condensation particle counter. Aerosol Sci. Technol. 51 (3):354–62. doi:10.1080/02786826.2016.1262531.
- Hering, S. V., M. R. Stolzenburg, F. R. Quant, D. R. Oberreit, and P. B. Keady. 2005. A laminar-flow, water-based condensation particle counter (WCPC). Aerosol Sci. Technol. 39 (7):659–72. doi:10.1080/02786820500182123.
- Hinds, W. C. 1999. Chapter 5: Straight-line acceleration and curvilinear particle motion. In Aerosol technology: Properties, behavior, and measurement of airborne particles, 121–8, 2nd ed. New Jersey: John Wiley & Sons, Inc.
- Huang, Y., L. Li, J. Li, X. Wang, H. Chen, J. Chen, X. Yang, D. S. Gross, H. Wang, L. Qiao, et al. 2013. A case study of the highly time-resolved evolution of aerosol chemical and optical properties in urban Shanghai, China. Atmos. Chem. Phys. 13 (8):3931–44. doi:10.5194/acp-13-3931-2013.
- Ito, E., T. Seto, Y. Otani, and H. Sakurai. 2011. Nucleation of ethylene glycol vapor and growth of sub-10-nm particles in nanoparticle size magnifier. Aerosol Sci. Technol. 45 (10):1250–9. doi:10.1080/02786826.2011.589481.
- Kim, C. S., K. Okuyama, and J. Fernández de la Mora. 2003. Performance evaluation of an improved particle size magnifier (PSM) for single nanoparticle detection. Aerosol Sci. Technol. 37 (10):791–803. doi:10.1080/02786820300913.
- Kim, S., K. Iida, Y. Kuromiya, T. Seto, H. Higashi, and Y. Otani. 2015. Effect of nucleation temperature on detecting molecular ions and charged nanoparticles with a diethylene glycol-based particle size magnifier. Aerosol Sci. Technol. 49 (1):35–44. doi:10.1080/02786826.2014.989954.
- Kousaka, Y., Y. Endo, A. Yamamoto, Y. Muroya, T. Niida, and N. Fukushima. 1991. Evaluation of high flow rate mixing type CNC. Earozoru Kenkyu 6 (4):359–64. doi:10.11203/jar.6.359.
- Okuyama, K., Y. Kousaka, and T. Motouchi. 1984. Condensational growth of ultrafine aerosol particles in a new particle size magnifier. Aerosol Sci. Technol. 3 (4):353–66. doi:10.1080/02786828408959024.
- Orsini, D. A., K. Rhoads, K. McElhoney, E. Schick, D. Koehler, and O. Hogrefe. 2008. A water cyclone to preserve insoluble aerosols in liquid flow - An interface to flow cytometry to detect airborne nucleic acid. Aerosol Sci. Technol. 42 (5):343–56. doi:10.1080/02786820802072881.
- Romay, F. J., A. M. Collins, W. D. Dick, L. Li, C. W. Fandrey, and B. Y. H. Liu. 2016. Water-based single-flow mixing condensation particle counter. Aerosol Sci. Technol. 50 (12):1320–6. doi:10.1080/02786826.2016.1222510.
- Seto, T., K. Okuyama, L. de Juan, and J. Fernández de la Mora. 1997. Condensation of supersaturated vapors on monovalent and divalent ions of varying size. J. Chem. Phys. 107 (5):1576–85. doi:10.1063/1.474510.
- Tilly, T. B., R. X. Ward, J. K. Luthra, S. E. Robinson, A. Eiguren-Fernandez, G. S. Lewis, R. L. Salisbury, J. A. Lednicky, T. L. Sabo-Attwood, S. M. Hussain, et al. 2019. Condensational particle growth device for reliable cell exposure at the air–liquid interface to nanoparticles. Aerosol Sci. Technol. 53 (12):1415–28. doi:10.1080/02786826.2019.1659938.
- Vanhanen, J., J. Mikkilä, K. Lehtipalo, M. Sipilä, H. E. Manninen, E. Siivola, T. Petäjä, and M. Kulmala. 2011. Particle size magnifier for nano-CN detection. Aerosol Sci. Technol. 45 (4):533–42. doi:10.1080/02786826.2010.547889.
- Wang, D., J. Jiang, J. Deng, Y. Li, and J. Hao. 2020. A sampler for collecting fine particles into liquid suspensions. Aerosol Air Qual. Res. 20 (3):654–62. doi:10.4209/aaqr.2019.12.0616.
- Weber, R., D. Orsini, Y. Duan, K. Baumann, C. S. Kiang, W. Chameides, Y. N. Lee, F. Brechtel, P. Klotz, P. Jongejan, et al. 2003. Intercomparison of near real time monitors of PM2.5 nitrate and sulfate at the U.S. Environmental Protection Agency Atlanta supersite. J. Geophys. Res. 108 (D7):1–13. doi:10.1029/2001JD001220.
- Weber, R. J., D. Orsini, Y. Daun, Y. N. Lee, P. J. Klotz, and F. Brechtel. 2001. A particle-into-liquid collector for rapid measurement of aerosol bulk chemical composition. Aerosol Sci. Technol. 35 (3):718–27. doi:10.1080/02786820152546761.