
 ?Mathematical formulae have been encoded as MathML and are displayed in this HTML version using MathJax in order to improve their display. Uncheck the box to turn MathJax off. This feature requires Javascript. Click on a formula to zoom.
Abstract
Coronavirus disease (COVID-19) has infected many people worldwide. As the probability of being infected by the virus increases with an increase in the number of people gathered in an indoor space, methods for reducing its spread indoors are urgently required. In this study, a classroom with 25 students was considered as an indoor space, and an attempt was made to devise a method to reduce the concentration of the viruses generated indoors more effectively. Through numerical analysis, the age of air inside the classroom was compared and analyzed when both the air cleaner and natural ventilation were used. The age of air varied locally in the classroom depending on the position of the air cleaner, confirming its importance in effectively removing particles possibly containing viruses generated indoors. When the air cleaner flow rate was doubled, the age of air was almost halved, implying that the concentration of the particles including viruses generated indoors can be reduced efficiently by increasing the air cleaner flow rate. Natural ventilation performed by completely opening the windows and doors of the classroom reduced the age of air. It was observed that the operation of the air cleaner along with open windows and doors of the classroom reduced the concentration of the particles including viruses generated indoors more effectively. More specifically, when both natural ventilation and air cleaner were applied, the age of air decreased by almost 50% compared with the only air cleaner case and by about 22% compared with the only natural ventilation case.
Copyright © 2021 American Association for Aerosol Research
EDITOR:
1. Introduction
As coronavirus disease (COVID-19), a novel virus, is known to be highly infectious worldwide, the interest in eliminating the virus and reducing its spread has been increasing. In particular, as the probability of infection increases with the increase in the number of people residing in a closed indoor space, proper ventilation is very important for reducing the spread of the viruses generated indoors. The spread of viruses can be caused by droplet transmission, airborne transmission, or fomite transmission (Wei and Li Citation2016; Chen et al. Citation2020). Droplets larger than 5 μm are referred to as respiratory droplets, and the droplet transmission from an infected person to a susceptible person can occur within 1 m distance; while droplets smaller than 5 μm are called droplet nuclei or aerosols, and the airborne transmission, meaning the dissemination of aerosols, can occur over long distance and time (World Health Organization Citation2020). Many studies have reported that the COVID-19 spreads mainly by droplet transmission. However, saliva droplets that reduced in size after evaporation can remain suspended in the air over an extended period of time (World Health Organization Citation2014). Therefore, the possibility of airborne infection in a limited space has also been raised (Asadi et al. Citation2020; Mittal, Ni, and Seo Citation2020; Morawska and Cao Citation2020).
Morawska et al. (Citation2009) investigated the size of the droplets generated by human expiratory activities using wind tunnel test equipment and found that the droplet size ranged from 0.3 to 20 μm. Liu et al. (Citation2017) conducted a computational fluid dynamics (CFD) study on the movement of droplets between two persons standing at a short distance through the nose and mouth, and discovered that exposure to droplets increased when the infected person was at a distance of less than 1–1.5 m and also that a change in humidity affected the spread of the virus. Wells (Citation1934) conducted research on the characteristics of the droplets discharged into the air and observed that larger droplets descended more rapidly toward the ground, while smaller droplets were suspended in the air as they reduced in size after rapid evaporation. Holmgren et al. (Citation2010) conducted research on the size of the particles discharged through human breathing and reported that particles in the size range of 0.01–2.0 μm were generated through breathing. Gao et al. (Citation2009) conducted research on the particle concentration and risk of viral infection and concluded that higher infection risks were associated with smaller particles. Ge et al. (Citation2013) conducted research on the inhalation of micron particles by the respirator of a standing mannequin and observed that the amount of particles inhaled by the respirator varied depending on the orientation of the mannequin in the freestream. Setti et al. (Citation2020) examined the correlation between particulate matter (PM10) concentration and COVID-19 and reported that the risk of viral infection can be reduced by decreasing the PM10 concentration. Yu et al. (Citation2017) conducted a CFD study on the particle behavior in hospital rooms using the properties of three respiratory viruses namely, Middle East respiratory syndrome Coronavirus (MERS-CoV), Severe Acute Respiratory Syndrome Coronavirus (SARS-CoV), and Hemagglutinin Type 1 and Neuraminidase Type 1 (H1N1) influenza virus. It was concluded that the position of a virus-infected patient could affect the infection risks of other patients and increasing the air exchange rate could greatly lower the possibility of deposition of viruses on indoor surfaces thereby reducing the indirect-contact infection. Villafruela et al. (Citation2013) studied the movement of fine contaminant particles in an isolated room with a virus-infected patient and found that the air diffuser type influenced the flow pattern and thereby the risk of infection. As described, virus-containing particles may spread indoors and cause infection under the influence of various conditions. Therefore, it is necessary to prepare effective control methods to eliminate the viruses generated indoors and reduce their concentration.
Liu et al. (Citation2018) collected particles at the rooftop of a building and analyzed the pathogenic bacteria contained in the atmospheric particles, and they found that more pathogenic bacteria were collected as the air quality index became higher. According to the results of Feng et al. (Citation2016), Liang et al. (Citation2014), Liu et al. (Citation2019), and Su et al. (Citation2019), the transmission of influenza was found to increase as the particulate matter (PM) concentration in the atmosphere became higher. Yao et al. (Citation2020) investigated the correlation between the PM pollution and the case fatality rate of COVID-19, and they reported that the death rate due to COVID-19 increased with increasing PM concentration. The results of these studies imply that the PM concentration is closely associated with the number of viruses contained in the atmospheric aerosols. Therefore, to lower the PM concentration in a considered space is thought to be one of the effective ways to reduce the concentration of viral particles suspended in the air.
Various ventilation methods such as mechanical ventilation, natural ventilation, and air cleaners can be used to reduce the PM concentration indoors, i.e., to eliminate infectious agents indoors. Recently constructed buildings are well equipped with mechanical ventilation systems; however, in most cases, old buildings lack such ventilation systems. Therefore, it is necessary to examine the effects of ventilation methods that use natural ventilation and air cleaners. Many studies have been conducted to improve the quality of indoor air using air cleaners. Gao and Zhang (Citation2010) assessed the effect of air cleaners in the living room using volatile organic compounds (VOCs) and particles, and reported that the concentrations of hazardous substances could be reduced by the operation of air cleaners. Qian et al. (Citation2010) observed the particle number concentration in a 6-person ward while operating air cleaners with a high-efficiency particulate air (HEPA) filter, and observed that increasing the air exchange rate in a ward was effective in terms of removing particles. Noh and Yook (Citation2016) evaluated the indoor air quality of a classroom using three types of air cleaners to lower particle number concentration, and they found that the air quality improved when all the air cleaners were operated. Noh et al. (Citation2018) conducted research on the indoor air quality of a 4-person ward using a ventilation system and air cleaners, and observed that using both ventilation system and air cleaner was helpful in lowering the particle number concentration and thus improving the air quality. Akbari and Salmanzadeh (Citation2019) conducted research on the effect of the positions of three air distribution systems and an air cleaner, and observed that the performance of the air cleaner could be determined by the position and type of the air distribution system. Novoselac and Siegel (Citation2009) compared the particle removal performance according to the position of air cleaners in a residential space with four rooms by measuring the number concentration of particles with a median size of 0.74 μm, generated by burning incense in a room to simulate a localized particle source and make the indoor particle concentration much higher than the background level, and observed that the particle removal performance improved when the outdoor air introduced by a duct blaster installed on a window of a room was well mixed with the air flow by the air cleaner. Therefore, for cases in which both infiltration of outdoor air and use of air cleaners are applied, it is necessary to determine proper location of air cleaners to more effectively eliminate or reduce particles including viral particles indoors.
In this study, a classroom was considered as an indoor space with many people. According to Yonker et al. (Citation2020), young people of ages 0–22 may be an important source of virus spread even though they have mild disease or lack of symptoms. Therefore, an efficient ventilation strategy is required to reduce the spread of viruses in the classroom, especially the classroom without a mechanical ventilation system. Few studies have been conducted on the effect of applying both air cleaners and natural ventilation to effectively eliminate viruses in classrooms. As such, in this study, an experiment on particle removal performance and numerical analysis was conducted for an actual classroom, and the experimental and numerical analysis results were compared and verified using the age of air as an air quality evaluation index. The age of air was compared according to the natural ventilation method and the operating conditions of the air cleaner.
2. Research method
2.1. Description of classroom
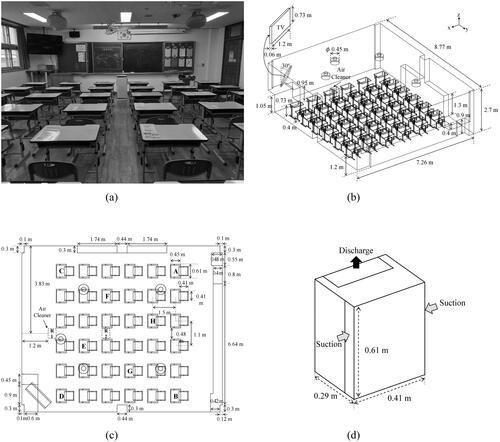
Prior to conducting research in consideration of the standard classroom, an experiment on particle removal by air cleaners was performed inside an actual classroom. shows a middle school classroom in Osan, South Korea. shows a photograph taken from the back of the classroom. While the photograph does not show everything inside the classroom, but there were outer windows on the left side and windows and doors facing the hallway on the right side of the classroom. A total of 36 sets of desks and chairs were arranged in six rows and six columns. The distance between the desks were 1.5 m in the longitudinal direction and 1.1 m in the lateral direction. The experiment was performed with no students. shows the computational domain of the classroom for conducting the numerical analysis. The dimensions of the classroom consisted of a length of 8.77 m, a width of 7.26 m, and a height of 2.7 m. Thus, various geometries that could affect the air flow in the classroom were considered. As all five electric fans installed on the ceiling were covered with a plastic bag, their geometry was simplified as a cylinder. The cabinets at the front and back of the classroom as well as the bookcases on the wall facing the hallway were simplified in terms of geometry. The TV hanging on the outer wall at the front of the classroom was simplified as a slanted flat panel. The volume of the empty space occupied by air, excluding the volumes of various objects in the classroom, was 163.88 m3. shows the top view of the classroom. The positions of eight measurement points for the particle number concentration (A, B, C, D, E, F, G, and H) and two air cleaner installation points (R1 and R2) are shown. The measurement height for the particle number concentration (i.e., the position of the respiratory system) was assumed to be 0.92 m from the floor, considering that 13-y-old Korean students have an average popliteal height of 0.4 m, an average sitting shoulder height of 0.52 m, and are slightly inclined forward during learning (https://sizekorea.kr). shows a schematic diagram of the air cleaner (Carrier, model CAP-D046WSA) used in the experiment. Indoor air was sucked into the air cleaner through left and right sides, and filtered air was discharged vertically from its top. The dimensions of the air cleaner were 0.41 × 0.29 × 0.61 m, and the areas of the inlet and outlet were 0.0427 and 0.0495 m2, respectively. The operating flow rate of the air cleaner was 285 cubic meter per hour (CMH). A brand new HEPA-grade filter was installed in the air cleaner. The clean air delivery rate (CADR) of the air cleaner used in the experiment was obtained by following the procedure of Noh and Oh (Citation2015), and it was determined to be 2.82 m3/min for the particle size of 0.3 μm and the filter collection efficiency of 99%.
Figure 1. Actual classroom where an experiment was performed in Osan, South Korea: (a) photograph of the classroom (taken from the back); (b) modeled classroom (Iso View); (c) air cleaner placement and measurement point setting (top view); (d) air cleaner type used in the experiment.
Because every school nationwide has different classroom dimensions as well as different numbers and arrangements for desks and chairs depending on the situation, a numerical parametric study was conducted considering the M-75 geometry among Korean standard classrooms. shows the geometry of the standard classroom M-75. The classroom size was 9 × 7.5 × 3.3 m. The number of desks and chairs were set to 25, arranged in five rows and five columns based on the statistics of the average number of students per classroom in the elementary, middle, and high schools in Korea. The distance between the desks was set to 1.25 m in both the longitudinal and lateral directions. As each school has different standards for arrangement of bookcases and cabinets that are additionally installed in classrooms, only desks, chairs, and air cleaners were placed in this study. The volume of the empty space occupied by air, excluding the volume of the desks, chairs, and air cleaners in the classroom, was 222.01 m3. Like most classrooms in Korea, four outer windows and two hallway windows were set, and two doors on the hallway (one at the front and one at the back of the classroom) were considered. The area of each window was 1 × 1 m, and the area of each door was set to 0.8 × 2 m when fully opened. Natural ventilation was performed only in one direction (from the outside to the hallway or from the hallway to the outside) by considering the situation where both windows and doors were open. In reality, the direction of natural ventilation flow frequently changes depending on weather condition. However, in order to simplify the numerical model, the natural ventilation was assumed to be a one way directional flow. It was assumed that the natural ventilation flow rate satisfied 6 air changes per hour (ACH) when all windows and doors were fully opened, where 6 ACH is the minimum requirement for natural ventilation recommended by the World Health Organization (Citation2021). Therefore, the flow velocities of air through the windows and doors were set to 0.09 and 0.06 m/s, respectively. Meanwhile, natural ventilation under the same flow velocity conditions when each window and door were half-opened was also considered. At this instance, the natural ventilation flow rate was 3 ACH. shows the top view of the standard classroom M-75. The positions and direction of each air cleaner is shown through four points (S1, S2, S3, and S4). The measurement height for the age of air was set to 0.92 m from the floor. S1 and S4 correspond to positions R1 and R2 in , respectively. shows the measurement points at which the numerical analysis results were examined. The position of the desk at the center (V) and those at the four corners (I, II, III, and IV) were considered. shows the two types of air cleaners assumed in the numerical analysis. It should be noted that these shapes of air cleaners were arbitrarily determined by referring to many different types of air cleaners in the market. One discharged the filtered air vertically upward, while the other discharged the filtered air horizontally from the top of the frontal part. The size of the air cleaner was set to 0.5 × 0.5 × 1 m, and the areas of the inlet and outlet were set to 0.16 and 0.032 m2, respectively. Meanwhile, the height of the outlet of the air cleaner was considered at 1 and 2 m from the classroom floor. shows the numerical analysis cases for the standard classroom M-75. Only the air cleaner was operated in the classroom for cases 1–10, and natural ventilation was applied for cases 11–14. For cases 15–18, both air cleaner and natural ventilation were used. The flow rate of the air cleaner was set to 576 or 1,152 CMH, in accordance with the flow rates in natural ventilation which are approximately 3 and 6 ACH, respectively. In case of the air cleaner flow rate of 576 CMH and the particle size of 0.3 μm, the CADRs of the air cleaner assumed in the simulation were evaluated by following the procedure of Noh and Oh (Citation2015), and the CADRs were estimated to be 5.51 m3/min, 2.78 m3/min, and 0 m3/min for the filter collection efficiencies of 99%, 50%, and 0%, respectively.
Figure 2. Standard classroom model M-75: (a) classroom sketch showing dimensions of the walls (Iso View); (b) air cleaner positions; (c) measurement point setting for numerical analysis; (d) air cleaner models set for numerical analysis.
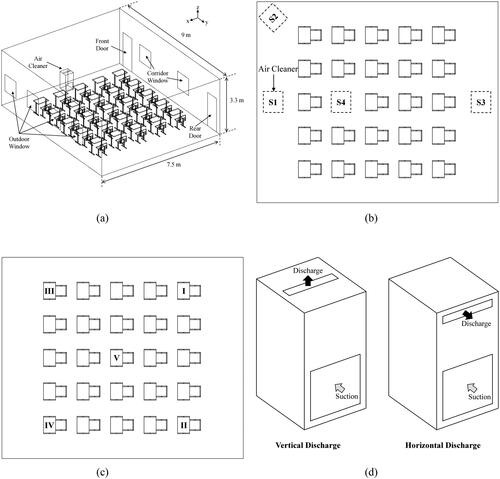
Table 1. Setting of numerical analysis cases for air cleaner and natural ventilation.
2.2. Experimental method
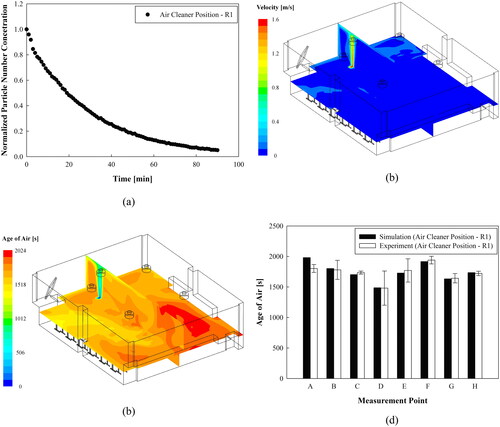
The age of air in the classroom was experimentally obtained by measuring the reduction in the particle number concentration, caused by the operation of the air cleaner. The particle number concentration was monitored at eight points from A to H in using optical particle counters (OPC; Model 1.109, GRIMM, Ainring, Germany), which measures number concentration of particles in the size range from 0.25 μm to 32 μm with 31 size channels. Fine particles were generated in large quantities through incense burning, according to the research results of Ji et al. (Citation2010). When the PM10 concentration in the closed classroom exceeded 100 μg/cm3, incense burning was stopped and electric fans were operated for more than 10 min to evenly distribute the particles inside the classroom. After turning off the fans and stabilizing the particle number concentration in the classroom for approximately 10 min, the air cleaner was operated. is an example of the measurement results that shows the change in particle number concentration from 5 min (t = 0) after operating the air cleaner. The y-axis denotes the number concentration normalized using the number concentration value at t = 0. As the measured particle number concentration decreased exponentially, it was curve-fitted using EquationEquation (1)(1)
(1) below in accordance with the method of Noh et al. (Citation2018) to calculate the age of air.
(1)
(1)
where C is the particle number concentration over time, C0 is the residual particle number concentration, A is the initial particle number concentration, t is the time, and τ is the experimentally obtained age of air. For each of the air cleaner positions of R1 and R2 shown in , the age of air was calculated by repeating the experiment three times.
Figure 3. (a) Example of experimental measurement; (b) flow analysis results when the air cleaner is operated at position R1; (c) age-of-air analysis results when the air cleaner is operated at position R1; (d) verification results of comparison between the experiment and numerical analysis (the error bars were obtained by repeating the experiment three times).
2.3. Numerical method
The flow and the age of air were analyzed using ANSYS FLUENT Release 16.1, a commercial CFD code. The air flow in the classroom was assumed to be steady, incompressible, and turbulent. The k–ε turbulence model was used for turbulent flow analysis (Chen et al. Citation2011; Kong et al. Citation2017; Wu and Ahmed Citation2012). The temperatures inside and outside the classroom were assumed to be 20 °C, and the pressure was set to 101.3 kPa. The boundary conditions for flow analysis were as follows: the wall condition was assigned to the walls, ceiling, and floor of the classroom, as well as the surfaces of various objects in the classroom. The outlet and inlet of the air cleaner were set as the velocity inlet and pressure outlet, respectively. When the inlet was set as the pressure outlet, the target mass flow rate was assumed in a manner that the flow rate at the outlet was equal to that at the inlet. In case of natural ventilation through the windows and doors, the velocity inlet condition was assigned to surfaces where air was introduced and the pressure outlet condition to surfaces where air was discharged. For the closed classroom where natural ventilation was not applied, the wall condition was set for the windows and doors. Meshes were generated using tetrahedral grids, and an appropriate number of grids were determined through a grid independence test. For the analysis of the classroom shown in , the number of grids ranged from three to five million. For the analysis of the standard classroom M-75 shown in , the number of grids ranged from eight to ten million.
The equations used to calculate the age of air using CFD are as follows:
(2)
(2)
(3)
(3)
where ρ is the air density, ui is the airflow velocity, and Φ is the age of the air. The diffusion term
can be obtained from the molecular diffusivity Dm and the turbulent diffusivity Dt. Because the age of air represents the time it takes for the introduced fresh air to reach a specific point, the lower age of air means that the concentration of pollutants decreases more rapidly because of the rapid introduction of fresh air. Meanwhile, a user-defined function (UDF) was prepared so that the filter efficiency could be reflected in calculating the age of air in the numerical analysis. The age of air was calculated by obtaining the average of the age of air formed on the inlet surface of the air cleaner and multiplying it by the filter efficiency, applied to the outlet surface.
3. Results and discussion
show the flow velocity and age of air distribution in the classroom, respectively. These are the results of the simulations performed for the case in which the air cleaner shown in was operated at position R1 in the classroom, as shown in . The flow discharged from the air cleaner affected only the front area of the classroom and hardly affected the rear area of the classroom. The age-of-air distribution corresponds to the results of the flow velocity distribution. In other words, the age of air was relatively low in the front area of the classroom, but it was relatively high in the rear area of the classroom. This is mainly due to the fact that the clean air discharged upward from the air cleaner was disturbed by the electric fans installed on the ceiling and thus could not efficiently spread along the ceiling toward the rear area of the classroom. compares the results obtained from the experiment and numerical analysis of the age of air. For all eight measurement points, the results obtained from numerical analysis were in good agreement with the experimental data, with errors less than 10%. For reference, when the air cleaner was placed at position R2, the simulation results were also in good agreement with the experimental results, as the errors were less than 10%. This confirms that the simulation method used in this study has a high prediction accuracy. Based on this, a numerical analysis of 18 cases listed in was conducted for standard classroom M-75. For reference, show the simulation results for the standard classroom M-75.
Figure 4. Simulation results of age of air according to the filter efficiency of the air cleaner: (a) filter efficiency of 99%; (b) filter efficiency of 50%; (c) filter efficiency of 0%.
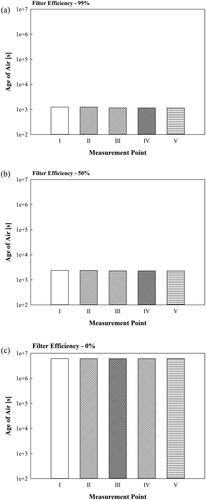
Figure 5. Simulation results of age of air according to the operating position of the air cleaner: (a) Case 1; (b) Case 2; (c) Case 3; (d) Case 4.
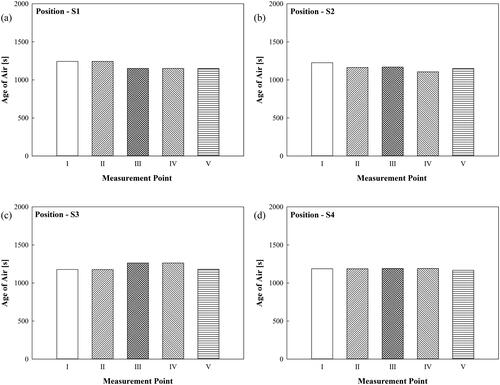
Figure 6. Simulation results of age of air according to the operating position and discharge height of the air cleaner: (a) Case 1; (b) Case 5; (c) Case 6; (d) Case 7; (e) Case 4; (f) Case 8.
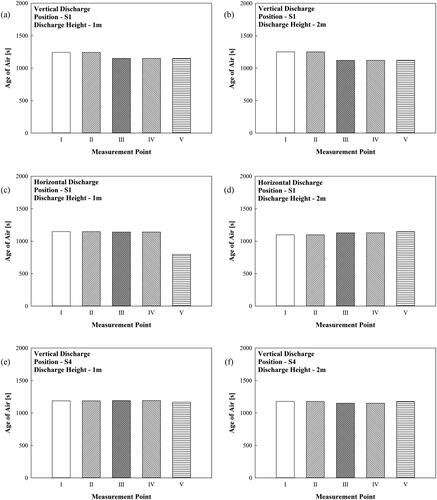
Figure 7. Simulation results of age of air according to the flow rate and discharge direction of the air cleaner: (a) Case 1; (b) Case 9; (c) Case 6; (d) Case 10.
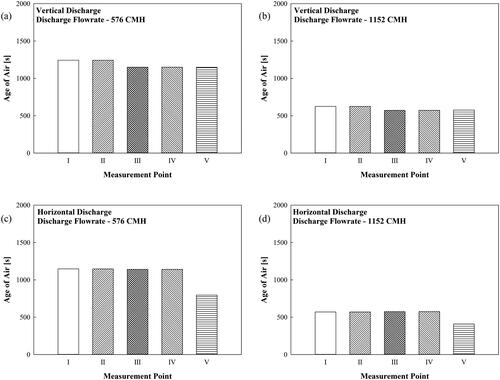
Figure 8. Simulation results for natural ventilation: (a) flow contour for Case 11; (b) age-of-air contour for Case 11; (c) age of air for Case 11; (d) age of air for Case 12; (e) age of air for Case 13; (f) age of air for Case S14.
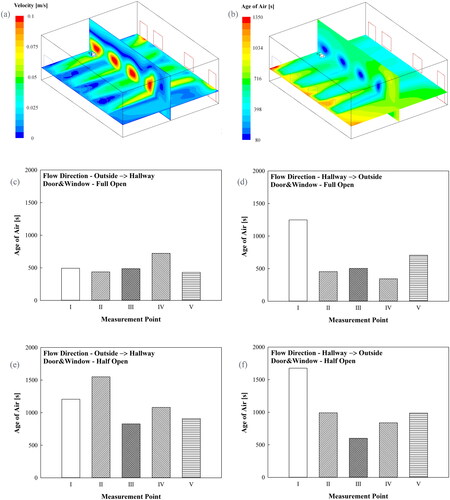
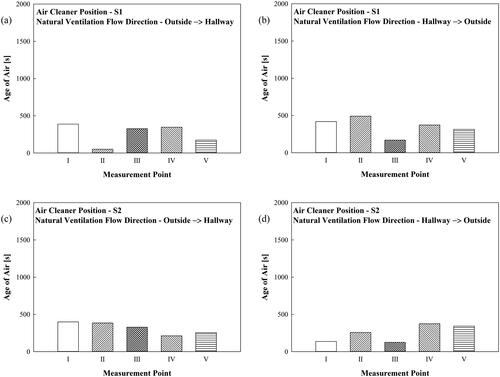
Figure 9. Simulation results of age of air for cases in which both natural ventilation and the air cleaner were utilized: (a) Case 15; (b) Case 16; (c) Case 17; (d) Case 18.
shows the results obtained by analyzing the age of air according to the filter efficiency of the vertical discharge type air cleaner, operated at position S1 in the closed classroom. Because this study focused on a rapid reduction in the concentration of aerosol particles possibly containing the viruses generated indoors, the filter efficiency mentioned here actually represents the efficiency of the air cleaner in eliminating viruses. The average age of air in the classroom was relatively low (1,188 s) when the filter efficiency of the air cleaner was 99% but it was very high when the filter efficiency reduced to 0%. At 50% filter efficiency, the average age of air was 2,318 s, approximately twice as high as the average age of air when the filter efficiency was 99%. In other words, when the filter efficiency of the air cleaner was low, virus-containing particles circulated indoors without being effectively removed by the air cleaner, thereby increasing the infection probability of occupants. As the filtration efficiency of electret filters are known to degrade over time (Kerner et al. Citation2021) and the used filters can be a source of viral particles (Niu et al. Citation2020; Nirmala et al. Citation2021), it is important to maintain high filter efficiency by regularly replacing the filter or technology by applying a device with high virus removal efficiency to the air cleaner. As a higher virus removal efficiency was desirable for the air cleaner, the filter efficiency of the air cleaner was assumed to be 99% for subsequent simulations.
shows the results of analyzing the age of air according to the position of the air cleaner when the air cleaner was solely operated in the closed classroom. A commonly used vertical discharge type air cleaner was assumed, and the height of the outlet was set to 1 m from the floor. For case 1, the air cleaner was operated in the frontal part of the classroom (position S1), and the age of air was relatively low at positions III and IV (front area) and position V (center), thus being affected by the flow of the air cleaner; however, the age of air was 93 s higher at positions I and II (rear area) compared to the front area as the flow of the air cleaner could not effectively reach these positions. For case 3, in which the air cleaner was operated in the rear area of the classroom (position S3), a tendency opposite to that of case 1 was observed. For case 2, in which the air cleaner was operated at the front corner of the classroom (position S2), the age of air was highest at position I and lowest at position IV. The difference in the age of air between positions I and IV was 119 s. The age of air was found to be similar at positions II, III, and V, which were located on the diagonal line facing the air cleaner. When the air ages at position II were compared between case 1 and case 2, the age of air at position II (rear area), which was far from the air cleaner, varied by 80 s. This implies that the area with sufficient flow can vary owing to the influence of the installation position and direction of the air cleaner even though the air cleaner is installed in the front area of the classroom. For case 4, in which the air cleaner was operated in the center of the classroom (position S4), the age of air was similar at all positions (I, II, III, IV, and V). Meanwhile, it was found that the variation of the air age at position V was small, even though the position of the air cleaner varied. These results indicate that the air cleaner must be installed considering areas in which virus reduction is important because the age of air at an indoor position varies depending on the installation position and direction of the air cleaner.
compares the age of air according to the discharge height and discharge direction of the air cleaner. The discharge height of the air cleaner was 1 m for cases 1, 4, and 6, and 2 m for cases 5, 7, and 8. The discharge direction of the air cleaner was vertical for cases 1, 4, 5, and 8, and horizontal for cases 6 and 7. Cases 1 and 5 had different discharge heights (1 m and 2 m, respectively), whereas vertical discharge type air cleaner was placed at position S1. As the filtered air vertically discharged and collided with the ceiling to spread the flow, the difference in age of air was less than 17 s depending on the discharge height. Cases 6 and 7 had different discharge heights (1 and 2 m, respectively), whereas the horizontal discharge type air cleaner was operated at position S1. Although there were differences depending on the measurement point, the horizontal discharge type air cleaner tended to show similar or lower age of air than the vertical discharge type air cleaner. In particular, for horizontal discharge type model with a discharge height of 1 m, the age of air was lowest at the center of the classroom (V). Next, Cases 4 and 8 had different discharge heights (1 and 2 m, respectively), while the vertical discharge type air cleaner was placed at position S4. The age of air was almost similar at all measurement points in the classroom, similar to the results shown in , but a discharge height of 2 m exhibited a slightly lower age of air than a discharge height of 1 m. These results indicate that the discharge height does not greatly affect the age of air in the vertical discharge type model, but a higher discharge height is slightly more helpful in reducing indoor viruses when the model is installed at the center of an indoor space. Additionally, an operating position closer to the target of virus removal is desirable. In the case of the horizontal discharge type air cleaner, it is desirable that the discharge height is close to the height of the human respiratory system. The horizontal discharge-type model appears to be much more effective than the vertical discharge-type model in reducing the concentration of viruses in the central area of an indoor space. However, some students facing the air flow discharged from the horizontal discharge-type air cleaner can feel uncomfortable. Therefore, special caution is required in the arrangement and position of the horizontal discharge-type model.
compares the age of air according to the discharge direction of the filtered air and the flow rate of the air cleaner. The air cleaner was operated at position S1 for all the cases. For cases 1 and 9, the flow rates were 576 CMH and 1,152 CMH, respectively, for the vertical discharge-type air cleaner. For cases 6 and 10, the flow rates were 576 CMH and 1,152 CMH, respectively, for the horizontal discharge-type air cleaner. For both discharge types, the age of the air decreased by approximately half as the flow rate doubled. In case of the vertical discharge-type air cleaner, the age of air in the front area of the classroom (III and IV) was lower than that in the rear area (I and II), and the difference in the age of air between the front and rear areas decreased from 93 s to 52 s when the flow rate was doubled. This is because the filtered air was spread more rapidly indoors owing to the increase in the flow rate. When the horizontal discharge-type air cleaner was used, the age of air was lower than that of the vertical discharge-type air cleaner operating at the same flow rate, and the difference in the age of air between the front and rear areas of the classroom was small. This indicates that a higher flow rate of the air cleaner is desirable, and the air cleaner that discharges filtered air horizontally at a height similar to that of the human respiratory system is more favorable for eliminating indoor viruses more effectively. However, special caution is required in placing the horizontal discharge-type air cleaner in the classroom by considering students’ comfortableness with the air flow.
shows the results of applying only natural ventilation by opening the outer windows, hallway windows, and doors. In this case, the air cleaner was not operated. Since the effective removal and lowering of concentration of the viruses generated indoors is considered in this study, the air introduced into the classroom through natural ventilation represents clean air that contains no virus. show the results of the CFD analysis that applied natural ventilation. The flow velocity and age of air distributions under the conditions of case 11 are shown as an example. The vertical observation surface was located in the middle of the classroom, and the horizontal observation surface was located 0.92 m from the floor (i.e., at the level of the nose of a student sitting slightly inclined forward during learning), which was 0.15 m lower than the lower ends of the windows. Fresh air from the outside was introduced into the classroom through the outer windows and discharged through the hallway windows and doors. Owing to natural ventilation, the age of air was generally low at positions where the fresh air introduced through the windows passed directly, but it was relatively high in areas where the flow was recirculated. compare the age of air according to the degree of opening of all the windows and doors and the direction of the natural ventilation flow. The natural ventilation flow rate corresponded to 6 ACH for cases 11 and 12 and 3 ACH for cases 13 and 14. The flow direction was from the outside to the hallway for cases 11 and 13, and from the hallway to the outside for cases 12 and 14. When the influence of the natural ventilation flow rate was examined, the cases corresponding to 6 ACH generally exhibited a lower age of air than the cases corresponding to 3 ACH. As for the influence of the direction of the natural ventilation flow, each point exhibited different tendencies in terms of the age of the air. While the average age of air was 137 s lower in case 11 than in case 12 under the 6 ACH flow rate condition, it was 96 s lower in case 14 than in case 13 under the 3 ACH flow rate condition. These results confirmed that natural ventilation can be effectively used to reduce the concentration of the viruses generated indoors, and that a higher natural ventilation flow rate is more favorable. It was found, however, that the local reduction effect indoors may vary widely depending on the degree of opening windows and doors and the flow direction of natural ventilation.
shows the results when both natural ventilation and the air cleaner were used, while all the windows and doors of the classroom were completely opened. The operating position of the air cleaner was set to S1 or S2, the flow rate was fixed at 576 CMH, and the natural ventilation flow direction was set from the outside to the hallway or the opposite direction. In comparison with the above results, cases in which either natural ventilation or air cleaner was applied, the age of air greatly decreased when natural ventilation and the air cleaner were used simultaneously. Comparison between cases 15 and 16, in which the air cleaner was installed at S1, case 15 exhibited a lower age of air at all measurement points than case 16, except for position III, and the average value was 257 s lower. In particular, the age of air at position II was as low as 50 s, indicating that the air quality at a particular position can be much improved in terms of the removal of the viruses generated indoors compared to the previous results. Meanwhile, when cases 17 and 18 in which the air cleaner was installed at S2 were compared, it was found that there was no big difference in the average age of air depending on the natural ventilation flow direction, even though there were differences in the age of air at each measurement point. Particularly, for case 18, the air introduced through natural ventilation was sucked into the air cleaner at position III, which resulted in an active inflow of air through the hallway windows. To compare the cases in which both the air cleaner and natural ventilation were used, in contrast with those in which either of them was used, the average age of air was compared among case 1, 11, and 15. Case 15 exhibited an approximately 50% lower average age of air than case 1 and approximately 22% lower average age of air than case 11. When each ventilation method is used alone, the age of air can be reduced by increasing the flow rate, but there is a limit to increasing the flow rate of the air cleaner or natural ventilation. Therefore, the application of both natural ventilation and the air cleaner was found to be much more effective in reducing the spread of infectious agents, by rapidly decreasing the concentration of the viruses generated indoors.
4. Conclusion
In this study, apart from the effective removal of the virus-containing particles generated indoors, the age of air in a classroom was compared and analyzed according to the application of an air cleaner and natural ventilation. It was confirmed that the use of an air cleaner indoors can change the age of air depending on the filter efficiency of the air cleaner, and that the age of indoor air increases as the filter efficiency decreases. If the filter efficiency is low, re-discharging the virus particles that are not removed by the filter of the air cleaner can increase the risk of infection for indoor occupants. Therefore, it is important to maintain a high filter efficiency of the air cleaner to reduce the probability of infection indoors. The age of air decreased as the flow rate increased, regardless of the discharge direction of the air cleaner, and the age of air indoors varied locally depending on the operating position of the air cleaner. In case of the vertical discharge-type air cleaner, there was almost no difference in the indoor air quality, thus being independent of the discharge height. In case of the horizontal discharge-type air cleaner, a discharge height of 1 m (i.e., a height similar to the height of the respiratory system of a seated student) was found to be more favorable for removal of the viruses generated indoors. In case of natural ventilation, the local indoor air quality was greatly influenced by the direction and flow rate of natural ventilation flow. Meanwhile, for the cases in which both the air cleaner and natural ventilation were used, the average age of air was lower when the air cleaner was placed at the front and center of the classroom (position S1) under the natural ventilation flow direction from the outside to the hallway. In contrast, under the natural ventilation flow direction from the hallway to the outside, the average age of air was lower when the air cleaner was placed at the front corner of the classroom (position S2). Regardless of the operating position of the air cleaner and the natural ventilation flow direction, the age of air was much lower when both the air cleaner and natural ventilation were used simultaneously than when either of them was used alone. Therefore, it is recommended that air cleaners be operated while windows and doors are opened to rapidly and effectively reduce the number concentration of virus containing particles generated in a classroom. For future studies, it is deemed necessary to derive the optimal conditions for reducing the spread of the viruses generated in a classroom by systematically analyzing the effects of the operating position and number of air cleaners under the simultaneous application of natural ventilation.
Additional information
Funding
References
- Asadi, S., N. Bouvier, A. S. Wexler, and W. D. Ristenpart. 2020. The coronavirus pandemic and aerosols: Does COVID-19 transmit via expiratory particles? Aerosol Sci. Technol. 54 (6): 635–638. doi:10.1080/02786826.2020.1749229.
- Akbari, V., and M. Salmanzadeh. 2019. Numerical evaluation of the effect of air distribution system and location on performance of a portable air cleaner. Sci. Technol. Built Environ. 25 (1):34–45. doi:10.1080/23744731.2018.1493310.
- Chen, F., H. Chen, J. Xie, Z. Shu, and J. Mao. 2011. Air distribution in room ventilated by fabric air dispersion system. Build. Environ. 46 (11):2121–9. doi:10.1016/j.buildenv.2011.04.016.
- Chen, W., N. Zhang, J. Wei, H. L. Yen, and Y. Li. 2020. Short-range airborne route dominates exposure of respiratory infection during close contact. Build. Environ. 176:106859. doi:10.1016/j.buildenv.2020.106859.
- Feng, C., J. Li, W. Sun, Y. Zhang, and Q. Wang. 2016. Impact of ambient fine particulate matter (PM2.5) exposure on the risk of influenza-like-illness: A time-series analysis in Beijing, China. Environ. Health 15:17. doi:10.1186/s12940-016-0115-2.
- Gao, N. P., J. L. Niu, M. Perino, and P. Heiselberg. 2009. The airborne transmission of infection between flats in high-rise residential buildings: Particle simulation. Build. Environ. 44 (2):402–10. doi:10.1016/j.buildenv.2008.03.016.
- Gao, Z., and J. S. Zhang. 2010. Numerical analysis for evaluation the “exposure reduction effectiveness” of room air cleaners. Build. Environ. 45 (9):1984–92. doi:10.1016/j.buildenv.2010.02.004.
- Ge, Q., X. Li, K. Inthavong, and J. Tu. 2013. Numerical study of the effects of human body heat on particle transport and inhalation in indoor environment. Build. Environ. 59:1–9. doi:10.1016/j.buildenv.2012.08.002.
- Holmgren, H., E. Ljungstrom, A. C. Almstrand, B. Bake, and A. C. Olin. 2010. Size distribution of exhaled partilcles in the range from 0.01 to 2.0 μm. J. Aerosol Sci. 41 (5):439–46. doi:10.1016/j.jaerosci.2010.02.011.
- Ji, X., O. Le Bihan, O. Ramalho, C. Mandin, B. D'Anna, L. Martinon, M. Nicolas, D. Bard, and J.-C. Pairon. 2010. Characterization of particles emitted by incense burning in an experimental house. Indoor Air. 20 (2):147–58. doi:10.1111/j.1600-0668.2009.00634.x.
- Kerner, M., K. Schmidt, S. Schumacher, C. Asbach, and S. Antonyuk. 2021. Electret filters—From the influence of discharging methods to optimization potential. Atmosphere 12 (1):65. doi:10.3390/atmos12010065.
- Kong, M., T. Q. Dang, J. Zhang, and H. E. Khalifa. 2017. Micro-environmental control for efficient local cooling. Build. Environ. 118:300–12. doi:10.1016/j.buildenv.2017.03.040.
- Liang, Y., L. Fang, H. Pan, K. Zhang, H. Kan, J. R. Brook, and Q. Sun. 2014. PM2.5 in Beijing - Temporal pattern and its association with influenza. Environ. Health 13:102. doi:10.1186/1476-069X-13-102.
- Liu, H., X. Zhang, H. Zhang, X. Yao, M. Zhou, J. Wang, Z. He, H. Zhang, L. Lou, W. Mao, et al. 2018. Effect of air pollution on the total bacteria and pathogenic bacteria in different sizes of particulate matter. Environ. Pollut. 233:483–93. doi:10.1016/j.envpol.2017.10.070.
- Liu, L., Y. Li, P. V. Nielsen, J. Wei, and R. L. Jensen. 2017. Short-range airborne transmission of expiratory droplets between two people. Indoor Air. 27 (2):452–62. doi:10.1111/ina.12314.
- Liu, X. X., Y. Li, G. Qin, Y. Zhu, X. Li, J. Zhang, K. Zhao, M. Hu, X. L. Wang, and X. Zheng. 2019. Effects of air pollutants on occurrences of influenza-like illness and laboratory-confirmed influenza in Hefei. Int. J. Biometeorol. 63 (1):51–60. doi:10.1007/s00484-018-1633-0.
- Mittal, R., R. Ni, and J. H. Seo. 2020. The flow physics of COVID-19. J. Fluid Mech. 894 (F2):1–14. doi:10.1017/jfm.2020.330.
- Morawska, L., and J. Cao. 2020. Airborne transmission of SARS-CoV-2: The world should face the reality. Environ. Int. 139:105730. doi:10.1016/j.envint.2020.105730.
- Morawska, L., G. R. Johnson, Z. D. Ristovski, M. Hargreaves, K. Mengersen, S. Corbett, C. Y. H. Chao, Y. Li, and D. Katoshevski. 2009. Size distribution and sites of origin of droplets expelled from the human respiratory tract during expiratory activities. J. Aerosol Sci. 40 (3):256–69. doi:10.1016/j.jaerosci.2008.11.002.
- Nirmala, J., G. Alves, C. Vilalta, M. Yang, A. Rendahl, B. Olson, and M. Torremorell. 2021. Evaluation of viral RNA extraction methods to detect porcine reproductive and respiratory syndrome and influenza A viruses from used commercial HVAC air filters from swine farms. J. Aerosol Sci. 151:105624. doi:10.1016/j.jaerosci.2020.105624.
- Niu, M., F. Shen, F. Zhou, T. Zhu, Y. Zheng, Y. Yang, Y. Sun, X. Li, Y. Wu, P. Fu, et al. 2020. Indoor air filtration could lead to increased airborne endotoxin levels. Environ. Int. 142:105878. doi:10.1016/j.envint.2020.105878.
- Noh, J. H., J. Lee, K. C. Noh, Y. W. Kim, and S. J. Yook. 2018. Effects of hospital ward curtains on ventialtion in a four-bed hospital ward. Aerosol Air Qual. Res. 18 (10):2643–53. doi:10.4209/aaqr.2017.11.0469.
- Noh, K. C., and M. D. Oh. 2015. Variation of clean air delivery rate and effective air cleaning ratio of room air cleaning devices. Build. Environ. 84:44–9. doi:10.1016/j.buildenv.2014.10.031.
- Noh, K. C., and S. J. Yook. 2016. Evaluation of clean air delivery rates and operating cost effectiveness for room air cleaner and vetilation system in a small lecture room. Energy Build 119:111–8. doi:10.1016/j.enbuild.2016.03.027.
- Novoselac, A., and J. A. Siegel. 2009. Impact of placement of portable air cleaning devices in multizone residential environments. Build. Environ. 44 (12):2348–56. doi:10.1016/j.buildenv.2009.03.023.
- Qian, H., Y. Li, H. Sun, P. V. Nielsen, X. Huang, and X. Zheng. 2010. Particle removal efficiency of the portable HEPA air cleaner in a simulated hospital ward. Build. Simul. 3 (3):215–24. doi:10.1007/s12273-010-0005-4.
- Setti, L., F. Passarini, G. D. Gennaro, P. Barbieri, M. G. Perrone, M. Borelli, J. Palmisani, A. D. Gilio, V. Torboli, F. Fontana, et al. 2020. SARS-Cov-2RNA found on particulate matter of Bergamo in Northern Italy: First evidence. Environ. Res. 188:109754. doi:10.1016/j.envres.2020.109754.
- Su, W., X. Wu, X. Geng, X. Zhao, Q. Liu, and T. Liu. 2019. The short-term effects of air pollutants on influenza-like illness in Jinan, China. BMC Public Health 19 (1):1319. doi:10.1186/s12889-019-7607-2.
- Villafruela, J. M., F. Castro, J. F. S. Jose, and J. Saint-Martin. 2013. Comparison of air change efficiency, comtaminant removal effectiveness and infection risk as IAQ indices in isolation rooms. Energy Build. 57:210–9. doi:10.1016/j.enbuild.2012.10.053.
- Wei, J., and Y. Li. 2016. Airborne spread of infectious agents in the indoor environment. Am. J. Infect. Control. 44 (9 Suppl):S102–S108. doi:10.1016/j.ajic.2016.06.003.
- Wells, W. F. 1934. On air-borne infection: Study II. Droplets and droplet nuclei. Am. J. Epidemiol. 20 (3):611–8. doi:10.1093/oxfordjournals.aje.a118097.
- World Health Organization. 2014. Infection prevention and control of epidemic and pandemic prone acute respiratory infections in health care. Accessed June 2, 2021. https://apps.who.int/iris/rest/bitstreams/515717/retrieve.
- World Health Organization. 2020. Transmission of SARS-CoV-2: Implications for infection prevention precautions. Accessed June 2, 2021. https://apps.who.int/iris/rest/bitstreams/1286634/retrieve.
- World Health Organization. 2021. Roadmap to improve and ensure good indoor ventilation in the context of COVID-19. Accessed June 2, 2021. https://apps.who.int/iris/rest/bitstreams/1333991/retrieve.
- Wu, C., and N. A. Ahmed. 2012. A novel mode of air supply for aircraft cabin ventilation. Build. Environ. 56:47–56. doi:10.1016/j.buildenv.2012.02.025.
- Yao, Y., J. Pan, W. Wang, Z. Liu, H. Kan, Y. Qiu, X. Meng, and W. Wang. 2020. Association of particulate matter pollution and case fatality rate of COVID-19 in 49 Chinese cities. Sci. Total Environ. 741:140396. doi:10.1016/j.scitotenv.2020.140396.
- Yonker, L. M., A. M. Neilan, Y. Bartsch, A. B. Patel, J. Regan, P. Arya, E. Gootkind, G. Park, M. Hardcastle, A. S. John, et al. 2020. Pediatric severe acute respiratory syndrome coronavirus 2 (SARS-CoV-2): Clinical presentation, infectivity, and immune responses. J. Pediatr. 227:45–52. doi:10.1016/j.jpeds.2020.08.037.
- Yu, H. C., K. W. Mui, L. T. Wong, and H. S. Chu. 2017. Ventilation of general hospital wards for mitigating infection risks of three kinds of viruses including Middle East respiratory syndrome coronavirus. Indoor Built Environ. 26 (4):514–27. doi:10.1177/1420326X16631596.