
Abstract
The performing arts have been significantly restricted due to the severe acute respiratory syndrome coronavirus 2 (SARS-CoV-2) pandemic. We report measurements of aerosol and droplet concentrations generated when playing woodwind and brass instruments and comparisons with breathing, speaking, and singing. These measurements were conducted in a room with zero number concentration aerosol background in the 0.5-20 µm diameter size range, allowing clear attribution of detected particles to specific activities. A total of 13 instruments were examined across 9 participants. Respirable particle number concentrations and size distributions for playing instruments are consistent with those from the participant when breathing, based on measurements with multiple participants playing the flute and piccolo as well as measurements across the entire cohort. Due to substantial interparticipant variability, we do not provide a comparative assessment of the aerosol generated by playing different instruments, instead considering only the variation in aerosol yield across all instruments studied. Both particle number and mass concentrations from playing instruments are lower than those from speaking and singing at high volume, and no large droplets >20 µm diameter are detected. Combined, these observations suggest that playing instruments generates less aerosol than speaking or singing at high volumes. Moreover, there is no difference between the aerosol concentrations generated by professional and amateur performers while breathing, speaking, or singing, suggesting conclusions for professional singers may also apply to amateurs.
EDITOR:
Introduction
More than 3 million deaths worldwide are attributed to the coronavirus disease 2019 (COVID-19) pandemic (“WHO Coronavirus Disease (COVID-19) Dashboard | WHO Coronavirus Disease (COVID-19) Dashboard” Citationn.d.), which is caused by the severe acute respiratory syndrome coronavirus 2 (SARS-CoV-2) (Cevik et al. Citation2020). Unprecedented restrictions on all aspects of human culture were imposed to limit contagion spread and protect the global population. Near immediate limitations on live musical performance were imposed, precipitated in part by the appearance of clusters of COVID-19 associated with several choirs around the world (Charlotte Citation2020; Miller et al. Citation2020). A recent epidemiological study identified an outbreak where a chorister infected 12 church attendees seated >15 m away who had no close physical contact with the chorister, suggesting airborne transmission (Katelaris et al. Citation2021). Concerns about the risks associated with playing woodwind and brass instruments resulted in the imposition of similar restrictions.
Recent studies have demonstrated that the number of respirable particles emitted during singing and speaking has a strong volume dependence and that singing and speaking produce larger particles relative to breathing (Gregson et al. Citation2021; Alsved et al. Citation2020; Asadi et al. Citation2019). Moreover, modestly more particles are produced during singing relative to speaking at the same volume (Gregson et al. Citation2021). These studies provide basic information upon which the risk of singing can be estimated.
By contrast, similarly robust studies have not yet been performed to address aerosol generation from playing musical instruments. One study examined aerosol emitted from a vuvuzela (Lai et al. Citation2011). Another characterized aerosol emission from a range of instruments and grouped them into different risk categories (He et al. Citation2021). However, measurements of respiratory aerosol, including from wind instruments, must consider that the background particle concentration complicates the attribution of measured aerosol to that generated solely by respiratory activities and instrument playing. The aerosol background level may alter the emitted aerosol number concentrations and size distributions exhaled by the participant, as a large fraction of inhaled aerosol from the room would also be exhaled. Lastly, the instrument-specific conclusions in He et al. (Citation2021) were based on results from 1-2 performers, despite aerosol generated by specific respiratory activities, such as breathing, having an interparticipant variability of more than an order of magnitude (Gregson et al. Citation2021; Asadi et al. Citation2019). An online preprint suggests mitigation strategies to reduce exposure to aerosols produced by playing musical instruments (Stockman et al. Citation2021). Several preprints of manuscripts under review have explored air flows emanating from musical instruments to suggest appropriate distancing guidelines (Kähler and Hain Citation2021; Becher et al. Citation2020; Spahn et al. Citation2020).
We report measurements of aerosol emission from several musical instruments in an environment with zero number concentration aerosol background in the 0.5-20 µm diameter size range, a size range that may be significant for airborne transmission of SARS-CoV-2 in respiratory aerosol. This study provides crucial information about the number and size distributions of particles produced. Moreover, we qualitatively assess the production of large droplets (>20 µm diameter) during instrument playing in comparison to those produced by coughing and singing. Combined, this work enables a relative assessment of the possible risks associated with musical instrument playing compared with speaking and singing.
Materials and methods
The cohort of professional instrumentalists included 9 participants who played 13 different instruments (piccolo, flute, oboe, clarinet, bassoon, alto saxophone, trumpet, trombone, tuba). Aerosol (0.5-20 µm diameter) number concentrations and size distributions were measured during singing, speaking, breathing, and woodwind and brass instrument playing from this cohort in an environment with zero background particles in the 0.5-20 µm diameter size range following a standard operating procedure similar to that used in our previous work (Gregson et al. Citation2021). In addition, participants played onto water sensitive paper to assess qualitatively the risk associated with large droplets (>20 µm diameter). Four participants identified their voice-type as bass, 2 as tenor, 2 as alto, and 1 as soprano. Four participants played 2 instruments each, bringing the total number of instruments studied to 13: flute (3), piccolo (3), alto saxophone (1), clarinet (1), trombone (1), trumpet (1), oboe (1), bassoon (1), and tuba (1).
Aerosol measurements (0.5-20 µm diameter)
Aerosol concentrations were measured with an Aerodynamic Particle Sizer (APS, 0.5-20 µm diameter particles, model 3321, TSI Inc., 1 L·min−1 sample flow rate and 4 L·min−1 sheath flow rate) in a laminar flow operating theater, with each participant and researcher required to wear appropriate personal protective equipment (hospital scrubs, theater hat, and face mask if not the participant). The air handling system of the laminar flow theater (typically running at 31-36 air changes per hour) is such that the preexisting background aerosol number concentration within the APS size range is 0 cm−3, enabling the measurements described here. Consequently, aerosol detected by the APS during an activity can be confidently attributed to the participant, with aerosol concentrations returning to 0 cm−3 between periods of singing, speaking, breathing, and instrument playing. Temperature and relative humidity were typically 20 °C and 45%, respectively, in the operating theater.
A standard operating procedure (SOP) was adopted covering 12 activities. This SOP was based on that described in Gregson et al. (Citation2021). Each activity involved up to 5 repetitions of the same activity with a 20-30 s pause between each repetition to allow aerosol concentrations to return to background. Activities included breathing; speaking and singing the “Happy Birthday” song; and playing a single note with the musical instrument at different pitches and volumes. For breathing, speaking, and singing, participants stepped forward to the sampling funnel such that the dorsum of the nose was aligned to the plane of the base of the funnel. For instrument playing, participants positioned their instrument such that the end or bell was inside the funnel. A second sampling funnel was positioned in front of the participant’s mouth for the flute and piccolo instruments only to sample aerosol emitted from the mouth but not directed into the musical instrument.
The sampling setup was identical to that described in Gregson et al. (Citation2021) to allow comparative measurements between singing and woodwind and brass instrument playing. Aerosol was sampled with an APS. We had access to three APS instruments in this study. Comparisons across the three different APS instruments were linear. For Participant 10 (flute and piccolo), two APS instruments sampled the aerosol concentration from the funnel at the mouth and end of the instrument, respectively, which did not significantly alter the measured aerosol concentration. The volume of vocalization and instrument playing (measured in dBA) was recorded using a decibel meter (UNI-T, UT353) positioned ∼30-40 cm in front of the participant at eye level.
Aerosol was sampled through a funnel and 130 cm conductive ¼ inch silicon tubing (TSI Inc.). The funnels were 3 D printed from PLA (1.75 mm filament) by a RAISE3D Pro2 Printer (3DGBIRE). The funnel dimensions were 150 mm wide and 90 mm deep, with ports at the neck for sampling aerosol into the APS instruments. All tubing was 130 cm long. In a previous publication, we demonstrated that the transmission efficiency of aerosol sampled with this setup was very high (>99.8% by number, >86% by mass) for the size range most relevant to respiratory aerosol (<7 µm diameter) (Gregson et al. Citation2021). Therefore, transmission losses through the sampling setup are too small to affect the conclusions of this study. We note that the detection efficiency of the APS is known to decrease by a factor of 2-3 from 0.7 to 10 µm (Volckens and Peters Citation2005); however, this drop in detection efficiency is much smaller than the 3 orders of magnitude decrease in number concentration observed for respiratory aerosol from 1-5 µm diameter, with very few particles >5 µm detected and therefore contributing little to the total number concentration.
Speaking and singing
Similar to our previous study (Gregson et al. Citation2021), participants either spoke or sang the words of the “Happy Birthday” song to “Dear Susan” for 20 s at 70-80 dBA followed by 30 s of nose breathing and standing 2 m away from the funnel. This activity was repeated five times in total. Soprano singers sang in B flat major (starting note F4, top note F5), alto in G major (starting note D4, top note D5), tenor in B flat major (starting note F3, top note F4), and bass in F major (starting note C3, top note C4).
Breathing
Participants breathed for 10 s inhaling through the nose and exhaling through an open mouth in a non-forced “quiet” fashion, then stood 2 m away from the funnel for 30 s between each breathing experiment. This activity was repeated five times in total.
Playing a single note
Participants played a single note in the mid-range of their instrument for 20 s at mezzo forte volume followed by 30 s of nose breathing and standing 2 m away from the funnel. This activity was repeated three times in total. Two additional sets of single note measurements were conducted at high- and low-range at mezzo forte. The participants then repeated the full sequence at piano and forte. Participants were asked to play at the volume level they associate with the specified dynamic marking, recognizing that there would be variability in volume among the different instruments and performers for the same dynamic marking. Therefore, the volume associated with a specific dynamic was also recorded using the decibel meter. Comparison of the range of sound volume recorded by the decibel meter across the three dynamics indicated the range was smaller than for the singing experiments conducted in our previous study (Gregson et al. Citation2021). Including all instruments, the volume range accessed while going from piano to forte mainly spanned 70-90 dBA (see Figure S1), whereas the volume range accessed in the singing cohort spanned 50-100 dBA. Reported aerosol concentrations are the averages over the period particles were detected from the activity.
Droplet measurements (>20 µm diameter)
Participants played the “Happy Birthday” song at 70-80 dBA for 60 s with the mouth and/or end of the instrument positioned <10 cm away from a card of water sensitive paper (Pentair Hypro 32930AG, 26 × 76 mm cards). In our parallel study (Gregson et al. Citation2021), professional singers were asked to sing and cough onto water sensitive paper to assess large droplet generation during singing and coughing. When a liquid droplet impacts against this paper, a change in color from yellow to dark blue is visibly observed. These cards were photographed and stored.
Statistical analysis
Detailed statistical analysis is provided in the Appendix.
Human subjects
The Public Health England Research Ethics and Governance of Public Health Practice Group (PHE REGG) approved this study (PHE study number NR0221), and all research was performed in accordance with relevant guidelines and regulations of the Ethical Review Board. 9 healthy volunteers were recruited (5 male, 4 female), ranging in age from 34 to 63 years old (mean 54, SD +/- 8.4). All participants provided informed consent to the study and completed a prescreening questionnaire including age, gender, professional status, and COVID-19 symptom status to fulfill inclusion/exclusion criteria. Only participants who self-reported no COVID-19 symptoms were included in this study. Each participant’s weight, height, and peak flow rate were measured before the aerosol measurements.
Results and discussion
Measurements of aerosols 0.5-20 µm diameter
Respiratory aerosol concentrations generated by 9 professional instrumentalists were measured using an APS during breathing, speaking, singing, and woodwind and brass instrument playing. Altogether, the participants played 13 different instruments, allowing intra- and inter-instrument comparisons. Measurements were conducted in an environment with zero aerosol number concentration background (0.5-20 µm diameter), enabling confident attribution of the aerosol detected to the respiratory activity performed.
presents total particle number concentrations emitted by three participants who played both flute and piccolo (see also Table S1). We focus here on flute and piccolo because three individuals played the same instruments, allowing the best comparison across individuals. Number concentrations were measured near the mouth and at the end of the instrument while playing a mid-range note at forte. Near the mouth of both flute and piccolo, participant 8 (P8) produced the most particles, followed by participant 10 (P10) and participant 2 (P2). At the end of the flute, a similar trend is observed, although P8 and P10 produced a similar number of particles while playing piccolo. The general order of P8 > P10 > P2 while playing flute or piccolo is consistent with the relative number concentrations and, significantly, the range (almost an order of magnitude) emitted during breathing for these participants and differs from their relative speaking and singing emissions.
Figure 1. (a) Average particle number concentrations for three performers who each played flute and piccolo. (b) Aerosol size distributions measured at the end of their instrument for the full cohort of instrumentalists (13 instruments) playing a single note in the low range at forte and piano. These distributions are compared to those generated by breathing and singing at 70-80 dBA (34 professional singers and instrumentalists). Error bars are standard error of the mean.
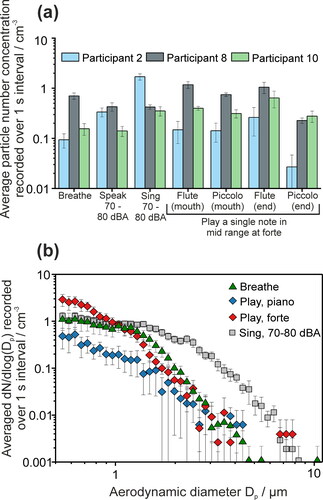
further supports the hypothesis that aerosol measured at the end of a musical instrument is consistent with that generated by the performer breathing, now considering all studied instruments. Average aerosol size distributions from the cohort of woodwind and brass performers (all 13 instruments) while playing at piano and forte are compared to size distributions measured from participants during breathing and singing (see Tables S2-S3). All musical instruments were grouped together, consistent with our conclusions from that trends among instruments will likely be subject to the large interparticipant variability in aerosol that the performer generates when breathing into the instrument. Whereas singing and speaking produce similar bimodal distributions, breathing is characterized by a prominent mode at smaller size centered near 0.57 µm (Gregson et al. Citation2021). Size distributions generated when playing an instrument at piano and forte are comparable to breathing and dissimilar to singing and speaking. ( provides a quantitative comparison of the instrument playing size distribution to breathing and singing.) Both the breathing and instrument playing size distributions lack the prominent mode associated with vocalization at larger particle size. Whereas the smaller mode is common across all respiratory activities and arises from aerosol generated in the lower respiratory tract, the mode near 1.1 µm arises from aerosol generated in the larynx and is largely associated with vocalization (Gregson et al. Citation2021; Johnson et al. Citation2011). The similarity in the size distributions, supported by the trends in emitted particle number concentrations among instrumentalists, suggests the aerosol measured from playing is consistent with emission from the performer’s breathing.
compares total particle number concentrations (, Table S4) and particle mass concentrations (, Table S5) generated by a range of activities. We compare a cohort of professional singers (left) (Gregson et al. Citation2021) with the full cohort of professional instrumentalists (right). In , the number concentrations of aerosol generated by breathing (p = 0.659), speaking (p = 0.115), and singing (p = 0.676) are consistent across both cohorts. The instrumentalists self-identified as amateur singers with no professional vocal training, suggesting conclusions about aerosol generation from professional singers are also applicable to amateurs, as there is no statistically significant difference between the aerosol concentrations generated by professional and amateur performers.
Figure 2. (a) Aerosol number concentrations and (b) aerosol mass concentrations for a range of activities performed by 25 professional singers (left) and 9 instrumentalists (13 instruments, right). Comparable activities across cohorts are identified by green (breathing), orange (speaking 70-80 dBA), and purple (singing 70-80 dBA) boxes. Within each box, the solid line represents the median and the square represents the geometric mean. The lower and upper ends of the boxes are the first and third quartile (the 25th and 75th percentiles). The upper whisker extends from to the largest value but no further than 1.5 × IQR (where IQR is the inter-quartile range, the distance between the 1st and 3rd quartiles). The lower whisker extends to the smallest value at most 1.5 × IQR. Data beyond the ends of the whiskers are “outlying points” and are indicated in red.
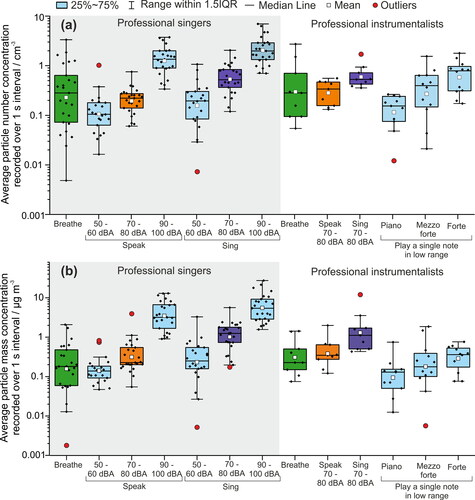
Moreover, a volume dependence is observed in the aerosol concentration generated for playing instruments (p = 0.0003), consistent with observations for speaking and singing (Gregson et al. Citation2021; Alsved et al. Citation2020; Asadi et al. Citation2019). The volume range piano to forte accessed by instrumentalists was mainly 80-100 dBA, a more constrained dynamic range than for singers (50-100 dBA, see Figure S1). Instrument playing at forte generates aerosol number concentrations of similar magnitude to those produced while singing at 70-80 dBA (p = 0.918). This observation is consistent with a recent report that clarinet playing produced a similar number of particles to singing at an unspecified volume for a single individual (Stockman et al. Citation2021). However, playing at forte generates aerosol number concentrations lower than those generated by the professional singers speaking and singing at high volumes (90-100 dBA; p = 0.018 and <0.001, respectively).
A comparison across activities in terms of aerosol mass concentration assumes the potential dose transmitted by an infected individual scales with particle size. The observations in terms of mass concentration () are largely consistent with those of number concentration (), except that breathing and instrument playing on a relative basis generate less mass than activities requiring vocalization, a consequence of the different size distributions generated by these activities. The relative masses of aerosol generated by breathing (p = 0.244), speaking (p = 0.539), and singing (p = 0.495), calculated from the size distribution and assuming unit density, are not significantly different between cohorts, consistent with the observations for number concentration. Aerosol mass generated by playing increases modestly with volume (p = 0.028), consistent with trends for speaking and singing. Further, playing at forte generates a comparable aerosol mass to breathing (p = 0.848) and speaking at 70-80 dB (p = 0.501) but a lower aerosol mass than that from singing at 70-80 dBA (p = 0.001). The laryngeal mode associated with vocalization preferentially increases aerosol mass because those particles are larger (Gregson et al. Citation2021).
(Table S6) shows the variability in number concentration across all instruments studied in the cohort at each volume level and across each instrument’s musical range (generally spanning 2 octaves). Number concentrations were measured at the end of each instrument. In , absolute number concentrations are provided, which show wide interparticipant variability in both breathing and instrument playing emissions. As demonstrated in , a volume dependence is clearly observed (see also Figure S1). In most (but not all) cases, participants who emitted more aerosol while breathing tended to emit consistently more aerosol out the end of their musical instrument. For instance, the trombone player and highest-emitting flute/piccolo player generally emitted more while breathing and while play their instruments. Quantitative comparisons are complicated by the small cohort size for any single instrument and, thus, we make no effort to provide a comparative assessment of the aerosol generation from different instruments.
Figure 3. (a) Absolute particle number concentrations measured for each participant’s breathing and each musical instrument investigated in this study. (b) Particle number concentrations normalized to each participant’s breathing aerosol number concentration to account for the substantial interparticipant variability associated with aerosol emission. Several activities spanning the musical range of the instrument and multiple dynamic levels were examined. Where no column is indicated for a particular instrument, the specific activity was not performed.
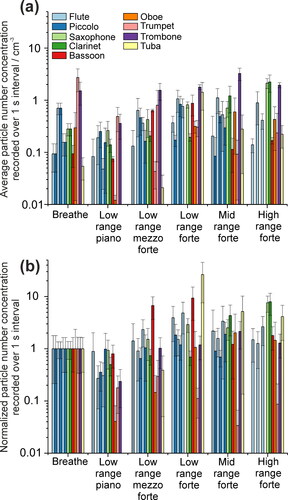
In , the number concentrations are normalized to each performer’s breathing aerosol number concentration to account for the significant interparticipant variability in aerosol emission. The key conclusion from is that no single instrument consistently emits significantly more or fewer particles than any other instrument. He et al. (Citation2021) classified tuba as low risk and oboe and trumpet as high risk instruments, but we do not observe this trend. In fact, emissions from the tuba span from near the lowest to the highest depending on the activity. We suggest the trend observed by He et al. (Citation2021) arises instead due to the substantial interparticipant variability in aerosol emission during breathing (as seen in ), which is the source of aerosol that is ultimately measured at the end of the instrument. However, further studies with larger cohorts playing the same instrument will better clarify the how a participant’s emissions affect aerosol emissions from playing a musical instrument.
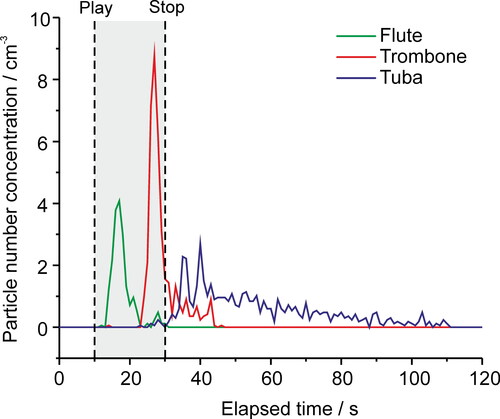
Substantial instrument-to-instrument variability with respect to detection time by the APS is observed. (Table S7) shows the time-dependent particle number concentration measured at the end of the instrument while the performer played a single note at forte in the low range. The start and stop times indicate the period during which the performer was playing. Particles were detected at the end of the flute shortly after playing began and no particles were detected after playing stopped. By contrast, particles were detected from the bell of the trombone ∼12 s after playing began and continued to be detected ∼20 s after playing ended. For tuba, very few particles were detected while the performer was playing. Instead, particles were gradually detected over a period of ∼80 s after the performer stopped playing. The relative trend is consistent with the length and complexity of the tubes that make up the instrument (He et al. Citation2021). This observation highlights that future studies of musical instruments should recognize that aerosol emission may not necessarily take place during the period of activity, as the transit time of air and particles is highly dependent on the musical instrument’s structure.
Figure 4. Time-dependent particle number concentrations measured by the APS for three instruments. For this activity, the performer played a single note in the low register of the instrument at forte for 20 s. The shaded region indicates the period during which the performer was playing the note. Note the zero background number concentration detected prior to aerosol sampling from playing and after aerosol sampling is complete.
Observations of droplets >20 µm diameter
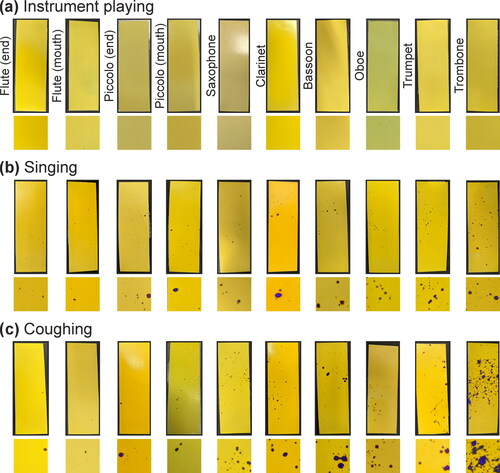
Any large droplets generated (20-1,000 µm) contain significant mass and could represent an important potential viral transmission risk. Large droplets emitted by coughing, speaking, and singing are generated in the oral cavity (Johnson et al. Citation2011; Morawska et al. Citation2009) and cannot be measured by the APS. To identify qualitatively whether large droplets are generated when playing instruments, water sensitive paper was held near the end of an instrument while a participant played. Any large droplets impacting on the water-sensitive paper induce an observable color change. compares images of water sensitive paper after playing a musical instrument over it () to after a participant sang or coughed on the paper (). Whereas large droplets are routinely produced during singing and coughing, no large droplets were detected from any musical instrument, further demonstrating that instrument playing generates less aerosol than activities involving vocalization.
Figure 5. Images of water sensitive paper following (a) instrument playing (measured at the bell or, where indicated, near the mouth) by the professional instrumentalists, and (b) singing and (c) coughing from a subset of the professional singers. Dark spots indicate the production of large droplets (>20 μm). The square below each image magnifies the region of highest droplet density.
Conclusions
Respirable and non-respirable aerosols generated by professional instrumentalists playing woodwind and brass instruments were investigated. Aerosol size distributions and concentrations correlate best with the sizes and concentrations generated by the participant while breathing, rather than while speaking and singing. Consequently, aerosol number and mass generated during instrument playing is of similar magnitude to that produced by breathing and is lower than that associated with singing and speaking at high volume. Moreover, large droplets (>20 µm diameter, measured using water-sensitive paper) were not observed during instrument playing but were observed during singing and coughing. Taken together, these observations suggest playing woodwind and brass instruments generate less aerosol than singing or speaking at high volume levels. The concentrations of aerosol emissions from this cohort during breathing, speaking, and singing are consistent with results from a larger cohort of professional singers (Gregson et al. Citation2021), suggesting aerosol generation during these activities is consistent across amateur and professionals regardless of vocal training. Limitations of this study are the small cohort size (9 participants playing 13 instruments) and individual performers for most instruments.
The conclusion that instrument playing generates less aerosol than singing or speaking may have important policy implications in the context of the pandemic, as many performing arts activities are severely restricted. Guidelines to reduce transmission of SARS-CoV-2 in the performing arts should consider not only the number and susceptibility of the participants (and audience), the duration and volume of the activity, and the size and ventilation of the performance venue, but also the lower aerosol concentrations associated with instrument playing relative to performances primarily involving speaking and singing at high volume.
Author contributions
NAW, CMO, PLS, JPR, and DC led the study design and securing funding. LPM, FKAG, JPR, and BRB collected the data. CMO, NAW, and PLS secured ethical approval. NAW, CMO, DC, and JC managed the registration and coordination of participant volunteers and secured access to the operating theaters. LPM, FKAG, and AEH analyzed the data. WJB undertook the statistical analysis. JPR, DC, JC, and BRB provided technical guidance and advice. LPM, CMO, NAW, FKAG, JPR, and BRB drafted the manuscript. All authors read and approved the final manuscript.
Competing interests
The authors declare no competing interests.
Supplemental Material
Download MS Word (467.5 KB)Acknowledgments
The authors acknowledge funding from the Engineering and Physical Sciences Research Council (EPSRC, EP/V050516/1). BRB acknowledges the Natural Environment Research Council (NE/P018459/1). LPM acknowledges funding from EPSRC (EP/S023593/1). Dyson, the Atmospheric Measurement and Observation Facility, and the Health and Safety Executive are acknowledged for APS loans. Fortius and Shoen Clinics are acknowledged for the provision of space to conduct the measurements. We acknowledge the performers for their participation in this study.
Data availability
All data recorded from individual participants contributing to the final analysis presented is included in the supplementary information (Tables S6 and S8).
References
- Alsved, M., A. Matamis, R. Bohlin, M. Richter, P. E. Bengtsson, C. J. Fraenkel, P. Medstrand, and J. Löndahl. 2020. Exhaled respiratory particles during singing and talking. Aerosol Sci. Technol. 54 (11):1245–8. doi:10.1080/02786826.2020.1812502.
- Asadi, S., A. S. Wexler, C. D. Cappa, S. Barreda, N. M. Bouvier, and W. D. Ristenpart. 2019. Aerosol emission and superemission during human speech increase with voice loudness. Sci. Reports 9 (1):1–10. doi:10.1038/s41598-019-38808-z.
- Becher, L., A. W. Gena, H. Alsaad, B. Richter, C. Spahn, and C. Voelker. 2020. The spread of breathing air from wind instruments and singers using schlieren techniques. Indoor Air. doi:10.1111/ina.12869.
- Cevik, M., C. G. G. Bamford, and A. Ho. 2020. COVID-19 pandemic-a focused review for clinicians. Clin. Microbiol. Infect. 26 (7):842–7. doi:10.1016/j.cmi.2020.04.023.
- Charlotte, N. 2020. High Rate of SARS-CoV-2 Transmission Due to Choir Practice in France at the Beginning of the COVID-19 Pandemic. J. Voice. doi:10.1016/j.jvoice.2020.11.029.
- Charlton, C.,. J. Rasbash, W. J. Browne, M. Healy, and B. Cameron. 2020. MLwiN Version 3.04.
- Gregson, F. K. A., N. A. Watson, C. M. Orton, A. E. Haddrell, L. P. McCarthy, T. J. R. Finnie, N. Gent, G. C. Donaldson, P. L. Shah, J. D. Calder, et al. 2021. Comparing aerosol concentrations and particle size distributions generated by singing, speaking and breathing. Aerosol Sci. Technol. 55 (6):681–91. doi:10.1080/02786826.2021.1883544.
- He, R., L. Gao, M. Trifonov, and J. Hong. 2021. Aerosol generation from different wind instruments. J. Aerosol Sci. 151:105669. doi:10.1016/j.jaerosci.2020.105669.
- Johnson, G. R., L. Morawska, Z. D. Ristovski, M. Hargreaves, K. Mengersen, C. Y. H. Chao, M. P. Wan, Y. Li, X. Xie, D. Katoshevski, et al. 2011. Modality of human expired aerosol size distributions. J. Aerosol Sci. 42 (12):839–51. doi:10.1016/j.jaerosci.2011.07.009.
- Kähler, C. J., and R. Hain. 2021. Singing in choirs and making music with wind instruments-Is that safe during the SARS-CoV-2 pandemic?. Accessed 19 April 2021. https://www.nyssma.org/wp-content/uploads/2020/06/Singing-in-choirs-and-making-music-with-wind-instruments.pdf.
- Katelaris, A. L., J. Wells, P. Clark, S. Norton, R. Rockett, A. Arnott, V. Sintchenko, S. Corbett, and S. K. Bag. 2021. Epidemiologic Evidence for Airborne Transmission of SARS-CoV-2 during Church Singing, Australia, 2020. Emerg. Infect. Dis. 27 (6):1677–80. doi:10.3201/eid2706.210465.
- Lai, K.-M., C. Bottomley, and R. McNerney. 2011. Propagation of Respiratory Aerosols by the Vuvuzela. PLoS One 6 (5):e20086. doi:10.1371/journal.pone.0020086.
- Miller, S. L., W. W. Nazaroff, J. L. Jimenez, A. Boerstra, G. Buonanno, S. J. Dancer, J. Kurnitski, L. C. Marr, L. Morawska, and C. Noakes. 2020. Transmission of SARS-CoV-2 by inhalation of respiratory aerosol in the Skagit Valley Chorale superspreading event. Indoor Air 31:314–23 doi:10.1111/ina.12751.
- Morawska, L., G. R. Johnson, Z. D. Ristovski, M. Hargreaves, K. Mengersen, S. Corbett, C. Y. H. Chao, Y. Li, and D. Katoshevski. 2009. Size distribution and sites of origin of droplets expelled from the human respiratory tract during expiratory activities. J. Aerosol Sci. 40 (3):256–69. doi:10.1016/j.jaerosci.2008.11.002.
- Spahn, C., A. Hipp, B. Schubert, M. R. Axt, M. Stratmann, C. Schmölder, and B. Richter. 2020. Airflow and air velocity measurements while playing wind instruments, with respect to risk assessment of a SARS-CoV-2 infection. Int. J. Env. Res. Pub. He. 18 (10):5413. doi:10.3390/ijerph18105413.
- Stockman, T., S. Zhu, A. Kumar, L. Wang, S. Patel, J. Weaver, M. Spede, D. Milton, J. Hertzberg, D. Toohey, et al. 2021. Measurements and Simulations of Aerosol Released while Singing and Playing Wind Instruments. https://scholar.colorado.edu/concern/parent/hq37vp75r/file_sets/9s161736t.
- Volckens, J., and T. M. Peters. 2005. Counting and particle transmission efficiency of the aerodynamic particle sizer. J. Aerosol Sci. 36 (12):1400–8. doi:10.1016/j.jaerosci.2005.03.009.
- WHO Coronavirus Disease (COVID-19) Dashboard. | WHO Coronavirus Disease (COVID-19) Dashboard (n.d.). (Accessed 15 January 2021). Available at https://covid19.who.int/.
Appendix:
Detailed statistical analysis
To compare breathing, speaking, and singing between the professional singers (n = 25) and instrumentalists (n = 9), histograms were inspected and the number and mass concentrations for all 3 activities were log transformed due to their skewed nature. Kolmogorov Smirnov tests were then used to assess normality. In the cases of number concentration for all 3 activities and for mass concentration both breathing and singing, normality could be assumed and so independent sample t-tests were performed. In all 5 cases, differences between cohorts in mean log number/mass concentration were not significant (number concentration: breathing – t32 = 0.446 (p = 0.659), speaking – t32=1.619 (p = 0.115), singing – t32=0.422 (p = 0.676); mass concentration: breathing – t32=1.186 (p = 0.244), singing – t32=0.690 (p = 0.495)). For speaking, the professional singers group was deemed not normally distributed so a non-parametric Mann Whitney test was performed. Again, the difference between professional singers and instrumentalists (amateur singers) in log mass concentration was non-significant (U = 96, p = 0.539).
To compare volume of playing across the 13 instruments (played by 9 instrumentalists), a Gaussian 2-level model in MLwiN v3.04 (Charlton et al. Citation2020) was fit to both the 35 log number concentrations and the 35 log mass concentrations each nested within 9 individuals, noting some instruments did not have measures for all 3 volumes (piano, mezzo forte, and forte).
The multilevel modeling was expanded to include the measures of singing, speaking, and breathing for the instrumentalists resulting in 62 observations nested within the 9 instrumentalists. For number concentration, a likelihood ratio test was carried out and found an overall significant effect of action (χ2(5) = 24.261, p < 0.001). Using breathing as a reference category, the coefficients for the other actions were as follows: singing 0.690 (SE 0.359), speaking −0.056 (0.359), playing forte 0.655 (0.338), playing mezzo forte − 0.118 (0.337), playing piano − 0.902 (0.346). Pairwise comparisons show that singing produces a significantly higher log number concentration than playing at piano and mezzo forte but not forte, whereas speaking produces significantly higher log number concentration when compared to playing at piano (p = 0.014) but significantly lower log number concentration than playing at forte (p = 0.035). A similar relationship is observed for breathing with only a significantly higher log number concentration observed when compared to playing at piano (p = 0.009) with a lower but not significantly lower log number concentration than playing at forte (p = 0.052).
To compare log number concentrations for playing at forte with singing/speaking at louder volumes (90-100 dBA) data from the professional singers was used for singing and speaking and the playing at forte data was aggregated up to the instrumentalist level. Independent sample t tests showed significantly lower log number concentrations for playing at forte relative to speaking and singing at high volume (t32=2.496 (p = 0.018) for speaking, t32=4.475 (p < 0.001) for singing).
For log mass concentration, a likelihood ratio test was carried out and found a significant effect of volume (χ2(2) = 7.116, p = 0.028). With piano as a reference category, the coefficients for playing at mezzo forte were 0.703 (SE 0.407) and forte 1.209 (SE 0.410) and show an upward trend with volume. Similar to log number concentration, a likelihood ratio test was carried out and found a significant effect of volume (χ2(2) = 16.223, p < 0.001). With piano as a reference category, the coefficient for playing at mezzo forte was 0.781 (SE 0.323) and at forte 1.586 (SE 0.325), showing an upward trend with volume and demonstrating the volume dependence.
For log mass concentration, a likelihood ratio test was carried out and found an overall significant effect of action (χ2(5) = 27.866, p < 0.001). Using breathing as a reference category, the coefficients for the other actions were as follows: singing 1.436 (0.477), speaking 0.215 (0.477), playing forte − 0.086 (0.447), playing mezzo forte − 0.545 (0.447), playing piano − 1.197 (0.456). Pairwise comparisons show that singing produces a significantly higher log mass concentration than playing at all 3 levels (p = 0.001 for forte) whereas speaking only produces significantly higher log mass concentration when compared to playing at piano (p = 0.002 for piano but p = 0.089 for mezzo forte and p = 0.501 for forte) and a similar relationship is observed for breathing with only a significantly higher log mass concentration observed when compared to playing at piano (p = 0.009 for piano but p = 0.222 for mezzo forte and p = 0.848 for forte).