
 ?Mathematical formulae have been encoded as MathML and are displayed in this HTML version using MathJax in order to improve their display. Uncheck the box to turn MathJax off. This feature requires Javascript. Click on a formula to zoom.
Abstract
Central Nervous System (CNS) disorders are one of the major causes of fatalities in the world today. Thus, it is essential to transport a considerable amount of drugs to a specific brain location for any treatment to be effective. A noninvasive approach is direct nanodrug delivery via the nasal route. The main pathway for these drugs into the brain requires crossing the Blood-Brain Barrier (BBB), located along the olfactory region of the nasal cavity. Tight junctions of the BBB allow only nanoparticles of sufficiently high concentrations to pass through. Multifunctional nanoparticles can be used to target the brain via the olfactory bulb. Computational Fluid-Particle Dynamics (CF-PD) simulations offer a manageable, accurate and cost-effective route for studying this possibility. For the present study, the open-source CFD toolbox OpenFOAM was employed to conduct all fluid-particle dynamics simulations. Previous studies have shown that normal injection of particles through the nostrils have shown clinically insignificant amounts of olfactory deposition. The main objective of this study is to utilize the Particle Release Map (PRM) methodology to optimize the nanodrug deposition efficiency inside the olfactory region, using a representative human nasal cavity as a test bed. While published results indicate maximum olfactory depositions of 3 to 4% (for 1 nm particles) under normal breathing rate, the PRM approach achieves 28.4% deposition for 10 nm and 8.7% for 100 nm particles in the olfactory bulb. Practically, such elevated olfactory depositions with the PRM technique could be achieved in conjunction with a well-placed nasal cannula.
Copyright © 2021 American Association for Aerosol Research
EDITOR:
1. Introduction
Brain tumors as well as Central Nervous System (CNS) disorders (Alzheimer’s, Parkinson’s, Multiple Sclerosis, etc.) are major causes of fatalities in the world today. Malignant brain tumors have a survival prognosis of less than 15 months (Lalatsa et al. Citation2018) despite the progress that has been made. The most common brain cancer accounts for 80% of all the malignant tumors (Dolecek et al. Citation2012). According to the Parkinson’s Prevalence Project, nearly 1 million American’s over the age of 45 will be diagnosed with Parkinson’s by 2020 and this number is expected to increase to 1.24 million by 2030. Alzheimer’s disease, according to the Alzheimer Association Report (Citation2017), affects nearly 5.5 million people and is the 6th leading cause of death in the USA. These statistics clearly underline the gravity of the situation. Not surprising, considerable efforts have been put into the treatment of these ailments, where effective transport of nanodrugs to the brain is one possibility.
The Blood Brain Barrier (BBB) located above the olfactory bulb (), a highly selective semipermeable membrane, protects the fragile nature of the brain and separates the olfactory region of the nasal cavity from the brain. The presence of tight junctions between the adjacent endothelial cells () allow only very small compounds to pass through (Azad et al. Citation2015; Burgess and Hynynen Citation2013). Furthermore, the cerebral endothelial cells show a considerably less pinocytic activity than the systemic endothelium (Lesniak and Brem Citation2004). Pinocytic activity results in the transportation of substances across an epithelium by material-uptake on one face of a coated vesicle that can then be transported from the opposite face. Clearly, the reduction in the pinocytic activity further limits the drug transportation across the BBB. The blood cerebrospinal fluid barrier (BCSFB) forms the second layer that restricts the movement of drugs. This layer is located at the choroid plexus and separates the blood and the cerebrospinal fluid. However, this layer is slightly more permeable than the BBB. The BBB surface area (120 sq ft) is roughly 5000 times the area of the BCSFB (Pajouhesh and Lenz Citation2005). Hence, BBB layer is the dominant obstacle for the delivery of drugs to the brain. These membranes are there to inhibit the passage of pathogens, antibodies, toxins etc. to the brain. In doing so they also restrict the transport of therapeutic drugs in to the brain. In summary, drug delivery to the brain is difficult to achieve at high enough efficiencies to counteract the toxins that are the root to the various CNS disorders (Agrawal et al. Citation2018).
Figure 1. Human nasal cavity with the olfactory bulb (Patrick J. Lynch, medical illustrator (labeled by was_a_bee). Head olfactory nerve – olfactory bulb en, CC BY 2.5).
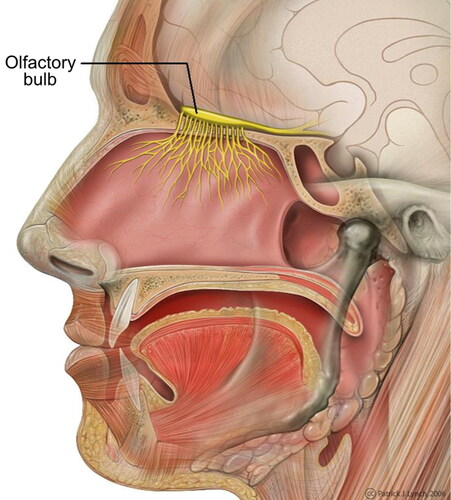
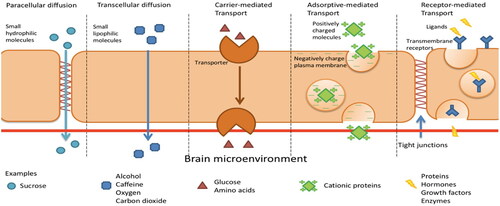
Figure 2. Transport across the blood brain barrier (Wong et al. Citation2019).
Previous studies on nasal deposition of inhaled nanoparticles include in vivo experiments in healthy volunteers (K. Cheng, Cheng, et al. Citation1996; Y. S. Cheng, Cheng, et al. Citation1996) and in vitro experiments in nasal replica casts based on cadavers or imaging of live subjects (Y. S. Cheng, Cheng, et al. Citation1996; Y. Cheng et al. Citation1995). As mentioned, the olfactory region serves as a promising path for nanodrugs to reach the brain via translocation along the nerve cells into the brain (Hopkins et al. Citation2014; Oberdörster et al. Citation2004). However, due to the complex structure of the nasal cavity, only a minuscule amount reaches the olfactory region naturally. In vivo studies offer the most realistic picture of the fluid-particle dynamics inside the nasal cavity; but, human trials are difficult to get approved owing to the delicacy of the targeted organ. Alternatively, Computational Fluid Dynamics (CFD) studies allow us to overcome this problem. CFD studies enable us to conduct computer simulations to predict nanoparticle trajectories and the effect of the airflow for realistic inhalation conditions. Once, a relatively high degree of confidence in the simulation accuracy is achieved and administering the drug is deemed safe and effective, in vivo studies in humans can be performed. Hence, it is essential to accurately model the interplay between airflow and particle dynamics. The flow inside the nasal cavity is marked by unsteady and weakly turbulent flow as well as asymmetric congestion and decongestion of the left and right chambers (Inthavong et al. Citation2019). This flow along with the particle physio-chemical characteristics govern the trajectory of drug particles and subsequently the effectiveness of the drug delivery mechanism.
Historically micron particles have been studied for drug delivery due to the ability of nasal delivery devices (e.g., nebulizers) to generate these micron-size droplets. Various CFD studies involved simulating the airflow and micron-size particle deposition inside a representative human nasal cavity model. Wang et al. (Citation2009) studied the influence of flowrate and the particle diameter on the deposition patterns for both micron and submicron sized particles. The results showed that micron deposition is dependent on the inertial parameter and Stokes number while deposition efficiency for nanoparticles is diffusion dominant. When it comes to nasal deposition patterns, subject variability is an important topic. Nasal geometries are different for different people and hence a study is required to establish a relationship between the particle deposition efficiencies and the geometrical parameters. Calmet et al. (Citation2018b) used three different nasal geometries to study the effect of the different anatomical structures on deposition efficiencies. However, local deposition did not follow such a trend, as only one of the subject geometries observed particle deposition in the olfactory region.
One of the earliest CFD studies using a representative human nasal cavity model regarding nanoparticle deposition in the olfactory region was performed by Shi, Kleinstreuer, and Zhang (Citation2006). They treated airflow as laminar and incompressible while modeling nanoparticles as an Eulerian phase. Their simulations showed that for normal breathing rate and a nanoparticle diameter of 1 nm, the olfactory deposition efficiency is about 0.5% while the total deposition efficiency is about 75%. Tian et al. (Citation2017) conducted a numerical study for a human nasal cavity where the maximum olfactory deposition was 3.5% for nanoparticles of diameter of 1.5 nm. They also did a comparison between the deposition fractions between the rat and human nasal cavities (L. Tian et al. Citation2019). The study concluded that the major factors affecting the nasal and olfactory nanoparticle depositions are particle diffusivity and the breathing airflow rate. As a consequence they also developed certain correlations for olfactory and total nasal deposition efficiencies. Another outcome of the study was that the olfactory deposition of nanoparticles in both rats and humans is extremely low (<3.5% and 8.1%, respectively) due to the geometric and hence flow features of the nasal cavities. They concluded that the maximum olfactory deposition of the nanoparticles was around 1% for 1–2 nm particles.
The aforementioned studies involve steady-state simulations to have a qualitative and quantitative relationship between the particle dynamics and the fluid flow. However, for real life applications (inhalers, nebulizers, etc.) transient studies have to be done to accurately simulate the inhalation phenomena while using these devices. Particle deposition in transient studies are highly sensitive to the number of particles, injection timing and the position of the injection. Unlike the steady-state simulations, transient CFD simulations are considerably time consuming due to stability considerations. Shi, Kleinstreuer, and Zhang (Citation2006) conducted one of the first transient studies comparing deposition patterns for steady and transient flows Nanoparticles were treated as an Eulerian phase and the normal transient breathing profile was modeled using a modified sine-function, divided into an acceleration and a deceleration phase. The differences between particle transport in the accelerating and decelerating phase as well as the steady-state simulation are due to the “kinematic particle accumulation effect.” The decelerating phase generates a higher deposition efficiency while the accelerating phase results in the least. In addition to that a matching steady-state inhalation profile was determined that resulted in the same total deposition and to a certain degree the same sectional deposition that the transient breathing profile generated. Again, the maximum olfactory deposition efficiency observed was around 0.5%. A similar study of micro-particles was done by Bahmanzadeh, Abouali, and Ahmadi (Citation2016). They observed that the steady flow analysis over-predicted the cyclic flow analysis by relative errors in the range of 10–60%. Apart from the normal cyclic inspiratory flow, other breathing profiles have also been analyzed. indicating that transient flow results are highly dependent on particle size, flowrate waveform, and breathing frequency. These factors can be combined to form the Strouhal number (Str = where f is the flow-field frequency; L is the representtive length of the nasal cavity; and U is the average velocity during one cycle
A similar sniffing study for micron-sized particles was performed by Calmet et al. (Citation2018a). The sniffing profile was dived into three phases; namely acceleration, plateau and deceleration. The study provided a detailed regional deposition pattern from the nostril to third generation of the airways. An interesting result of this study is that olfactory deposition efficiency of 2.7% was observed for 10 µm particle size.
There have been various administration strategies employed to target the olfactory system. Targeting of micron particles using nasal spray pumps was studied to determine the effect of various parameters like particle size, spray plume angle and injection angle on the deposition patterns (Y. S. Cheng et al. Citation2001). The study found that the injection angle of 60° or 75° is most favorable for deposition in the olfactory region. A more invasive strategy investigated involved placing the nasal spray nozzle inside the nasal passage and releasing particles into the olfactory region (J. Wang, Bentz, and Anderson Citation2007). However, this strategy is prone to damaging wall tissues. Another method utilizes high pressure to confine the drug deposition into the olfactory region by using a nasal pump (Gizurarson Citation2003). A similar design called the Pressurized Olfactory Delivery (POD) device uses swirling flow dynamics to increase deposition of particles in the olfactory region (Hoekman and Ho Citation2011). This device has shown success in olfactory region deposition in rats.
Another strategy involves using electric (Bailey Citation1997; Wilson Citation1947; J. Wong, Chan, and Kwok Citation2013; Xi and Si Citation2017) or magnetic forces (Dames et al. Citation2007; Dames et al. Citation2007; Martin and Finlay Citation2008) to control the trajectories of particles for targeted drug delivery. The study conducted by Si and Xi (Citation2016) presented a study that used a combination of selective drug release position and magnetophoretic guidance for olfactory drug delivery. A row of magnets is positioned on the top of the nasal cavity to facilitate the movement of ferromagnetic micron particles into the olfactory region. <10 µm, magnetic forces do not cause an appreciable change in the trajectory of the particles and >18 µm particles deposit in the anterior region. The highest olfactory deposition efficiency of ∼45% was observed for 15 µm particles. However this strategy is highly patient specific and particle guidance using magnetic forces remains extremely challenging.
As an alternative to drug particle size change or using different forces, exhalation delivery systems (EDS) have also been employed for olfactory drug targeting. Djupesland et al. (Citation2004) developed an bi-directional nasal delivery system. that results more deposition in the upper parts of the body. This system has been implemented in the form of an EDS device (Djupesland Citation2013). It consists of a mouthpiece to which person exhales and this air goes to the connected nosepiece which is inserted into one of the nostrils. During exhalation, the soft palate closes off the nasal cavity from the oral cavity due to positive air pressure. As a result, the air and drug particles from the nostril travels through the nasal cavity behind the septum and exits from the other nostril. This creates more airflow within the upper parts of the nasal cavity. Ofactory drug targeting of microparticles through this bi-directional airflow system was numerically investigated by Yarragudi et al. (Citation2020). They found that for a bi-directional flowrate of 6 lpm, a peak olfactory deposition of ∼16% was observed for a particle size of 17 µm as opposed to ∼9% for 10 µm under uni-directional flow. Although a high deposition is observed, the size of the particle poses a hindrance for travel through the BBB and hence after reaching the nasal mucosa, the drug delivery can only take place through the process of diffusion.
An interesting study conducted by Si et al. (Citation2013) conducted numerical simulations to measure the olfactory deposition inside a human nasal cavity model. In this study, drug delivery was done via pointed administration from the front vestibule, back vestibule and deep intubation at selective positions. The front vestibule injection showed approximately twice the amount of deposition in the olfactory region than the back vestibule injection. Furthermore, the performance of intranasal deep intubation was compared with that of conventional inhalers. The aerosols considered in this study were treated as solid spheres. For 150 nm aerosols, this strategy showed 12.6 times more and for 1 µm aerosols, 38.5 times more olfactory deposition than the conventional inhaler mechanism. For the transport of the particles, a continuous phase-drift model accounting for the effects of particle inertia and diffusion (Longest and Oldham Citation2008; Xi and Longest Citation2008). However, the deciding factor for the pointed administration injection positions was not specified.
Thus, it should be beneficial to utilize the Particle Release Map (PRM) approach to decide the optimal injection point that results in maximum olfactory deposition efficiency (Childress and Kleinstreuer Citation2014; Xu and Kleinstreuer Citation2018). The PRM technique involves injecting particles uniformly at the nostrils’ inlet plane and studying the regional deposition inside the nasal cavity. The deposited particles are backtracked to their injection positions and marked. This methodology provides the particle-release position that transports the particles to predetermined location, e.g., the olfactory region.
The outline of the article is as follows: Section 2 presents the basic theory including the geometry, mesh and the governing equations. Section 3 explains the methodology behind constructing the Particle Release Map (PRM). Normal injection constitutes randomly injecting drug particles across the nostril plane. A specific injection location from the PRM in the nostril plane may achieve maximum olfactory deposition. Section 4 discusses the olfactory deposition efficiency comparison between normal injection and targeted injection (using the PRM). Finally, Section 5 concludes the results of the targeted injection and introduces future work.
2. Theory
2.1. Nasal geometry and mesh
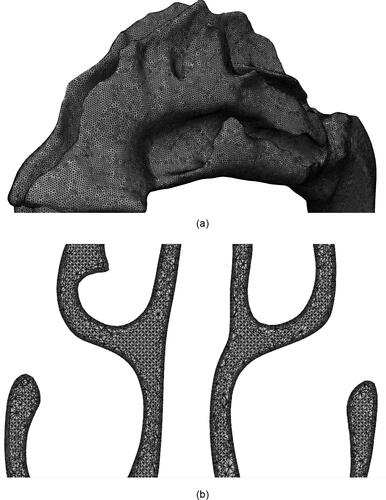
The nasal geometry used in this study is shown in . The geometry was constructed using the MRI scans of a healthy 53 year old, nonsmoking male provided by CIIT (Research Triangle Park, NC, USA). As evident from the figure, the geometry has asymmetrical right and left channels. The anterior section of the geometry (known as the vestibule) trifurcates into superior, middle and inferior meatuses and subsequently converge it into the Nasopharynx. The surface area and volume of the geometry is 0.0228 mm2 and 3.2298e-5 mm3, respectively. A salient aspect of a CFD simulation is the mesh used as it determines the numerical stability and accuracy of the solution. For this study, the unstructured mesh of Subject A discussed in Calmet et al. (Citation2018b) was utilized (). Owing to the complex structure of the nasal cavity, the mesh is composed of approximately 4 million elements. The core of the geometry is discretized by tetrahedral elements and the periphery with prism elements. The smooth transition from the core to the periphery is ensured by pyramidal elements. Successive smoothing iterations have been performed to achieve sufficient quality. As a result, the minimum edge length of the mesh is ∼3e-6 m, at the walls. This corresponds to a y+ value of 1.37, thus adept at resolving the near wall dynamics of flow (Piomelli and Balaras Citation2002). The maximum skewness and aspect ratio of the mesh is 2.5362 and 28.7123, respectively. These unusually high values are a consequence of the nonuniform and twisting nature of the geometry surface. Further details of the geometry and the mesh can be found in Vachhani and Kleinstreuer (Citation2021).
Figure 3. Nasal cavity geometry.
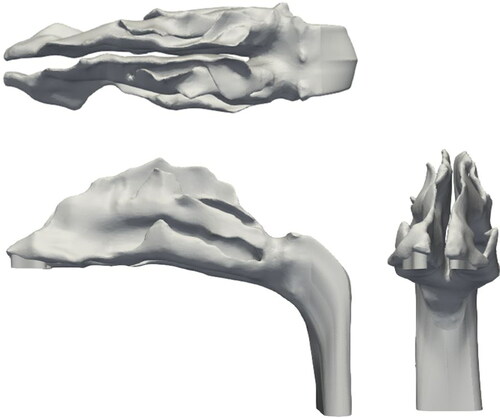
Figure 4. Zoomed in figures of the (a) nasal cavity mesh and (b) mesh slice of a plane of the nasal cavity.
2.2. Governing equations
To simplify the study, certain assumptions have been undertaken.
The airflow in the nasal cavity is assumed to be steady state.
The air inside the nasal cavity was taken to be an incompressible fluid.
The simulations have been performed under isothermal conditions.
Due to the complexity of the nasal cavity, local turbulence effects are to be expected. To account for the turbulence effects, the Reynolds Averaged Navier-Stokes Equations (RANS) (EquationEquations (1)(1)
(1) and Equation(2)
(2)
(2) ) are used. The flowrates used in this study lies in the transitional regime and hence the turbulent kinetic energy has to be resolved to solve the RANS equations. The Reynolds stress appears in the equation as the
term (EquationEquation (3)
(3)
(3) ). These terms are based on the Boussinesq hypothesis (1877). To model the turbulence numerically, the k-ω SST (Shear Stress Transport) model (Menter Citation1993) is used. It combines the capabilities of k-ω and k-ε models. The flow between the wall and the viscous sublayer is modeled using the k-ω model and switches into the k-ε model for the freestream conditions because k-ω model is sensitive to inlet boundary conditions. This model has been shown to capture the transitional regime and eddy viscosity effects with reasonable accuracy (Kleinstreuer and Zhang Citation2003).
(1)
(1)
(2)
(2)
(3)
(3)
(4)
(4)
Here, and
is the pressure and density of the fluid, respectively;
represents the turbulent viscosity. The velocity of the flow (
) is divided into the mean component (
) and the fluctuating component (
) (EquationEquation (4)
(4)
(4) ).
The simulations have been performed in the open-source CFD toolbox called OpenFOAM (Open Field Operation and Manipulation). The steady-state flow field has been obtained using the simpleFoam solver which uses the SIMPLE (Semi-Implicit Method for Pressure Linked Equations).
The steady-state flow field from simpleFoamwas used for Lagrangian particle tracking. To simplify the process, the following assumptions have been made:
The particles concentration is small so as to not affect the flow field, i.e., one-way coupling.
The effect of particle rotation is not taken into consideration.
Since the concentration of particles is small, the particles do not interact with each other.
To model lagrangian particle tracking in homogenous turbulence flow, Langevin equation (Obukhov Citation1959) has been prominently used. To incorporate the inhomogeneity of the turbulent flow in wall bounded flows (like nasal cavity flow employed in the current study), a novel approach has been suggested by Dehbi (Citation2008). In this approach, an additional drift velocity correction is employed to the Langevin equation by using instantaneous velocity data from Direct Numerical Simulation (DNS) databases. This effect of inhomogenous turbulent flow has not been taken into consideration in the present study. This is because the present study deals with nanoparticle transport where Brownian dispersion force is more dominant than turbulent dispersion force.
This study involves the Lagrangian tracking (EquationEquation (5)(5)
(5) ) of nanoparticles using the icoUncoupledKinematic ParcelFoam solver. These particles show different physical behavior than micron particles and hence different force formulations than micron particles. The forces for nanoparticles are shown in the (EquationEquation (6)
(6)
(6) ).
(5)
(5)
(6)
(6)
Here represents the Cunningham drag force (Cunningham Citation1910);
is the Brownian force (Inthavong et al. Citation2010);
is the Saffman lift force (Saffman Citation1965). The time marching in EquationEquation (5)
(5)
(5) is done using the first order Euler scheme. It is noteworthy to mention that the Brownian force is dependent on the time step used for the simulation. The time step used is 1e-4 s which was used for validation of the current model with previous analytical (Ingham Citation1975) and numerical studies (L. Tian et al. Citation2019). These validations of the current OpenFOAM setup along with the detailed force formulations in EquationEquation (6)
(6)
(6) are presented in Vachhani and Kleinstreuer (Citation2021). These validations establish the credibility of our approach and the current study is an extension of the aforementioned study.
3. Methodology
In this study, Particle Release Maps (PRMs) are generated for nanoparticles under flowrates of 5, 10, 15, and 20 lpm.
OpenFOAM generates an extensive data file showing the particle positions, their ID’s, deposited particles, etc. The PRM is constructed via the following steps:
Conducted a simpleFoam simulation to get a steady state flow field for a particular flowrate.
Using the flow field, conducted a CF-PD simulation using icoUncoupledKinematicParcelFoam for lagrangian tracking of individual particles and measuring the regional and total deposition efficiency. In this simulation the particles are uniformly distributed throughout the nostrils and all of them are released initially all at once.
Tracked all of these particles until all of them have either deposited or escaped.
The initial and final position of the particles are then compared using the particle ID to determine which particles are deposited in a specific region in the nasal cavity. This was done using a Matlab script.
Marking each specific region deposited particles with a separate marker on the initial injection position file gives the full-fledged particle release map.
To construct a particle release map, it is essential to identify regions of the nasal cavity that are highly susceptible for inflammation due to nasal cavity infections. Based on studies in literature, the following regions have been chosen for this purpose:
Nasal Vestibule: – Nasal vestibulitis is an infection local to the vestibule region characterized by excessive swelling and redness (Lipschitz et al. Citation2017).
Inferior Meatus: – Sarcoidosis is a disease characterized by nasal obstruction due to the abnormal enlargement of the inferior turbinates (Helliwell Citation2010).
Middle Meatus: – Nasal polyposis is a condition marked by non-cancerous growths beneath the middle turbinate (Dowley and Homer Citation2001; Kayarkar, Clifton, and Woolford Citation2002). In many cases these are associated with inflammation of the inner lining of the nasal cavity caused by bacteria. This is called Chronic Rhinosinutises (Stevens, Schleimer, and Kern Citation2016).
Olfactory Region: – As elucidated in Section 1, the olfactory region serves as a promising drug delivery route to the brain and is the major focus for the present study.
Nasopharynx: – Nasopharyngeal Carcinoma is a cancer of the nasopharynx region. Drug delivery using nanoparticles has been shown to be a highly effective treatment option (Lan et al. Citation2013; Y. Wang et al. Citation2018; Yang et al. Citation2017; You et al. Citation2017).
The purpose of the PRM is to determine the optimal injection position for maximum local or regional deposition in a target location. Once the PRM is constructed, a separate simulation is conducted by injecting similar amount of particles from the position on the PRM that is suitable for olfactory drug targeting. For this the injection is done via a circular orifice of diameter 0.25 mm. The orifice diameter choice is of the same order as previous studies in literature (Inthavong et al. Citation2012; Kapadia, Grullo, and Tarabichi Citation2019). This is done so as to establish the effectiveness of the PRM approach. For each flowrate, four sizes of nanoparticles (1, 10,100 and 500 nm) were considered. shows the nasal geometry with the different parts highlighted in specific color. These are the regions that will be represented by the particle release map. represents the legend correlating the highlighted colors with the specific regions.
Figure 5. Nasal geometry with the specific regions that will be represented in the Particle Release Map.
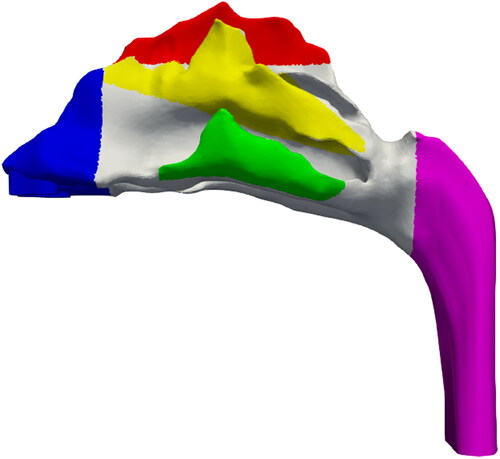
Table 1. Legend correlating the color to the specific region.
4. Results and discussion
This section is concerned with nanoparticles for targeted drug delivery to the olfactory region. The olfactory deposition efficiency (ODE) is defined as follows:
(7)
(7)
It is understood that unlike micron particles, nanoparticles do not generally cross streamlines due to inertia. The particle dynamics is governed by random Brownian forces. The PRM’s are generated via normal injection, i.e., Randomly injecting the particles throughout the nostril plane (). It is also noteworthy to mention that the simulation was stopped once all the particles had either escaped or deposited. For the flowrate of 20 lpm, the average completion time for the PRM simulations was 45,307 s.
Figure 6. Initial injection position of particles, i.e., Normal injection.
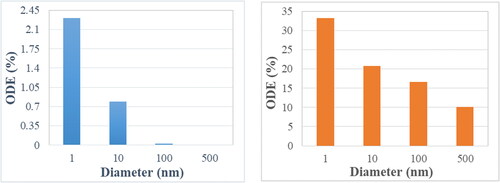
show the particle release map of 1, 10,100, and 500 nm particles, respectively, for a flowrate of 5 lpm. The colors in the particle release map relate to the deposition location as described in . It is noteworthy to mention that the white space in the particle release map indicates the initial injection locations of escaped particles. As mentioned earlier, the focus of this study is to target the olfactory region. Hence the region of importance is the red region in the PRM’s. Once these regions are identified, particles are injected from these locations via a circular injection (shown by the black circle) for targeting purposes. show the olfactory deposition efficiency (ODE) of nanoparticles under the flowrate of 5 lpm for normal and targeted injection, respectively. The difference in deposition between the two approaches is significant. While the maximum ODE of 1 nm particles for normal injection is ∼2.25%, it rises above 30% for targeted injection.
Figure 7. PRM of (a)1 nm, (b) 10 nm, (c) 100 nm, and (d) 500 nm particles for the flowrate of 5 lpm.
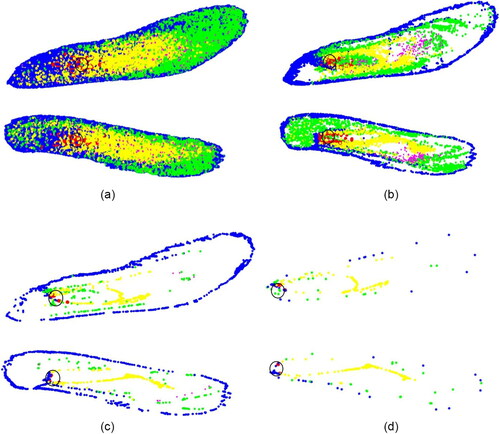
Figure 8. ODE using (a) normal injection and (b) targeted injection for the flowrate of 5 lpm.
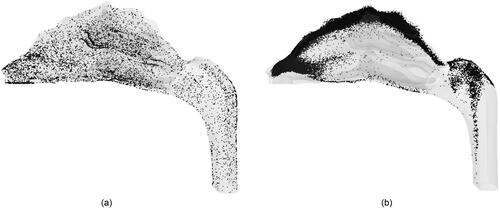
Although this improvement is promising, generating such smaller particles is extremely difficult and hence not suitable for practical implementation. The targeting injection however significantly increases the ODE for all the nanoparticle sizes in this study. The potency of the targeted injection is evident from the . While normal injection () results in a homogenous distribution of deposited particles, targeted injection () delivers most of the particles to the upper region of the nasal cavity, including the olfactory region.
Figure 9. Deposition pattern of 10 nm particles for a flowrate of 5 lpm due to (a) normal injection and (b) targeted injection.
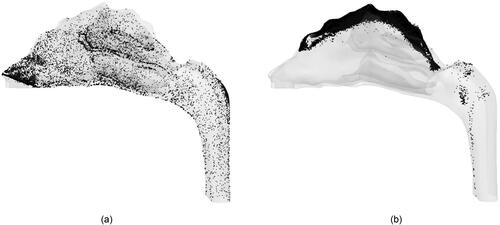
show the similar PRM analysis for the flowrate of 20 lpm and show the ODE comparison between normal and targeted methodologies. As expected, for small sized nanoparticles, targeted injection substantially increases the ODE with the maximum jump from ∼3.5 to 50%. The effect of targeted injection decreases with the increase in particle size. This is because for very small nanoparticles there is a well-defined region for olfactory deposition in the particle release map, whereas for 100 nm particles there are only distinct points on the particle release map corresponding to olfactory region. The deposition pattern of 10 nm particles for a 20 lpm flowrate due to normal and targeted injection is shown in , respectively. It shows that the targeted injection greatly changes the deposition pattern inside the nasal geometry. Normal injection results in a uniformly spread deposition pattern, while the targeted injection concentrates the particles in the upper region of the nasal cavity closer to the olfactory region. The phenomenon of targeted injection works on low sized nanoparticles due to the property of nanoparticles to follow the streamlines. Furthermore, higher flowrate generates higher olfactory deposition efficiency.
Figure 10. PRM of (a)1 nm, (b) 10 nm, (c) 100 nm, and (d) 500 nm particles for the flowrate of 20 lpm.
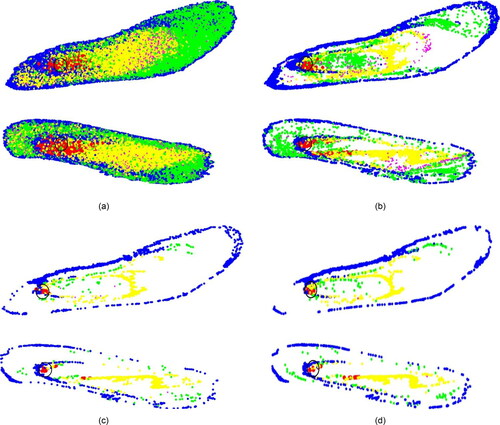
Figure 11. ODE using (a) normal injection and (b) targeted injection for the flowrate of 20 lpm.
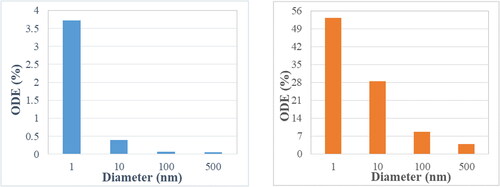
Figure 12. Deposition pattern of 10 nm particles for a flowrate of 20 lpm due to (a) normal injection and (b) targeted injection.
The comparison between normal and targeted injection in this study () highlight the effectiveness of the PRM approach in transporting the drug particles into the olfactory region. The effectiveness decreases as the particle size increases. It is also noteworthy to mention that due to the PRM approach, the olfactory deposition of 100 nm particles using targeted injection is of the same order of 1 nm deposition due to normal injection. It should be mentioned that the targeted injection deposition values do not follow a particular trend as it is highly dependent on the injection position. The success of this method also generates the possibility of using it not only on the nostrils but also for injection position to be further inside the nasal cavity to transport more particles into the olfactory region. This can be done by using the PRM approach in conjunction with a nasal cannula. A nebulizer capable of generating nanoparticles is connected to a nasal cannula where the outlet position is decided by the particle release map to target the olfactory bulb.
Table 2. Comparison of olfactory deposition efficiency between normal and targeted injection.
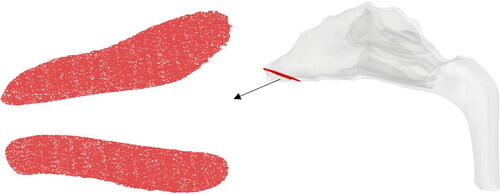
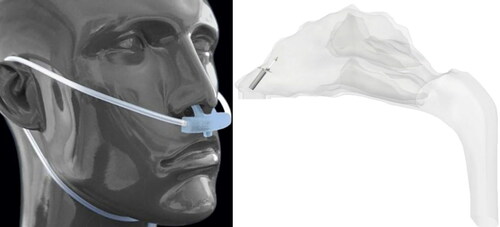
This strategy of using a High Flow Nasal Cannula (HFNC) has been previously investigated for pulmonary drug delivery of micron-particles (Longest, Walenga, et al. Citation2013; Longest, Golshahi, et al. Citation2013; G. Tian, Hindle, and Longest Citation2014). Furthermore, the location of nasal cannula prongs inside the nasal cavity is shown in . These prongs can be used to specifically target the olfactory region. Furthermore, the position and angle of the prongs (in accordance with the PRM approach) and the flowrate through the nasal cannula can be modified for optimum olfactory deposition. This possibility will be investigated in future studies.
Figure 13. Positioning of the cannula outside (https://www.sharn.com/co2levels/p/CapnoSureEtCO2AdultNasalCannulas/) and inside the nasal cavity.
5. Conclusion
The olfactory region in the nasal cavity is an important gateway for transporting drug particles into the brain for the treatment of various central nervous system disorders. Drug injection via the nasal route serves as a promising noninvasive technique for drug delivery. However, the complex structure of the human nasal cavity inhibits the transport of the particles to the olfactory region. Particle sizes ranging from 1 to 50 nm are optimal for actively crossing the Blood Brain Barrier via active or passive (i.e., diffusional) processes. This study aims at increasing the deposition of nanoparticles in the olfactory region.
This methodology employs the particle release map (PRM) approach to determine the optimal position of injection for elevated olfactory deposition. The PMRs further illustrated the behavior of particles in a sedentary flowrate of 20 lpm which corresponds to a normal breathing rate. The optimal injection point for targeting the olfactory region lies in the narrower section of the nostrils. Using the particle release maps, simulations were conducted to target the olfactory region and the results are very promising. Targeted injection achieves an olfactory deposition of 53% for 1 nm particles, 28% for 10 nm particles, 8.7% for 100 nm and 3.8% for 500 nm particles at a breathing rate of 20 lpm. Through the targeted injection approach, a substantial increase in olfactory deposition was observed. This targeted injection approach can be utilized in combination with a nasal cannula and a nebulizer that can inject particles from inside the nasal cavity.
6. Limitations
The present study is associated with certain assumptions to simplify the modeling and analysis procedure. As a result, limitations of the study are as follows.
All the simulations conducted in the steady state flow assumption, in line with inhalation conditions when drugs are administered.
Although a representative nasal cavity model was employed, the injection position for drug targeting is in some cases subject specific.
The effect of the mucus layer and associated mass transfer mechanisms are not taken into consideration yet.
The effect of outside breathing zones were not considered.
Acknowledgments
The authors thank the members of the Computational Multi-physics Laboratory at North Carolina State University for their input and guidance.
Declaration of interest
The authors have no competing interests to disclose.
References
- Agrawal, M., S. Saraf, S. Saraf, S. G. Antimisiaris, M. B. Chougule, S. A. Shoyele, and A. Alexander. 2018. Nose-to-brain drug delivery: An update on clinical challenges and progress towards approval of anti-Alzheimer drugs. J Control Release 281:139–77. doi:10.1016/j.jconrel.2018.05.011.
- Alzheimer Association Report. 2017. https://www.alz.org/media/documents/annual-report-2017.pdf
- Azad, T. D., J. Pan, I. D. Connolly, A. Remington, C. M. Wilson, and G. A. Grant. 2015. Therapeutic strategies to improve drug delivery across the blood-brain barrier. Neurosurg. Focus. 38 (3):E9. doi:10.3171/2014.12.FOCUS14758.
- Bahmanzadeh, H., O. Abouali, and G. Ahmadi. 2016. Unsteady particle tracking of micro-particle deposition in the human nasal cavity under cyclic inspiratory flow. J. Aerosol Sci. 101:86–103. doi:10.1016/j.jaerosci.2016.07.010.
- Bailey, A. G. 1997. The inhalation and deposition of charged particles within the human lung. J. Electrostat. 42 (1–2):25–32. doi:10.1016/S0304-3886(97)00134-4.
- Burgess, A., and K. Hynynen. 2013. Noninvasive and targeted drug delivery to the brain using focused ultrasound. ACS Chem. Neurosci. 4 (4):519–26. doi:10.1021/cn300191b.
- Calmet, H., C. Kleinstreuer, G. Houzeaux, A. V. Kolanjiyil, O. Lehmkuhl, E. Olivares, and M. Vázquez. 2018b. Subject-variability effects on micron particle deposition in human nasal cavities. J. Aerosol Sci. 115:12–28. doi:10.1016/j.jaerosci.2017.10.008.
- Calmet, H., G. Houzeaux, M. Vázquez, B. Eguzkitza, A. M. Gambaruto, A. J. Bates, and D. J. Doorly. 2018a. Flow features and micro-particle deposition in a human respiratory system during sniffing. J. Aerosol Sci. 123:171–84. doi:10.1016/j.jaerosci.2018.05.008.
- Cheng, K., Y. Cheng, H. Yeh, R. A. Guilmette, S. Q. Simpson, Y. Yang, and D. L. Swift. 1996. In vivo measurements of nasal airway dimensions and ultrafine aerosol deposition in the human nasal and oral airways. J. Aerosol Sci. 27 (5):785–801. doi:10.1016/0021-8502(96)00029-8.
- Cheng, Y. S., H. C. Yeh, R. A. Guilmette, S. Q. Simpson, K. H. Cheng, and D. L. Swift. 1996. Nasal deposition of ultrafine particles in human volunteers and its relationship to airway geometry. Aerosol Sci. Technol. 25 (3):274–91. doi:10.1080/02786829608965396.
- Cheng, Y. S., T. D. Holmes, J. Gao, R. A. Guilmette, S. Li, Y. Surakitbanharn, and C. Rowlings. 2001. Characterization of nasal spray pumps and deposition pattern in a replica of the human nasal airway. J. Aerosol. Med. 14 (2):267–80. doi:10.1089/08942680152484199.
- Cheng, Y., S. M. Smith, H. Yeh, D. Kim, K. Cheng, and D. L. Swift. 1995. Deposition of ultrafine aerosols and thoron progeny in replicas of nasal airways of young children. Aerosol Sci. Technol. 23 (4):541–52. doi:10.1080/02786829508965336.
- Childress, E. M., and C. Kleinstreuer. 2014. Computationally efficient particle release map determination for direct tumor-targeting in a representative hepatic artery system. J. Biomech. Eng. 136 (1):011012. doi:10.1115/1.4025881.
- Cunningham, E. 1910. On the velocity of steady fall of spherical particles through fluid medium. Proc. Roy. Soc. London A 83 (563):357–65.
- Dames, P., B. Gleich, A. Flemmer, K. Hajek, N. Seidl, F. Wiekhorst, D. Eberbeck, I. Bittmann, C. Bergemann, T. Weyh, et al. 2007. Targeted delivery of magnetic aerosol droplets to the lung. Nat. Nanotechnol. 2 (8):495–9. doi:10.1038/nnano.2007.217.
- Dehbi, A. 2008. Turbulent particle dispersion in arbitrary wall-bounded geometries: A coupled CFD-Langevin-equation based approach. Int. J. Multiphase Flow. 34 (9):819–28. doi:10.1016/j.ijmultiphaseflow.2008.03.001.
- Djupesland, P. G. 2013. No title. Nasal Devices.
- Djupesland, P. G., A. Skretting, M. Winderen, and T. Holand. 2004. Bi-directional nasal delivery of aerosols can prevent lung deposition. J. Aeros. Med. 17 (3):249–59. doi:10.1089/jam.2004.17.249.
- Dolecek, T. A., J. M. Propp, N. E. Stroup, and C. Kruchko. 2012. CBTRUS statistical report: Primary brain and central nervous system tumors diagnosed in the united states in 2005–2009. Neuro-Oncology 14 (suppl_5):v1–v49. doi:10.1093/neuonc/nos218.
- Dowley, A. C., and J. J. Homer. 2001. The effect of inferior turbinate hypertrophy on nasal spray distribution to the middle meatus. Clin. Otolaryngol. 26 (6):488–90. doi:10.1046/j.1365-2273.2001.00509.x.
- Gizurarson, S. 2003. No title. Google Patents.
- Helliwell, T. 2010. Inflammatory diseases of the nasal cavities and paranasal sinuses. Diagn. Histopathol. 16 (6):255–64. doi:10.1016/j.mpdhp.2010.03.008.
- Hoekman, J. D., and R. J. Ho. 2011. Effects of localized hydrophilic mannitol and hydrophobic nelfinavir administration targeted to olfactory epithelium on brain distribution. Aaps Pharmscitech. 12 (2):534–43. doi: 10.1208/s12249-011-9614-1.
- Hopkins, L. E., E. S. Patchin, P. Chiu, C. Brandenberger, S. Smiley-Jewell, and K. E. Pinkerton. 2014. Nose-to-brain transport of aerosolised quantum dots following acute exposure. Nanotoxicology 8 (8):885–93. doi:10.3109/17435390.2013.842267.
- Ingham, D. B. 1975. Diffusion of aerosols from a stream flowing through a cylindrical tube. J. Aerosol Sci. 6 (2):125–32. doi:10.1016/0021-8502(75)90005-1.
- Inthavong, K., L. T. Choi, J. Tu, S. Ding, and F. Thien. 2010. Micron particle deposition in a tracheobronchial airway model under different breathing conditions. Med. Eng. Phys. 32 (10):1198–212. doi:10.1016/j.medengphy.2010.08.012.
- Inthavong, K., P. Das, N. Singh, and J. Sznitman. 2019. In silico approaches to respiratory nasal flows: A review. J. Biomech. 97:109434. doi:10.1016/j.jbiomech.2019.109434.
- Inthavong, K., W. Yang, M. C. Fung, and J. Y. Tu. 2012. External and near-nozzle spray characteristics of a continuous spray atomized from a nasal spray device. Aerosol Sci. Technol. 46 (2):165–77. doi:10.1080/02786826.2011.617793.
- Kapadia, M., P. E. R. Grullo, and M. Tarabichi. 2019. Comparison of short nozzle and long nozzle spray in sinonasal drug delivery: A cadaveric study. Ear. Nose. Throat J. 98 (7):E97–E103. doi:10.1177/0145561319846830.
- Kayarkar, R., N. J. Clifton, and T. J. Woolford. 2002. An evaluation of the best head position for instillation of steroid nose drops. Clin. Otolaryngol. Allied. Sci. 27 (1):18–21. doi:10.1046/j.1365-2273.2002.00515.x.
- Kleinstreuer, C., and Z. Zhang. 2003. Laminar-to-turbulent fluid-particle flows in a human airway model. Int. J. Multiphase Flow. 29 (2):271–89. doi:10.1016/S0301-9322(02)00131-3.
- Lalatsa, A., D. M. Leite, M. F. Figueiredo, and M. O’Connor. 2018. Nanotechnology in brain tumor targeting: Efficacy and safety of nanoenabled carriers undergoing clinical testing. In Nanotechnology-based targeted drug delivery systems for brain tumors, 111–45. Academic Press.
- Lan, M., Y. Hsu, C. Hsu, C. Ho, J. Lin, and S. Lee. 2013. Induction of apoptosis by high-dose gold nanoparticles in nasopharyngeal carcinoma cells. Auris. Nasus. Larynx. 40 (6):563–8. doi:10.1016/j.anl.2013.04.011.
- Lesniak, M. S., and H. Brem. 2004. Targeted therapy for brain tumours. Nat. Rev. Drug Discov. 3 (6):499–508. doi:10.1038/nrd1414.
- Lipschitz, N., A. Yakirevitch, D. Sagiv, L. Migirov, Y. P. Talmi, M. Wolf, and E. E. Alon. 2017. Nasal vestibulitis: Etiology, risk factors, and clinical characteristics: A retrospective study of 118 cases. Diagn. Microbiol. Infect. Dis. 89 (2):131–4. doi:10.1016/j.diagmicrobio.2017.06.007.
- Longest, P. W., and M. J. Oldham. 2008. Numerical and experimental deposition of fine respiratory aerosols: Development of a two-phase drift flux model with near-wall velocity corrections. J Aerosol Sci. 39 (1):48–70. doi:10.1016/j.jaerosci.2007.10.001.
- Longest, P. W., L. Golshahi, and M. Hindle. 2013. Improving pharmaceutical aerosol delivery during noninvasive ventilation: Effects of streamlined components. Ann. Biomed. Eng. 41 (6):1217–32. doi:10.1007/s10439-013-0759-9.
- Longest, P. W., R. L. Walenga, Y. Son, and M. Hindle. 2013. High-efficiency generation and delivery of aerosols through nasal cannula during noninvasive ventilation. J. Aerosol. Med Pulm. Drug Deliv. 26 (5):266–79. doi:10.1089/jamp.2012.1006.
- Martin, A. R., and W. H. Finlay. 2008. Alignment of magnetite-loaded high aspect ratio aerosol drug particles with magnetic fields. Aerosol Sci. Technol. 42 (4):295–8. doi:10.1080/02786820802047123.
- Menter, F. 1993. Zonal two equation kw turbulence models for aerodynamic flows. Paper presented at the 23rd Fluid Dynamics, Plasmadynamics, and Lasers Conference, 2906. doi:10.2514/6.1993-2906.
- Oberdörster, G., Z. Sharp, V. Atudorei, A. Elder, R. Gelein, W. Kreyling, and C. Cox. 2004. Translocation of inhaled ultrafine particles to the brain. Inhalation Toxicol. 16 (6–7):437–45. doi:10.1080/08958370490439597.
- Obukhov, A. M. 1959. Description of turbulence in terms of Lagrangian variables. Adv. Geophys. 6:113–6.
- Pajouhesh, H., and G. R. Lenz. 2005. Medicinal chemical properties of successful central nervous system drugs. NeuroRx 2 (4):541–53. doi:10.1602/neurorx.2.4.541.
- Piomelli, U., and E. Balaras. 2002. Wall-layer models for large-eddy simulations. Annu. Rev. Fluid Mech. 34 (1):349–74. doi:10.1146/annurev.fluid.34.082901.144919.
- Saffman, P. G. T. 1965. The lift on a small sphere in a slow shear flow. J. Fluid Mech. 22 (2):385–400. doi:10.1017/S0022112065000824.
- Shi, H., C. Kleinstreuer, and Z. Zhang. 2006. Laminar airflow and nanoparticle or vapor deposition in a human nasal cavity model. Trans. ASME J. Biomech. Eng. 128 (5):697–706. doi:10.1115/1.2244574.
- Si, X. A., and Xi, J. 2016. Modeling and simulations of olfactory drug delivery with passive and active controls of nasally inhaled pharmaceutical aerosols. J. Vis. Exp. (111):e53902. doi:10.3791/53902.
- Si, X. A., J. Xi, J. Kim, Y. Zhou, and H. Zhong. 2013. Modeling of release position and ventilation effects on olfactory aerosol drug delivery. Respir. Physiol. Neurobiol. 186 (1):22–32. doi:10.1016/j.resp.2012.12.005.
- Stevens, W. W., R. P. Schleimer, and R. C. Kern. 2016. Chronic rhinosinusitis with nasal polyps. J. Allerg. Clin. Immunol. Pract. 4 (4):565–72. doi:10.1016/j.jaip.2016.04.012.
- Tian, G., M. Hindle, and P. W. Longest. 2014. Targeted lung delivery of nasally administered aerosols. Aerosol. Sci. Technol. 48 (4):434–49. doi:10.1080/02786826.2014.887829.
- Tian, L., Y. Shang, J. Dong, K. Inthavong, and J. Tu. 2017. Human nasal olfactory deposition of inhaled nanoparticles at low to moderate breathing rate. J. Aerosol Sci. 113:189–200. doi:10.1016/j.jaerosci.2017.08.006.
- Tian, L., Y. Shang, R. Chen, R. Bai, C. Chen, K. Inthavong, and J. Tu. 2019. Correlation of regional deposition dosage for inhaled nanoparticles in human and rat olfactory. Part. Fibre Toxicol. 16 (1):6. doi:10.1186/s12989-019-0290-8.
- Vachhani, S., and C. Kleinstreuer. 2021. Comparison of micron- and nano-particle transport in the human nasal cavity with a focus on the olfactory region. Comput. Biol. Med. 128:104103
- Wang, J., J. Bentz, and R. Anderson. 2007. No title. Google Patents.
- Wang, S. M., K. Inthavong, J. Wen, J. Y. Tu, and C. L. Xue. 2009. Comparison of micron-and nanoparticle deposition patterns in a realistic human nasal cavity. Respir. Physiol. Neurobiol. 166 (3):142–51. doi:10.1016/j.resp.2009.02.014.
- Wang, Y., B. Wen, H. Yu, D. Ding, J. Zhang, Y. Zhang, L. Zhao, and W. Zhang. 2018. Berberine hydrochloride-loaded chitosan nanoparticles effectively targets and suppresses human nasopharyngeal carcinoma. J. Biomed. Nanotechnol. 14 (8):1486–95. doi:10.1166/jbn.2018.2596.
- Wilson, I. B. 1947. The deposition of charged particles in tubes, with reference to the retention of therapeutic aerosols in the human lung. J. Colloid Sci. 2 (2):271–6. doi:10.1016/0095-8522(47)90028-7.
- Wong, J., H. Chan, and P. C. L. Kwok. 2013. Electrostatics in pharmaceutical aerosols for inhalation. Ther. Deliv. 4 (8):981–1002. doi:10.4155/tde.13.70.
- Wong, K. H., M. K. Riaz, Y. Xie, X. Zhang, Q. Liu, H. Chen, and Z. Yang. 2019. Review of current strategies for delivering Alzheimer’s disease drugs across the blood-brain barrier. Int. J. Mol. Sci. 20 (2):381. doi:10.3390/ijms20020381.
- Xi, J., and P. W. Longest. 2008. Evaluation of a drift flux model for simulating submicrometer aerosol dynamics in human upper tracheobronchial airways. Ann. Biomed. Eng. 36 (10):1714–34. doi:10.1007/s10439-008-9552-6.
- Xi, J., and X. A. Si. 2017. Numerical simulation and experimental testing to improve olfactory drug delivery with electric field guidance of charged particles. Adv. Technol. Deliver Therap. 89. doi:10.5772/65858.
- Xu, Z., and C. Kleinstreuer. 2018. Direct nanodrug delivery for tumor targeting subject to shear-augmented diffusion in blood flow. Med. Biol. Eng. Comput. 56 (11):1949–58. doi:10.1007/s11517-018-1818-z.
- Yang, B., X. Ni, L. Chen, H. Zhang, P. Ren, Y. Feng, and J. Wu. 2017. Honokiol-loaded polymeric nanoparticles: An active targeting drug delivery system for the treatment of nasopharyngeal carcinoma. Drug Deliv. 24 (1):660–9. doi:10.1080/10717544.2017.1303854.
- Yarragudi, S. B., H. Kumar, R. Jain, M. Tawhai, and S. Rizwan. 2020. Olfactory targeting of microparticles through inhalation and bi-directional airflow: Effect of particle size and nasal anatomy. J. Aerosol Med. Pulmon. Drug Deliver. 33 (5):258–70. doi:10.1089/jamp.2019.1549.
- You, Y., L. He, B. Ma, and T. Chen. 2017. High‐drug‐loading mesoporous silica nanorods with reduced toxicity for precise cancer therapy against nasopharyngeal carcinoma. Adv. Funct. Mater. 27 (42):1703313.