
 ?Mathematical formulae have been encoded as MathML and are displayed in this HTML version using MathJax in order to improve their display. Uncheck the box to turn MathJax off. This feature requires Javascript. Click on a formula to zoom.
Abstract
Black carbon (BC) mass concentration from internal combustion engines can be quantified using a variety of different BC measurement techniques. We compare the relative response of several commercial instruments with different measurement principles to different types of marine exhaust emissions. Exhaust samples were generated using a high-speed 4-stroke marine diesel engine at various engine operating conditions from low to high engine loads. Three different fuel types—diesel, distillate marine oil grade A (DMA) and intermediate fuel oil (IFO)—were used to generate soot particles with a wide range of physical, chemical and optical properties. Based on the standard deviation of the results at all engine conditions evaluated in the present study, the overall spread between the instruments was 24% for diesel, 30% for DMA and 37% for IFO samples. For samples with extremely high organic content (at 10% engine power), the agreement was poor and the standard deviation of the mass concentrations estimated from different instruments was 50% for diesel with OC/EC ≈ 45 and 72% for DMA with OC/EC ≈280. For IFO particles, more scattered mass concentrations were reported by different instruments at all engine loads, possibly due to very complex chemical composition and different optical properties in comparison with well-characterized soot particles. We explain the differences in reported values by combining information on exhaust composition with the measurement principles used in each instrument.
Editor:
1. Introduction
Black carbon (BC) particles, which represents a large fraction of nonvolatile particulate emissions from incomplete combustion processes, are refractory, insoluble and exist as aggregates of carbon spherules called primary particles (Bond et al. Citation2013). BC particles from internal combustion engines have intensive adverse effects on human health (Sydbom et al. Citation2001; Kennedy Citation2007) and climate (Pöschl Citation2005; Adachi, Chung and Buseck Citation2010). Marine diesel engines are one of the most important particle emission generators in harbor cities which are often also populous cities (Viana et al. Citation2014; Donateo et al. Citation2014). It has been shown that particles from marine engines have adverse biological effects on human lung cells (Oeder et al. Citation2015; Sapcariu et al. Citation2016). Wu et al. (Citation2018) showed that cytotoxicity of the marine engine particles can be even higher with heavy fuel oil used to run the engine. Approximately 8%–13% of the global diesel BC was produced by shipping in 2010 (Azzara, Minjares and Rutherford Citation2015) compared to 7%–9% in 2000 (Bond et al. Citation2013; Eyring et al. Citation2010) and the contribution of shipping is projected to continue rising. While the health impacts of black carbon emissions from shipping are mostly focused in coastal areas (Viana et al. Citation2020), their health and climate impacts also extend globally as they are transported around the world.
The International Maritime Organization (IMO) has been exploring measuring black carbon emissions from marine engines, more recently with a view to reduce the impact of shipping on the Arctic as the shipping routes become increasingly used due to the lengthening navigation season. While BC is measured and regulated in the automotive (Andersson et al. Citation2007; Andersson et al. Citation2010) and aviation sectors (Crayford et al. Citation2014; Lobo et al. Citation2020) within nonvolatile particulate matter, there is no agreed upon standardized measurement system for black carbon emissions from ships. The wide range of engines, fuels and after-treatments available in the marine sector requires that BC emissions from the shipping sector be characterized and their impact on the measurement methods be understood before the emissions can be measured with enough accuracy to allow for particulate emission regulations to be developed and applied.
Nonvolatile particle emissions from engines, which in the automotive and aviation sectors are considered to essentially be BC, can be quantified using various methods. For marine diesel engines, the assumption that nonvolatile particle emissions and BC are essentially the same may not hold since there may be significant amount of metal compounds in the marine engine exhaust specifically with heavy fuel oils (Momenimovahed et al. Citation2021a; Corbin et al. Citation2019). Traditionally, particulate emissions were measured directly by collecting particles on a filter for gravimetric analysis (Mohr, Forss and Lehmann Citation2006; Hu et al. Citation2014) but this technique has several downsides with the requirement for long collection times being one of the most problematic. Recently, several alternative techniques including laser induced incandescence and photoacoustic spectroscopy, were developed to quantify the mass concentration of BC from combustion sources in real-time, with time resolutions of 1 s or lower. These real-time BC measurement techniques offer advantage over the gravimetric method whose uncertainty is affected by gas-phase artifacts. In other words, gas-phase volatile and semi-volatile materials may condense on the surface of the filter resulting in an overestimation of the mass concentration from the gravimetric method by 10%–50% (Chase et al. Citation2004). The gas phase artifacts are expected to be more important in marine engines with extremely high organic content, sulfuric acid and sulfates generated at some engine operating condition and fuel combinations (see Section 3.3).
Soot particles from different sources may be different in terms of physical properties including morphology (Fujitani et al. Citation2016; Graves et al. Citation2015) and primary particle size in the aggregates (Dastanpour and Rogak Citation2014). Chemical composition and mixing state of particles are also source dependent (Maricq Citation2007). All optically based BC measurement techniques rely on knowledge of the optical properties of the soot or calibration against a referenced technique. Note that there is no agreed upon a universal reference technique for calibration of the real-time BC measurement instruments. The optical properties of soot particles are not always constant (Bond and Bergstrom Citation2006) and are a function of particle physical and chemical properties (Scarnato et al. Citation2013; Lesins, Chylek and Lohmann Citation2002). For instance, the mass absorption cross section (MAC) defined as the ratio of absorption coefficient to the BC mass concentration might be higher for larger particles (Dastanpour et al. Citation2017). Khalizov et al. (Citation2009) showed that MAC value of soot particles depends also on their chemical composition. They compared the fresh soot aggregates with soot particles with the same mobility diameter coated with sulfuric acid and showed that the coating can increase the MAC number by 45% for some specific particle sizes. MAC numbers are most often chosen based on assumed emission optical characteristics and are included in the software of some BC instrument to transform the signal into a BC mass concentration. Since the emission source can influence the optical properties of BC particles and different instruments utilize different functional relationships between the measured signal, the optical properties and the determined mass concentration, the relative response of BC diagnostic methods might not be the same for soot particles from different sources resulting in biases and/or uncertainties in the mass concentrations quantified for a single source using different instruments. Consequently, depending on the properties of the sample, some of these techniques might be more appropriate for measurement of BC particles.
BC measurement techniques are compared in the literature using combustion samples provided by automotive diesel engines (Kirchen et al. Citation2010), ship diesel engines (Buffaloe et al. Citation2014), gasoline port fuel injection and direct injection engines (Kamboures et al. Citation2013), natural gas engines (Momenimovahed et al. Citation2021b), aviation gas turbines (Lobo et al. Citation2020) and burners (Slowik et al. Citation2007). These studies suggest that the relative BC concentrations reported by different techniques as well as the correlation between them is highly source-dependent. More recently, Jiang et al. (Citation2018) employed several instruments to measure BC mass concentrations from a 2-stroke marine engine under two load conditions (i.e., 25% and 75% load) using three different fuel types including DMA, RMB-30 and RMG-380. They showed that the BC mass emission factor measurements from different instruments are generally in better agreement for high power (i.e., 75%) engine set point. However, at 25% engine power specifically for RMG-380 with high sulfur content, the variation between mass emission factors quantified by different instruments is remarkable.
Although a few studies compared some of the commercially available black carbon measurement instruments, there is still very limited data comparing these instruments for simultaneously obtained samples from a single source, specifically from marine engine exhaust with very complex chemical compositions. Therefore, in order to investigate the response of the BC mass measurement instruments relative to each other, a wide variety of instruments including Artium LII 300, DMT Photoacoustic Extinctiometer (PAX) at 870 nm wavelength, AVL Smoke Meter 415S, AVL Micro Soot Sensor (MSS), Magee Scientific Aethalometer AE33, DRI 2015 TOCA and Sunset Laboratory TOA Model 5 L were evaluated in the present study. Because different instruments rely on different measurement principles and properties of soot, it should be noted that the term “BC” in the current study refers to all types of black carbon including rBC (LII 300), EC (TOCA and TOA) and eBC (all other instruments) as described by Petzold et al. (Citation2013). The samples were extracted from the exhaust of a 4-stroke ship diesel engine at different engine power settings ranging from 10% to 100% operating with three different fuels from low-sulfur diesel fuel to high-sulfur intermediate fuel oil.
2. Experimental methods
2.1. Test engine and test conditions
The engine used was a high-speed single-cylinder research engine with direct-injection -1VDS18/15CR- with a nominal output power of 76 kW at 1500 rpm. This engine is a large-bore high-speed engine which is normally used as the main power supply on smaller ships (Corbin et al. Citation2018). The engine is equipped with a common rail fuel injection system, which is suitable for heavy fuel oil operation and an external mechanical compressor to simulate turbocharging, with a maximum injection pressure of 1300 bar. All three fuel types used in this study were injected through an injection nozzle with 9 holes (0.19 mm bore-diameter) and 155° spray angle. The rail pressure as well as the injection timing and duration were controlled using a programmable controller. The common rail system and the programmable controller enable the optimum injection pressures and times for each load point and engine speed. The injection pressure and timing did not vary between the three fuels. More details about the engine can be found in Streibel et al. (Citation2017).
The different engine conditions used for testing are available in . The engine was allowed to warm up for 120 min at the beginning of every test day, and a 30-minute stabilization time was built in between different engine conditions during the day.
Table 1. Engine conditions performed for each fuel in the order they were performed. Typically, the 9 engine conditions were performed divided on two days.
Three different fuels were used in conjunction with the engine conditions listed in : diesel fuel, distillate marine oil grade A (DMA), and intermediate fuel oil (IFO). The specification of the fuels used is summarized in .
Table 2. Selected test fuel characteristics.
2.2. Mass measurement instruments
2.2.1. Artium laser-induced incandescence (LII 300)
The LII 300 (Artium Technologies Inc., Sunnyvale, CA, USA) is a real-time (up to 20 Hz acquisition rate) BC mass-concentration instrument which can detect BC particles regardless of their mobility diameter. Its functioning principle is based on a high-energy pulsed laser applied to a flowing aerosol in a measurement cell. The pulsed laser heats up particles to near BC's sublimation temperature (∼4000 K) without reaching the sublimation point (Michelsen et al., Citation2015). Non- or less-refractory particles are sublimated and the remaining particles, assumed to be BC particles, emit an incandescence signal that is proportional to their mass concentration. The method theoretically allows a determination of rBC which is based on optical calibration of the instrument and assumed E(m) value which is a conversion factor from thermal radiation to refractory BC mass concentration (Snelling et al. 2002). However, better reproducibility has been found when the instrument is calibrated against a source with known concentrations (Dickau et al. Citation2015). In the current study, two LII 300 instruments were employed. The LII 300 s were calibrated within a month of the measurement campaign following the aviation standard calibration procedure (SAE AIR6241A Citation2020). The measurement cell’s windows were cleaned every morning before starting the measurements to ensure that there is no window contamination which can bias the results since LII 300 measures the absolute intensity of the soot incandescence.
2.2.2. Photoacoustic extinctiometer (PAX)
The Photoacoustic extinctiometer or PAX 870 nm (Droplet Measurement Technologies Inc., Longmont, CO, USA) is a PAS-based (photoacoustic spectroscopy) real-time (1 s time resolution) BC mass-concentration instrument. The PAX uses a photoacoustic technique to measure the absorption of 870 nm light by the particles, while a reciprocal nephelometer measures their total light scattering. The single scattering albedo as well as the equivalent BC (eBC) mass concentration can be estimated from these two measurements. The PAX was calibrated according to the manufacturer’s instructions before and after the campaign and retained very similar values. The MAC used by this instrument to convert light absorption to mass concentration was 4.74 m2g−1.
2.2.3. Avl smoke meter
The AVL 415SE smoke meter measures soot concentration in the exhaust of diesel engines in conformance to ISO 10054. The smoke meter, often referred to as the FSN in the marine engine industry, collects a user-defined exhaust gas volume on a filter. The light absorption-based measurement principle is based on the reflection of white light from the filter as measured through a green (560 nm) filter. The instrument directly reports the filter smoke number (FSN) which is then converted to eBC using the instrument manufacturer’s empirical equation:
(1)
(1)
The AVL 415SE was calibrated according to the manufacturer’s instructions.
2.2.4. Avl micro soot sensor (MSS)
AVL MSS (AVL List GmbH, Graz, Austria) is another PAS-based real-time (up to 10 Hz measurement rate) instrument which uses a modulated laser beam with a wavelength of 808 nm to increase the temperature of the particles. It then detects the transfer of energy from the particles to the surrounding air in the form of sound waves. The signal is amplified in a preamplifier and filtered in a "lock-in" amplifier and is finally converted to mass concentration. The MSS includes a conditioning and dilution unit with a variable dilution factor ranged between 2–20. The sample provided for the MSS in the current study was diluted at a dilution ratio of 6–8. The MSS was calibrated using the aviation standard calibration procedure (SAE AIR6241A Citation2020).
2.2.5. Aethalometer
The Aethalometer Model AE33 (Magee Scientific, Berkeley, CA, USA) is an optical, filter based device to measure real-time aerosol BC mass concentration. It measures the light attenuation through a Teflon coated quartz fiber filter tape at 7 wavelengths from the near UV-(370 nm) up to the near IR-(950 nm) while the filter is continuously collecting aerosol. The concentration of light absorbing aerosols (BC) is internally calculated from the rate of change of the attenuation of the light transmitted through the aerosol-laden filter while the sample flow rate is constant (Drinovec et al. Citation2015). The "filter loading effect" is corrected by the incorporated patented DualSpot™ measurement method. The wavelength of 880 nm is commonly used to report the equivalent BC (eBC) mass concentration. A mass attenuation coefficient of 7.77 m2/g was used to convert the light attenuation through the filter into the BC mass concentration.
2.2.6. Thermal-optical analysis
Thermal-Optical (Carbon) Analysis (TOA or TOCA) is an offline measurement method which separates the mass of organic carbon (OC) and elemental carbon (EC) collected on a quartz filter. It is generally performed in two phases, following a thermal protocol. At first, a piece of the filter, a filter punch, is heated in a helium atmosphere. In a second phase, the sample is heated in a helium and oxygen (2%) atmosphere during which the remaining carbonaceous material is oxidized and released from the filter and quantified. The transmittance or reflectance of light through or from the filter punch is monitored throughout the thermal protocol and an optical correction is applied to correct for possible pyrolysis of the OC during the first phase. Darkening of the filter induced by charring leads to a decrease of both light reflectance and transmittance. In an oxidizing atmosphere, the filter brightens up due to the EC being oxidized. The split for the optical correction is set to the point where the reflectance and transmittance signals reach their respective initial values determined at the beginning of the measurement. All carbon released from the filter prior to reaching this point is considered to be (pyrolytic) OC and all carbon released after this point is considered to be EC. In this campaign, two different thermal-optical analyzers and thermal protocols were used: a DRI Thermal-Optical Carbon Analyzer (TOCA, Model 2015, Aerosol Co., Ljubljana, Slovenia) with the IMPROVE_A thermal protocol (Chow et al. Citation2007) and a Sunset Thermal-Optical Analyzer (TOA, Model-5L OCEC Analyzer, Sunset Laboratory Inc., Tigard, OR, USA) with the EUSAAR_2 thermal protocol (Cavalli et al. Citation2010).
2.2.6.1. DRI Model 2015 multi-wavelength thermal/optical carbon analyzer
Filters used for sampling are pretreated through heating in an oven at 550 °C for 12 h and stored in sealed glass vessels prior to sampling. Emissions sampled from the engine exhaust are diluted 10- to 25-fold and the diluted PM is collected on the filters with a flow rate of 4 l min−1. Immediately after sampling, samples are stored in a freezer at −20 °C until analysis. A filter punch of 0.5 cm2 are placed into the thermal-optical carbon analyzer following the IMPROVE_A protocol (Chow et al. Citation2007). Organic compounds are volatilized at temperatures up to 580 °C. All the carbon that evolves from the filter punch is quantified by non-dispersive infrared (NDIR). The optical correction in this instrument is carried out by using the radiation of a 635-nm diode that is directed to the filter.
2.2.6.2. Sunset thermal/optical analyzer
The samples are collected on pre-fired quartz filters kept in a sealed plastic box. A front filter and a backer filter are collected to correct for gas-phase artifacts. All front and backer filters were kept together in the same storage conditions which include time spent at room temperature in a closed petri dish and in a fridge at 4 °C. A 1 cm2 filter punch is analyzed by Sunset TOA. The evolved carbon is measured using FID (Flame Ionization Detector) and the filter's carbon loading is monitored with a red laser (678 nm) to correct for pyrolysis of organic carbon. The EUSAAR_2 thermal protocol is used to analyze the filters. The instrument is regularly calibrated with sucrose solutions following manufacturer’s instructions and instrument blanks are performed twice daily. The OC value obtained from the analysis is then subtracted by the value obtained from the backer filter to correct for the gas-phase artifact.
2.3. Aerosol sampling system
There were essentially two exhaust sampling points for the instruments used in this study (see ): one group of instruments sampled the undiluted exhaust and another group sampled diluted exhaust from a sampling tunnel. The Aethalometer was in a group of its own, sampling 2-stage diluted exhaust, using the same sampling tunnel as other instruments for the first stage of dilution. The instruments directly connected to the main exhaust line use heated sample lines to draw exhaust. The other instruments collect sample from the sampling tunnel downstream of a heated DI-1000 Dekati dilutor. The heated sample lines are set to 100 °C, 120 °C, 70 °C, and 125 °C for LII1, MSS, AVL 415SE and Dekati diluter, respectively. The compressed air for the dilution was provided at 50 °C. While it is good practice to minimize the condensation of water and semi-volatile compounds on the solid particles when measuring BC, PAX also required dilution for the concentration to be within the instrument’s measurement range. A cyclone with a cutoff diameter of 1 micrometer (aerodynamic diameter) at 50 LPM was used upstream of the sampling tunnel to remove relatively larger particles. The mass concentrations for all instruments are reported at STP (T = 0 °C, P = 1 atm).
Figure 1. Schematic of the test setup.
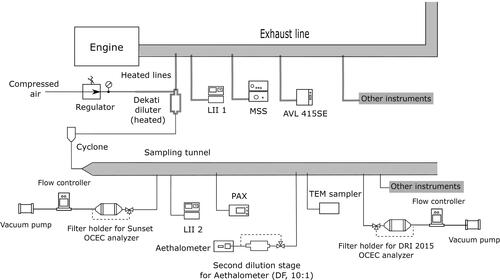
We applied particle loss corrections to reconcile the different sampling points. The correction applied by the smoke meter is built into the instrument during the conversion from the filter smoke number to the mass concentration. The conversion is based on an empirical formula which includes corrections. For the MSS, Tin and Tout is measured and the thermophoretic loss correction is automatically applied by the instrument software. For all other instruments, we corrected the BC mass concentration for thermophoretic loss, which was the dominant loss mechanism, during post-processing using the relation (Concin/Concout) = (Tin/Tout)0.38 (Kittelson and Johnson Citation1991).
All concentrations reported here are concentrations in the exhaust. The concentrations measured by the instruments sampling diluted exhaust were converted to raw exhaust concentrations using time-resolved dilution data. The dilution ratio (measured by CO2 monitoring) varied between 8 and 24 throughout the whole campaign, across all fuels and engine conditions. The variation of the dilution ratio for different instruments is reported in in the online supplementary information (SI). The broad range of dilution ratios observed was due to minor clogging of the Dekati dilutor’s sample orifice. The dilutor was pack-purged between sampling points to keep the orifice clear. The uncertainty of the dilution factor varied between −5% and +20% below and above the measurement point, respectively depending on the test point (see in the SI for details). In the case of the MSS, the dilution ratio was approximately 6–8 with an uncertainty of 6%. It should be noted that the uncertainty in the dilution factor does not affect the mass concentration from LII1 and AVL 415 SE since these two instruments analyze raw sample and their reported mass concentrations are not corrected for dilution.
The BC concentration was calculated from the averaged data for each test point defined by the acquisition time required to collect a filter for Thermal-Optical Analysis. For test points with very high BC concentration, multiple filters were acquired since the engine was run for approximately 60 min at each test point while enough sample could be collected on a filter for TOA in a few minutes for test points with high BC concentration. For instruments connected to the sampling tunnel, the diluted mass concentration was converted to the undiluted mass concentration on a per-second basis prior to the averaging the concentration. The MSS reports the concentration of the raw exhaust and the diluted soot as well as the dilution ratio second-by-second which were used to average the BC concentration. For the smoke meter which takes regular integrated measurements on a filter, the BC concentration was averaged using the values of the integral measurements collected during the test point.
3. Results and discussion
3.1. Comparison of thermal-optical analysis with different thermal protocols and instrument manufacturers
We used the Sunset TOA in combination with the EUSAAR_2 thermal protocol and the DRI TOCA in combination with the IMPROVE_A thermal protocol. In both instruments, the filter transmittance and reflectance were monitored to correct the split point for charring of the OC during analysis (Karanasiou et al. Citation2015). Instead of detecting zero or positive pyrolysis, negative pyrolysis (i.e., a lightening instead of a darkening of the filter sample) was detected for most samples analyzed by both instruments. For these samples, reflectance and/or transmittance returned to their initial values before the introduction of oxygen, setting the split point in the helium phase in the DRI instrument and at the he/ox transition in the Sunset instrument using CALC v. 426. This could be partially due to the uncertainty associated with the optical components of the instruments or to the removal or transformation of sample material that interferes with the instruments’ monitoring wavelength. It should also be noted that metal species such as metal oxides or metal salts are internally and/or externally mixed with marine engine soot particles specifically when running on IFO (Momenimovahed et al. Citation2021a). Metal oxides may provide oxygen for EC particles to be oxidized in the inert phase of the analysis (Chow et al. Citation2001) which can increase the detected transmittance or reflectance in the helium phase resulting in an early split. Another possible explanation could be the transformation of material during the analysis (Aakko-Saksa et al. Citation2018) although negative pyrolysis has not been observed directly. Negative pyrolysis has also been reported in the thermal-optical carbon analysis of atmospheric samples from IMPROVE sites (Chow et al. Citation2007) and has been attributed to mineral oxides. Chow et al. (Citation2007) also reported seeing a light red shading on the punches after their analysis. We observed the same for the marine samples presented here, in particular for IFO samples. The colors varied between shades of yellow to red which can be linked to residues of vanadium oxides.
shows the results of linear fits for both temperature protocols. For samples with negative pyrolysis, the DRI model matches the laser transmittance/reflectance to the initial transmittance/reflectance at the beginning of the thermal protocol. The Sunset model’s behavior with regards to pyrolysis, however, changes depending on the software version used. When using calc 426, the split point is determined based on the initial transmittance/reflectance. When using earlier versions of calc, calc 405 or earlier, the split point was determined based on the top of the OC transmittance, provided that it went back down in such a way that if the transmittance in the OC phase formed a hill, the top of that hill would be the reference transmittance. Note that the authors do not have access to the calc versions in between 405 and 426 and, as such, are not able to point to the exact version where this change happened. For filters with negative charring in the current study, the optical pyrolysis was assumed to be zero and the oxygen introduction time is used as split time for the DRI instrument with IMPROVE A, whereas the Sunset instrument with EUSAAR 2 and CALC v. 426 was usually automatically placing the split point at the beginning of the oxygen phase, except for one sample where it was manually fixed. Fixing the split point was done to increase comparability between the two methods, however, we recognize that ignoring the optical correction while using different protocols has its downsides even if the correction depends on the definition used for the split point. Since this is the case for approximately 90% of the samples collected in the present study, charring correction methods are not compared and the EC values are calculated based on a fixed split point. in the SI shows the thermogram for some samples with negative charring.
Figure 2. Comparison of the Sunset/EUSAAR 2 and the DRI/IMPROVE A thermal-optical carbon analysis. (a) Total carbon, and (b) elemental carbon with the split point at the helium-oxygen transition forced in most cases (i.e., thermal analysis only). The slopes and intercepts highlighted in bold are not significantly different from 1 and 0, respectively.
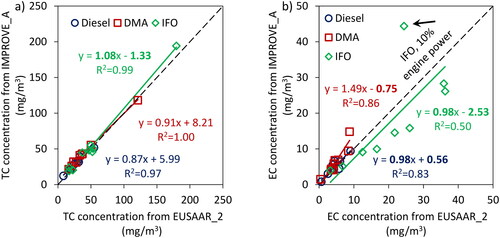
Since the uncertainty associated with TC and EC reported by Sunset instrument is different than that of DRI instrument, therefore Deming regression analysis is performed to calculate the linear relationships between the two analyzers. In addition, a one-sample t-test (level of significance of 0.05) was conducted on intercepts and slopes in order to understand whether the linear functions are statistically significantly different from y = x. The slopes and intercepts highlighted in bold are not significantly different from 1 and 0, respectively (see ).
As can be seen from , both instruments/thermal protocol combinations agree reasonably well with each other in terms of TC regardless of the fuel type suggesting that neither fuel type nor temperature protocol can significantly affect the total carbon concentrations reported by thermal-optical analyzers which was expected since the instruments have a good accuracy for measuring carbon, and almost all the uncertainty resides in the determination of the split point between OC and EC. The variation likely reflects sampling and/or storage differences affecting OC in particular since lighter organic compounds may have evaporated at +4 °C (i.e., storage condition for Sunset instrument) while they didn’t at −20 °C (i.e., storage condition for DRI instrument). In terms of correlation between the two datasets, EUSAAR_2 and IMPROVE_A correlate well for total carbon.
For the elemental carbon, instruments agree well with each other for diesel fuel and IFO, with both the slopes and intercept not being significantly different from y = x, however, the difference between the two instruments/thermal protocols is not negligible for the DMA fuel. The IFO fuel regression appears to be more by chance than real (being pulled closer to y = x by the 10% engine load point, see arrow). For the IFO, the difference between the instruments is mostly related to the IMPROVE_A EC concentrations being smaller than the EUSAAR_2 EC concentrations. For the DMA fuel, however, the ordinate at the origin is negligible but the slope is significantly different from 1. also shows that DRI/IMPROVE_A generally reports higher EC concentrations than Sunset/EUSAAR_2 for diesel and DMA fuels, however, for IFO the opposite was observed. This may be explained by the relatively high concentrations of OC generated at some operating conditions when running on diesel and DMA specifically at lower engine powers (will be discussed with and ). On the other hand, the maximum temperature in the first phase of the analysis is different for the two temperature protocols. Therefore, more material may evolve in the helium environment for temperature protocol with highest peak temperature in the OC phase (i.e., EUSAAR_2 protocol) resulting in higher OC and lower EC concentrations. This is consistent with the results reported by Subramanian, Khlystov and Robinson (Citation2006) and Kuhlbusch et al. (Citation2009). Subramanian, Khlystov and Robinson (Citation2006) compared three temperature protocols and showed that maximum OC concentration belongs to the temperature protocol with higher peak temperature. Kuhlbusch et al. (Citation2009) also observed similar trend and reported 36%–70% lower EC/TC ratio when the maximum temperature in the inert phase increased from 550 °C to 900 °C. With the exception of IFO samples, the correlation is fairly good when different thermal protocols are being compared for EC mass with R2 of 0.83 and 0.86. This is not however the case for EC concentrations from IFO which can be again the consequence of the presence of more metal oxides and salts in the samples. In other words, the maximum temperature in the inert phase as well as the amount of metal oxides and other oxygen-compounds mixed with soot particles can potentially affect the amount of EC evolving in the helium environment. Although the former depends only on the temperature protocol, the latter likely depends on the engine condition (Gagné et al. Citation2021) resulting in differences in the EC concentrations reported by EUSAAR_2 relative to IMPROVE_A at different engine operating conditions. Therefore, the EC concentrations from different temperature protocols are not perfectly correlated for IFO samples with relatively high mineral components. also shows that the EC concentration estimated from different thermal protocols are quite different for IFO sample at 10% engine power. Momenimovahed et al. (Citation2021a) measured the effective density functions for soot particles from the same engine at the same operating conditions used in the current study. They compared their results with a universal effective density function representative of BC particles from diesel engines based on the data reported by Olfert and Rogak (Citation2019) in order to estimate the concentration of metal species mixed with soot particles. They also directly quantified the metal concentrations using inductively coupled plasma mass spectrometry (ICP-MS) and noticed that these two methods agree fairly well for almost all fuel type/engine conditions except for IFO at 10% power suggesting that IFO particles at 10% power may be different than BC particles from other test points in terms of chemical composition as well as some other unknown properties which can also influence the response of TOA (EUSAAR_2) relative to TOA (IMPROVE_A). More work needs to be done in order to study the properties of soot particles generated from IFO fuel at low powers to understand the reason for this different behavior.
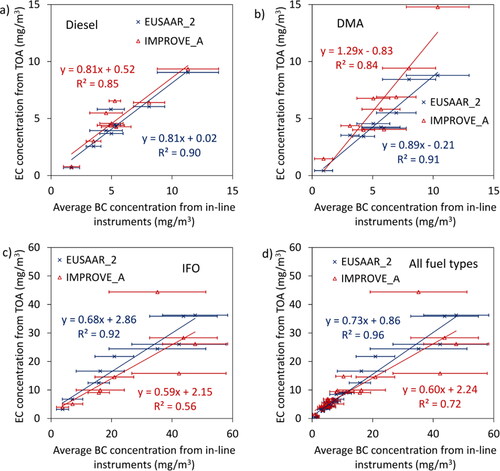
compares the EC concentration from two temperature protocols with average black carbon concentration measured by other techniques evaluated in the current study with the error bars representing the standard deviation of the BC concentrations measured by the six other BC instruments. Both temperature protocols agree reasonably well with other measurement techniques for diesel and DMA fuels, however for IFO, TOA reported lower BC concentration by up to 26% (for EUSAAR_2) and 36% (for IMPROVE_A) compared to the average in-line instruments. The slope of the linear regression changes within a relatively narrow range (0.68-0.89) for the different fuel types when EUSAAR_2 is used to estimate EC concentrations whereas for IMPROVE_A, the slope varies much more: 0.59–1.29. The reason for these differences could have to do with the amount of OC, its pyrolysis or lack thereof, or again, the presence of oxygen in the samples but the data presented here are not conclusive in that regard. also shows much scatter for the IMPROVE_A EC values, as indicated by a lower R2 for IFO. For the other two fuels, the R2 values associated with either thermal protocol are rather good.
Figure 3. Comparison of different instruments/thermal protocols compared with the average soot concentration as measured with in-line instruments.
3.2. Comparison of BC measurement techniques
compares the BC mass concentrations measured by different instruments. For most of the instruments, the ratio of BC mass concentration to the average mass concentration from all instruments is approximately constant through a wide range of engine conditions suggesting that different instruments respond similarly to the same types of particles. With the exception of 28% of the data points, this ratio fluctuates between 1 ± 0.3. For DMA particles at 10% engine power, four instruments including PAX, LII1, LII2 and TOA (EUSAAR_2) agree relatively well with each other while Aethalometer and AVL 415SE report several times more BC mass concentration which is likely due to interference of the very high OC with the filter-deposited BC particles (Weingartner et al. Citation2003). The discrepancy between different instruments for 10% load diesel particles is even more pronounced and the data points from different instruments are quite scattered. This might be again in part due to extremely high organic carbon concentration for 10% load diesel and DMA particles. shows that the ratio of OC to EC is approximately 45 and 280 for diesel and DMA particles, respectively, at 10% engine power which is several times more than OC/EC ratio at other engine operating conditions. It has been shown that high OC concentration can influence the response of BC mass measurement techniques for particles generated from other soot sources (Durdina et al. Citation2016; Slowik et al. Citation2007; Momenimovahed et al. Citation2021a). Durdina et al. (Citation2016) quantified the effect of OC concentration on the response of LII and MSS relative to TOA for particles generated from a mini-CAST. They showed that BC concentration from both LII and MSS is significantly lower than EC concentration reported by TOA when OC/TC ratio is high. For instance, for samples with 70% organic carbon, the ratio of BC from LII and MSS to EC from TOA was 0.07 and 0.58, respectively mostly due to internal structure of BC particles being less graphitized. Slowik et al. (Citation2007) also employed several other techniques including single particle soot photometer (SP2), multi-angle absorption photometer (MAAP), and photoacoustic spectrometer (PAS) to quantify particle mass concentration from a McKenna burner. They showed that when particles are coated with a thick layer of anthracene, MAAP and PAS report 20% and 65% more BC particles in comparison with SP2. The discrepancy between SP2 and other instruments for coated particles is likely attributed to the lensing effect of the coatings (Slowik et al., Citation2007).
Figure 4. Ratio of BC mass concentrations to average mass concentration for (a) diesel at 1500 rpm, (b) diesel at various engine speeds, (c) DMA at 1500 rpm, (d) DMA at various engine speeds, (e) IFO at 1500 rpm, and (f) IFO at various engine speeds. The gray bars represent the ratio of OC to EC and refer to the left-hand y-axis. The markers represent the ratio of the mass concentration of each instrument to the average of all in-line instruments and refer to the right-hand axis.
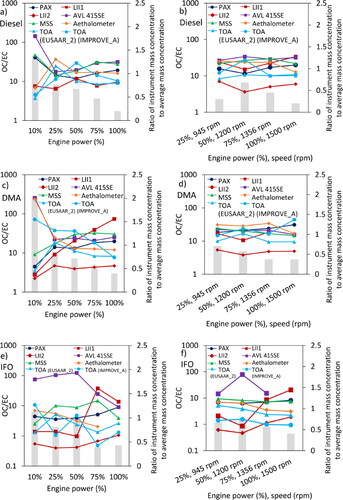
As seen in , LII1 shows a unique response to IFO samples with lower than average readings for low power engine settings jumping to higher than average for the high power engine settings ( and ). For the DMA samples at 1500 rpm engine speed (), LII1 also responded differently compared to other instruments and the ratio of mass concentration measured by LII1 to the average mass concentration starts from near 0.4 at 10% power reaching to almost 1.6 at 100% engine power. This different behavior likely is an indication of the higher fraction of Tar BrC compared to rBC emitted at the lower engine loads. Tar BrC refers to amorphous-carbon spherical particles with the diameter of 100 nm–300 nm composed of carbon, hydrogen and oxygen. Tar BrCs are normally solid particles but they can also exist in the form of liquid particles with very high viscosity. They have higher Angstrom absorption exponent (AAE) and higher sp3/sp2 carbon bonding ratio compared to BC. They are however similar to BC in terms of being refractory and insoluble in water and organic solvents (Corbin and Gysel-Beer Citation2019). Note that the LII 300 instrument is the only one among the 8 used in this study which does not measure Tar BrC as BC (see Corbin et al. Citation2019, ; Tóth et al. Citation2018), and as such, reports lower BC than the instrument-average. At higher engine loads, the fraction of Tar BrC decreases significantly (Corbin et al. Citation2019) and the LII gets closer to the instrument-average. AVL 415SE also responded differently to IFO particles. It should be noted that both LII1 and AVL 415SE were connected to the main exhaust line and collected undiluted sample. The BC concentrations in the raw exhaust were still within the detection range of the LII300 and AVL 415SE. Since the temperature of the samples provided for the LII1 and AVL 415SE is approximately the same as the temperature of the sample lines connected to these instruments (i.e., 100 °C and 70 °C for LII1 and AVL 415 SE, respectively), a significant fraction of the OC compounds in the LII1 and AVL 415 SE samples is in the particulate phase (Sippula et al., Citation2014). Aside from that, it has been shown that diluting the sample can significantly reduce the OC concentration depending on the dilution factor (Fujitani et al. Citation2012, Shrivastava et al., Citation2006). Therefore, LII1 and AVL 415 SE measure samples with presumably higher OC:EC ratios than the values reported in which represent OC fractions in the diluted samples. Therefore, the extremely high OC concentrations in IFO samples provided for LII1 and AVL 415SE provide good explanations for their difference in behavior. On the one hand, the AVL 415SE is a filter-based instrument, and is thus subject to the filter artifact (Weingartner Citation2003) which would enhance the light absorption of BC and increase the reported eBC value compared to the instrument-average. On the other hand, the LII being a two-colour rBC instrument, should not be affected by organic content, but in these very extreme cases, is likely to lose some power to evaporating organics and under-report BC compared to the instrument-average. Although the MSS also draws its sample from the main exhaust line, the MSS has its own dilution unit and analyzes the diluted sample similarly to the instruments connected to the dilution tunnel. The dilution ratio for the MSS was 6–8, slightly lower than for the dilution tunnel. shows that LII2 also disagrees with other BC instruments which is most likely attributed to the calibration rather than the measurement principle of the LII since LII2 consistently report a low concentration ratio relative to the other instruments.
In general, the agreement between different instruments is better for diesel particles. The average standard deviation between different instruments for all engine set points is 24%, 30%, and 37% for diesel, DMA and IFO particles, respectively. The BC concentration itself does not appear to be the reason for discrepancy between measurement instruments since no relationship was observed between the responses of the instruments relative to each other as a function of particle mass concentration (see in the SI). It should be noted that the deviation from the mean for the diesel and DMA data reported in mostly originated from the scattered data points at 10% engine power (where the OC is extremely high) so neglecting the 10% load data, the standard deviation improved by approximately 4%–5% for diesel and DMA results. For the IFO samples, both the OC and the Tar BrC content can partially explain the differences between different instruments. We note that the TOA results, for example, will not give a correct estimate of OC and EC in the IFO case because the TOA technique may count a fraction of Tar BrC as EC (Tóth et al. Citation2018). Moreover, as mentioned before, some EC particles may be counted as OC for IFO samples since they can react with the oxygen mixed with soot particles in the form of metal oxides and other oxygen-compounds. Furthermore, the optical properties of heavy metal elements mixed with IFO soot particles might be, to some extent, interfering with BC measurements by affecting the optical properties of the samples. More work needs to be done to quantify the refractive index, mass absorption cross section, single scattering albedo, etc. of particulate emissions from ship engines running on low quality fuels such as intermediate/heavy fuel oils in order to study their potential effects on the response of different black carbon measurement instruments.
The results presented in the current study are compared with the results reported in Jiang et al. (Citation2018) with similar BC instruments used to collect sample from a 2-stroke ship engine. They quantified the response of AVL smoke meter, LII 300, Aethalometer and TOA relative to MSS (selected arbitrarily as the reference instrument). compares the slope and intercept of the linear regression reported in Jiang et al. (Citation2018) with the corresponding values from the present study. As mentioned, the slopes and intercepts shown in are based on the MSS mass concentrations being on the x-axis and the mass concentrations from other BC instruments on the y-axis (see in the SI for more details). It should be noted that a 4-stroke engine was used in the current study while Jiang et al. (Citation2018) used a 2-stroke engine. In addition, Jiang et al. (Citation2018) used fuel types with different sulfur contents from 0.0013%−3.2%. The heavy fuel oil used in Jiang et al. (Citation2018) contains approximately 30% higher sulfur content than IFO fuel used in the current study. Moreover, NIOSH-5040 was used to perform TOA in Jiang et al. (Citation2018) while EUSAAR_2 and IMPROVE_A were used in this study. Therefore, some differences between these two studies are expected.
Table 3. Comparison of the results from current study with the results reported by Jiang et al. (Citation2018). For instruments with two lines of numbers, two instruments with the same measurement principle were used for the measurements.
With the exception of LII2 (slope = 0.57), the slopes reported in Jiang et al. (Citation2018) are within 20% of the values estimated in the current study for different instruments. also shows that smoke meter and LII1 report more mass concentrations than MSS while Aethalometer and TOA measure lower mass concentrations in comparison with MSS consistent with the results reported by Jiang et al. (Citation2018).
3.3. Instrument calibration using a single source
The previous section addressed how several black carbon measurement instruments respond to emissions from ship engines. It should be noted that the instruments evaluated in the current study were calibrated using different types of soot particles with different physical, chemical and optical properties. These particles were generated from various particle generators. In order to eliminate the effect of calibration source on the response of the instruments relative to each other, we re-calibrated all instruments after the campaign, based on a fit through the data collected from the engine running on the diesel fuel to enforce the instruments to agree with each other for the same types of particles (i.e., diesel particles). It should be noted that diesel fuel is arbitrarily selected for the re-calibration and does not have any advantages over other fuels in this regard. We then applied these calibration factors to the DMA and IFO data points and compare the relative response of the instruments with the results reported in the previous section. TOA was used as the reference technique for calibration because it is used as the reference method in the aviation sector for regulatory purposes, however this does not mean that TOA, with the protocols used in this study, can more accurately quantify BC from ship engines than other instruments. As shown in section 3.1 (), EUSAAR_2 shows a slope closer to one as well as better correlation coefficient than IMPROVE_A when compared with other BC instruments. Therefore, BC instruments were re-calibrated based on elemental carbon estimated from EUSAAR_2. Since all the instruments except the LII-based instruments confound Tar BrC and BC, we expect this post-campaign calibration to improve agreement for all the instruments except the LII, which should report smaller concentrations than the other instruments.
shows the re-calculated (i.e., after calibration using diesel fuel data) BC mass concentrations as a function of EC concentration measured by TOA-EUSAAR_2 for Diesel, DMA and IFO. For IFO samples, the BC concentration from all instruments except for LII2 and TOA-IMPROVE_A is higher than the EC concentration from TOA (EUSAAR_2) for a wide range of mass concentration. This is not however the case for DMA samples and BC concentration from different instrument relative to EC concentration from TOA-EUSAAR_2 varies depending on the instrument/concentration.
Figure 5. BC concentrations from re-calibrated in-line instruments vs. EC concentrations from TOA (EUSAAR_2).
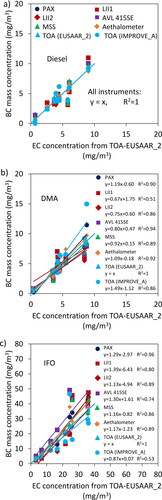
The adjusted BC concentrations are used to update the values reported in and the results are shown in the SI (see ). The average standard deviation of the data points for diesel, DMA and IFO are, respectively, 20%, 23%, and 26% with 4%–11% improvement in comparison with the case when instruments are calibrated using different soot generators. Note that the standard deviations are calculated using the data points reported on and which are representative of the ratio of the mass concentrations reported by different instruments to the average mass concentrations reported by all instruments. The fact that BC measurement instruments calibrated using a single source agree better when employed to quantify particles from other sources shows that (a) particle properties and consequently particle source can affect the response of real-time instruments, and (b) calibration of the real-time BC instruments using particles with similar properties as particles to be measured can improve their accuracy. It should be again noted that TOA may not be the most appropriate technique for calibration of real-time BC measurement instruments for marine engine exhaust since EC concentration reported by TOA may not represent BC concentration in the exhaust of marine engines with high concentrations of metal oxides and sulfates specifically when running on residual marine fuel oils.
4. Summary
The relative response of various BC measurement instruments to exhaust from a marine diesel engine using three fuels with different properties were quantified. The results reveal that
For thermal-optical analysis of the marine engine exhaust, the temperature protocol should be carefully chosen due to very high organic carbon concentrations and Tar BrC. Protocols should be carefully chosen or designed to (a) minimize negative and positive pyrolysis as not to confound the split point, (b) maximize the fraction of OC evolving during the OC phase, and ideally but not necessarily (c) give an indication of the fraction of the content that is Tar BrC.
Different instruments respond dramatically differently to samples with significantly high OC content (i.e., OC/EC > 45) generated at 10% engine power. Therefore, samples from ship engines at low powers should be conditioned to remove as much organic carbon particles as possible before analyzing it with BC measurement instruments. Moreover, undiluted samples may contain dramatically high concentration of organic carbon which can introduce more uncertainty and bias in the BC concentrations estimated from BC measurement instruments.
Metals and Tar BrC in IFO exhaust may be an important source of uncertainty and bias in the estimated BC mass concentrations. Using optical properties that are more representative of BC when measuring emissions generated with residual fuels, or taking the metals’ optical properties into account, could improve the accuracy of BC measurement techniques. Combining different measurement principles could prove to be the best and only way to achieve accurate measurements of BC from engines using residual fuels.
Neglecting data from instruments collecting undiluted sample (i.e., LII1 and AVL 415SE) as well as data from 10% engine power (i.e., sample with very high OC concentration), all instruments agree with each other within 26%. The agreement reached 17% when instruments were re-calibrated using a single source (i.e., marine engine running on diesel fuel). Note that the agreements reported above are calculated from the mass concentrations quantified by the instrument collecting diluted exhaust so the uncertainties in the dilution ratios cannot significantly influence these values since all instruments are affected by the same degree from the uncertainties of the dilution ratios. However, the uncertainties are slightly different at different fuels/engine conditions, therefore, a minor impact from the uncertainties of the dilution ratios on the agreement between different instruments is expected.
Supplemental Material
Download MS Word (3.2 MB)Acknowledgments
Holger Radloff at the University of Rostock is acknowledged for providing a source of BC typical of marine engines and fuels, for their help throughout the campaign and for their hospitality. Daniel Clavel, Simon-Alexandre Lussier, Brett Smith and Robert Sawchuck are acknowledged for their work preparing the instruments for the campaign and data analysis. Brett Smith is acknowledged for the EUSAAR_2 TOA. Aerosol d.o.o. (Ljubljana, Slovenia) is gratefully acknowledged for providing the DRI Model 2015 carbon analyzer for the Chair of Analytical Chemistry at University of Rostock. Dr. Monica Tutuianu is acknowledged for operating and analyzing the data from the two AVL instruments.
Additional information
Funding
References
- Aakko-Saksa, P., P. Koponen, M. Aurela, H. Vesala, P. Piimäkorpi, T. Murtonen, O. Sippula, H. Koponen, P. Karjalainen, N. Kuittinen, et al. 2018. Considerations in analysing elemental carbon from marine engine exhaust using residual, distillate and biofuels. J. Aerosol Sci. 126:191–204. doi: 10.1016/j.jaerosci.2018.09.005.
- Adachi, K., S. H. Chung, and P. R. Buseck. 2010. Shapes of soot aerosol particles and implications for their effects on climate. J. Geophys. Res. 115 (D15):D15206. doi: 10.1029/2009JD012868.
- Andersson, J., B. Giechaskiel, R. Munoz-Bueno, E. Sandbach, and P. Dilara. 2007. Particle measurement programme (PMP) light-duty inter-laboratory correlation exercise (ILCE_LD) final report. Institute for Environment and Sustainability. EUR 22775:2034–42.
- Andersson, J., A. Mamakos, B. Giechaskiel, M. Carriero, and G. Martini. 2010. Particle measurement programme (PMP) heavy-duty inter-laboratory correlation exercise (ILCE_HD) final report. Final Report. Joint Research Center. Ispra (VA). EUR, 24561. Luxembourg: Publications Office of the European Union.
- Azzara, A., R. Minjares, and D. Rutherford. 2015. Needs and opportunities to reduce black carbon emissions from maritime shipping. ICCT Working Paper 2015-2. //theicct.org/sites/default/files/publications/ICCT_black-carbon-maritime-shipping_20150324.pdf
- Bond, T. C., and R. W. Bergstrom. 2006. Light absorption by carbonaceous particles: An investigative review. Aerosol Sci. Technol. 40 (1):27–67. doi: 10.1080/02786820500421521.
- Bond, T. C., S. J. Doherty, D. W. Fahey, P. M. Forster, T. Berntsen, B. J. DeAngelo, M. G. Flanner, S. Ghan, B. Kärcher, D. Koch, et al. 2013. Bounding the role of black carbon in the climate system: A scientific assessment. J. Geophys. Res: Atmos. 118:5380–552.
- Buffaloe, G. M., D. A. Lack, E. J. Williams, D. Coffman, K. L. Hayden, B. M. Lerner, S.-M. Li, I. Nuaaman, P. Massoli, T. B. Onasch, et al. 2014. Black carbon emissions from in-use ships: a California regional assessment. Atmos. Chem. Phys. 14 (4):1881–96., doi: 10.5194/acp-14-1881-2014.
- Cavalli, F., M. Viana, K. E. Yttri, J. Genberg, and J. P. Putaud. 2010. Toward a standardised thermal-optical protocol for measuring atmospheric organic and elemental carbon: the EUSAAR protocol. Atmos. Meas. Tech. 3 (1):79–89. doi: 10.5194/amt-3-79-2010.
- Chase, R. E., G. J. Duszkiewicz, J. F. Richert, D. Lewis, M. M. Maricq, and N. Xu. 2004. PM measurement artifact: organic vapor deposition on different filter media. SAE Technical Paper No. 2004-01-0967.
- Chow, J. C., J. G. Watson, L. W. A. Chen, M. O. Chang, N. F. Robinson, D. Trimble, and S. Kohl. 2007. The IMPROVE_A temperature protocol for thermal/optical carbon analysis: maintaining consistency with a long-term database. J Air Waste Manag. Assoc. 57 (9):1014–23. doi: 10.3155/1047-3289.57.9.1014.
- Chow, J. C., J. G. Watson, D. Crow, D. H. Lowenthal, and T. Merrifield. 2001. Comparison of IMPROVE and NIOSH carbon measurements. Aerosol Science & Technology 34 (1):23–34. doi: 10.1080/02786820119073.
- Corbin, J. C., H. Czech, D. Massabò, F. Buatier de Mongeot, G. Jakobi, F. Liu, P. Lobo, C. Mennucci, A. A. Mensah, J. Orasche, et al. 2019. Infrared-absorbing carbonaceous tar can dominate light absorption by marine-engine exhaust. Npj Clim. Atmos. Sci. 2 (1):1–10. doi: 10.1038/s41612-019-0069-5.
- Corbin, J. C., and M. Gysel-Beer. 2019. Detection of tar brown carbon with a single particle soot photometer (SP2). Atmos. Chem. Phys. 19 (24):15673–90. doi: 10.5194/acp-19-15673-2019.
- Corbin, J. C., A. A. Mensah, S. M. Pieber, J. Orasche, B. Michalke, M. Zanatta, H. Czech, D. Massabò, F. Buatier de Mongeot, C. Mennucci, et al. 2018. Trace metals in soot and PM2.5 from heavy-fuel-oil combustion in a marine engine. Environ. Sci. Technol. 52 (11):6714–22. doi: 10.1021/acs.est.8b01764.
- Crayford, A. P., M. P. Johnson, Y. A. Sevcenco, P. I. Williams, P. Madden, R. Marsh, 2014. and, and P. J. Bowen. Studying, sAmpling and measuring of aircraft ParticuLate emissions III - specific Contract 05: SAMPLE III - SC.05. Cologne: European Aviation Safety Agency. https://www.easa.europa.eu/document-library/research-reports/easa2010fc10-sc05.
- Dastanpour, R., A. Momenimovahed, K. Thomson, J. S. Olfert, and S. Rogak. 2017. Variation of the optical properties of soot as a function of particle mass. Carbon 124:201–11. doi: 10.1016/j.carbon.2017.07.005.
- Dastanpour, R., and S. N. Rogak. 2014. Observations of a correlation between primary particle and aggregate size for soot particles. Aerosol Sci. Technol. 48 (10):1043–9. doi: 10.1080/02786826.2014.955565.
- Dickau, M., T. J. Johnson, K. Thomson, G. Smallwood, and J. S. Olfert. 2015. Demonstration of the CPMA-electrometer system for calibrating black carbon particulate mass instruments. Aerosol Sci. Technol. 49 (3):152–8. doi: 10.1080/02786826.2015.1010033.
- Donateo, A., E. Gregoris, A. Gambaro, E. Merico, R. Giua, A. Nocioni, and D. Contini. 2014. Contribution of harbour activities and ship traffic to PM2.5, particle number concentrations and PAHs in a port city of the Mediterranean Sea (Italy). Environ. Sci. Pollut. Res. 21 (15):9415–29. doi: 10.1007/s11356-014-2849-0.
- Drinovec, L., G. Močnik, P. Zotter, A. S. H. Prévôt, C. Ruckstuhl, E. Coz, M. Rupakheti, J. Sciare, T. Müller, A. Wiedensohler, et al. 2015. The "dual-spot" Aethalometer: an improved measurement of aerosol black carbon with real-time loading compensation. Atmos. Meas. Tech. 8 (5):1965–79. doi: 10.5194/amt-8-1965-2015.
- Durdina, L., P. Lobo, M. B. Trueblood, E. A. Black, S. Achterberg, D. E. Hagen, B. T. Brem, and J. Wang. 2016. Response of real-time black carbon mass instruments to mini-CAST soot. Aerosol Sci. Technol. 50 (9):906–18. doi: 10.1080/02786826.2016.1204423.
- Eyring, V., I. S. Isaksen, T. Berntsen, W. J. Collins, J. J. Corbett, O. Endresen, R. G. Grainger, J. Moldanova, H. Schlager, and D. S. Stevenson. 2010. Transport impacts on atmosphere and climate: Shipping. Atmos. Environ. 44 (37):4735–71. doi: 10.1016/j.atmosenv.2009.04.059.
- Fujitani, Y., K. Saitoh, A. Fushimi, K. Takahashi, S. Hasegawa, K. Tanabe, S. Kobayashi, A. Furuyama, S. Hirano, and A. Takami. 2012. Effect of isothermal dilution on emission factors of organic carbon and n-alkanes in the particle and gas phases of diesel exhaust. Atmos. Environ. 59:389–97. doi: 10.1016/j.atmosenv.2012.06.010.
- Fujitani, Y., K. Saitoh, Y. Kondo, A. Fushimi, A. Takami, K. Tanabe, and S. Kobayashi. 2016. Characterization of structure of single particles from various automobile engines under steady-state conditions. Aerosol Sci. Technol. 50 (10):1055–67. doi: 10.1080/02786826.2016.1218438.
- Gagné, S., M. Couillard, Z. Gajdosechova, A. Momenimovahed, G. Smallwood, Z. Mester, K. Thomson, P. Lobo, and J. C. Corbin. 2021. Ash-decorated and ash-painted soot from residual and distillate-fuel combustion in four marine engines and one aviation engine. Environ. Sci. Technol. 55:6584–6593.
- Graves, B., J. S. Olfert, B. Patychuk, R. Dastanpour, and S. Rogak. 2015. Characterization of particulate matter morphology and volatility from a compression-ignition natural-gas direct-injection engine. Aerosol Sci. Technol. 49 (8):589–98. doi: 10.1080/02786826.2015.1050482.
- Hu, S., S. Zhang, S. Sardar, S. Chen, I. Dzhema, S. M. Huang, D. Quiros, H. Sun, C. Laroo, L. J. Sanchez, et al. 2014. Evaluation of gravimetric method to measure light-duty vehicle particulate matter emissions at levels below one milligram per mile (1 mg/mile). SAE Technical Paper No. 2014-01-1571.
- Jiang, Y., J. Yang, S. Gagné, T. W. Chan, K. Thomson, E. Fofie, R. A. Cary, D. Rutherford, B. Comer, J. Swanson, et al. 2018. Sources of variance in BC mass measurements from a small marine engine: Influence of the instruments, fuels and loads. Atmos. Environ. 182:128–37. doi: 10.1016/j.atmosenv.2018.03.008.
- Kamboures, M. A., S. Hu, Y. Yu, J. Sandoval, P. Rieger, S. M. Huang, S. Zhang, I. Dzhema, D. Huo, A. Ayala, et al. 2013. Black carbon emissions in gasoline vehicle exhaust: A measurement and instrument comparison. J. Air Waste Manag. Assoc. 63 (8):886–901. doi: 10.1080/10962247.2013.787130.
- Karanasiou, A., M. C. Minguillón, M. Viana, A. Alastuey, J. P. Putaud, W. Maenhaut, P. Panteliadis, G. Močnik, O. Favez, and T. A. J. Kuhlbusch. 2015. Thermal-optical analysis for the measurement of elemental carbon (EC) and organic carbon (OC) in ambient air a literature review. Atmos. Meas. Tech. Discuss 8:9649–712.
- Kennedy, I. M. 2007. The health effects of combustion-generated aerosols. Proc Combust Instit 31: 2757–70.
- Khalizov, A. F., H. Xue, L. Wang, J. Zheng, and R. Zhang. 2009. Enhanced light absorption and scattering by carbon soot aerosol internally mixed with sulfuric acid. J. Phys. Chem. A. 113 (6):1066–74. doi: 10.1021/jp807531n.
- Kirchen, P., P. Obrecht, K. Boulouchos, and A. Bertola. 2010. Exhaust-stream and in-cylinder measurements and analysis of the soot emissions from a common rail diesel engine using two fuels. J. Eng. Gas Turb. Power 132 (11):112804. doi: 10.1115/1.4001083.
- Kittelson, D. B., and J. H. Johnson. 1991. Variability in Particle Emission Measurements in the Heavy-Duty Transient Test, SAE Technical Paper No. 910738.
- Kuhlbusch, T., A. Borowiak, A. Gelenscer, J. Genberg, D. Gladtke, W. Maenhaut, C. Pio, O. Popoviecheva, J.-P. Putaud, P. Quincey, et al. 2009. Measurement of elemental and organic carbon in Europe. JRC Scientific and Technical Reports: EUR 23992 EN – 2009.
- Lesins, G., P. Chylek, and U. Lohmann. 2002. A study of internal and external mixing scenarios and its effect on aerosol optical properties and direct radiative forcing. J. Geophys. Res. 107 (D10):AAC 5-1– 5-12. doi: 10.1029/2001JD000973.
- Lobo, P., L. Durdina, B. T. Brem, A. P. Crayford, M. P. Johnson, G. J. Smallwood, F. Siegerist, P. I. Williams, E. A. Black, A. Llamedo, et al. 2020. Comparison of standardized sampling and measurement reference systems for aircraft engine non-volatile particulate matter emissions. J. Aerosol Sci. 145 (105557):105557. doi: 10.1016/j.jaerosci.2020.105557.
- Shrivastava, M. K., E. M. Lipsky, C. O. Stanier, and A. L. Robinson. 2006. Modeling semivolatile organic aerosol mass emissions from combustion systems. Environ. Sci. Technol. 40 (8):2671–7. doi: 10.1021/es0522231.
- Maricq, M. M. 2007. Chemical characterization of particulate emissions from diesel engines: A review. J. Aerosol Sci. 38:1079–118.
- Michelsen, H. A., C. Schulz, G. J. Smallwood, and S. Will. 2015. Laser-induced incandescence: Particulate diagnostics for combustion, atmospheric, and industrial applications. Prog. Energy Combust. Sci. 51:2–48. doi: 10.1016/j.pecs.2015.07.001.
- Mohr, M.,. A. M. Forss, and U. Lehmann. 2006. Particle emissions from diesel passenger cars equipped with a particle trap in comparison to other technologies. Environ. Sci. Technol. 40 (7):2375–83. doi: 10.1021/es051440z.
- Momenimovahed, A., S. Gagné, Z. Gajdosechova, J. C. Corbin, G. J. Smallwood, Z. Mester, B. Behrends, V. Wichmann, and K. A. Thomson. 2021a. Effective density and metals content of particle emissions generated by a diesel engine operating under different marine fuels. J. Aerosol Sci. 151 (105651):105651. doi: 10.1016/j.jaerosci.2020.105651.
- Momenimovahed, A., F. Liu, K. A. Thomson, G. J. Smallwood, and H. Guo. 2021b. Effect of fuel composition on properties of particles emitted from a diesel–natural gas dual fuel engine. Int. J. Engine Res. 22 (1):77–87. doi: 10.1177/1468087419846018.
- Oeder, S., T. Kanashova, O. Sippula, S. C. Sapcariu, T. Streibel, J. M. Arteaga-Salas, J. Passig, M. Dilger, H.-R. Paur, C. Schlager, et al. 2015. Particulate matter from both heavy fuel oil and diesel fuel shipping emissions show strong biological effects on human lung cells at realistic and comparable in vitro exposure conditions. PLoS One. 10 (6):e0126536. doi: 10.1371/journal.pone.0126536.
- Olfert, J., and S. Rogak. 2019. Universal relations between soot effective density and primary particle size for common combustion sources. Aerosol Sci. Technol. 53 (5):485–92. doi: 10.1080/02786826.2019.1577949.
- Petzold, A., J. A. Ogren, M. Fiebig, P. Laj, S. Li, U. Baltensperger, T. Holzer-Popp, S. Kinne, G. Pappalardo, N. Sugimoto, et al. 2013. Recommendations for the interpretation reporting of" black carbon. Atmos. Chem. Phys. 13 (16):8365–79. doi: 10.5194/acp-13-8365-2013.
- Pöschl, U. 2005. Atmospheric aerosols: composition, transformation, climate and health effects. Angew. Chem. Int. Ed. Engl. 44 (46):7520–40. doi: 10.1002/anie.200501122.
- SAE AIR6241A. 2020. Procedure for the continuous sampling and measurement of non-volatile particle emissions from aircraft turbine engines. Warrendale, PA: SAE International.
- Sapcariu, S. C., T. Kanashova, M. Dilger, S. Diabaté, S. Oeder, J. Passig, C. Radischat, J. Buters, O. Sippula, T. Streibel, et al. 2016. Metabolic profiling as well as stable isotope assisted metabolic and proteomic analysis of RAW 264.7 macrophages exposed to ship engine aerosol emissions: different effects of heavy fuel oil and refined diesel fuel. PloS One. 11 (6):e0157964. doi: 10.1371/journal.pone.0157964.
- Scarnato, B. V., S. Vahidinia, D. T. Richard, and T. W. Kirchstetter. 2013. Effects of internal mixing and aggregate morphology on optical properties of black carbon using a discrete dipole approximation model. Atmos. Chem. Phys. 13 (10):5089–101. doi: 10.5194/acp-13-5089-2013.
- Sippula, O., B. Stengel, M. Sklorz, T. Streibel, R. Rabe, J. Orasche, J. Lintelmann, B. Michalke, G. Abbaszade, C. Radischat, et al. 2014. Particle emissions from a marine engine: chemical composition and aromatic emission profiles under various operating conditions. Environ. Sci. Technol. 48 (19):11721–9. doi: 10.1021/es502484z.
- Slowik, J. G., E. S. Cross, J. H. Han, P. Davidovits, T. B. Onasch, J. T. Jayne, L. R. Williams, M. R. Canagaratna, D. R. Worsnop, R. K. Chakrabarty, et al. 2007. An inter-comparison of instruments measuring black carbon content of soot particles. Aerosol Sci. Technol. 41 (3):295–314. doi: 10.1080/02786820701197078.
- Streibel, T., J. Schnelle-Kreis, H. Czech, H. Harndorf, G. Jakobi, J. Jokiniemi, E. Karg, J. Lintelmann, G. Matuschek, B. Michalke, et al. 2017. Aerosol emissions of a ship diesel engine operated with diesel fuel or heavy fuel oil. Environ. Sci. Pollut. Res. Int. 24 (12):10976–91. doi: 10.1007/s11356-016-6724-z.
- Subramanian, R., A. Y. Khlystov, and A. L. Robinson. 2006. Effect of peak inert-mode temperature on elemental carbon measured using thermal-optical analysis. Aerosol Sci. Technol. 40 (10):763–80. doi: 10.1080/02786820600714403.
- Sydbom, A., A. Blomberg, S. Parnia, N. Stenfors, T. Sandström, and S. E. Dahlen. 2001. Health effects of diesel exhaust emissions. Eur. Respirat. J. 17 (4):733–46. doi: 10.1183/09031936.01.17407330.
- Tóth, Á., A. Hoffer, M. Pósfai, T. Ajtai, Z. Kónya, M. Blazsó, Z. Czégény, G. Kiss, Z. Bozóki, and A. Gelencsér. 2018. Chemical characterization of laboratory-generated tar ball particles. Atmos. Chem. Phys. 18 (14):10407–18. doi: 10.5194/acp-18-10407-2018.
- Viana, M., P. Hammingh, A. Colette, X. Querol, B. Degraeuwe, I. de Vlieger, and J. Van Aardenne. 2014. Impact of maritime transport emissions on coastal air quality in Europe. Atmos. Environ. 90:96–105. doi: 10.1016/j.atmosenv.2014.03.046.
- Viana, M., V. Rizza, A. Tobías, E. Carr, J. Corbett, M. Sofiev, A. Karanasiou, G. Buonanno, and N. Fann. 2020. Estimated health impacts from maritime transport in the Mediterranean region and benefits from the use of cleaner fuels. Environ. Int. 138 (105670):105670. doi: 10.1016/j.envint.2020.105670.
- Weingartner, E., H. Saathoff, M. Schnaiter, N. Streit, B. Bitnar, and U. Baltensperger. 2003. Absorption of light by soot particles: determination of the absorption coefficient by means of aethalometers. J. Aerosol Sci. 34 (10):1445–63. doi: 10.1016/S0021-8502(03)00359-8.
- Wu, D., Q. Li, X. Ding, J. Sun, D. Li, H. Fu, M. Teich, X. Ye, and J. Chen. 2018. Primary particulate matter emitted from heavy fuel and diesel oil combustion in a typical container ship: characteristics and toxicity. Environ. Sci. Technol. 52 (21):12943–51. doi: 10.1021/acs.est.8b04471.