
 ?Mathematical formulae have been encoded as MathML and are displayed in this HTML version using MathJax in order to improve their display. Uncheck the box to turn MathJax off. This feature requires Javascript. Click on a formula to zoom.
Abstract
The crankcase of combustion engines is an undesirable source of oil vapor and oily aerosols. The roles of nucleation and growth by vapor condensation in their formation (with and without preexisting nuclei) were investigated both experimentally and by one-dimensional simulation under engine-like conditions using actual engine oil as well as hexadecane. Initial equilibrium saturation levels (at Tsat = 100 °C to 130 °C) were known and well defined; cooling took place in laminar tube flow at a defined rate. Nucleation and growth of preexisting nuclei lead to separate peaks around 0.25 ± 0.1 µm and 0.7 ± 0.2 µm, respectively, that agree remarkably well with actual engine data. The position of the latter peak was quite insensitive to primary nuclei size in the range of 0.04 to 0.2 µm. Increasing either the vapor concentration (via a more volatile oil or higher Tsat) or decreasing the cooling rate lead to slightly larger nucleation peaks (0.15 –> 0.35 µm) but significantly lower peak concentrations (10x). Although counter-intuitive at first, this is explainable by shifts in supersaturation profile during cool-down. Experiment and simulation limit spontaneous nucleation to preexisting nuclei concentrations below about 2 to 5 × 105 cm−3 at engine oil temperatures ≥100 °C. Significant vapor losses to system walls during cool-down are an important factor in an actual engine environment as well as in the lab and must be included for realistic simulations. Losses affect actual number concentrations more than peak location.
Copyright © 2021 American Association for Aerosol Research
EDITOR:
1. Introduction
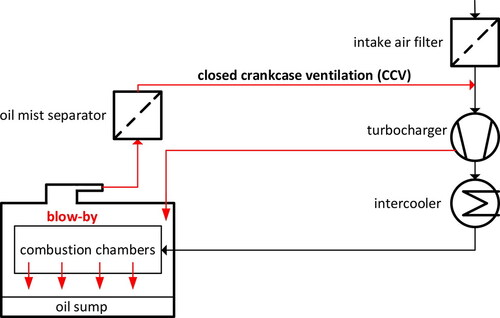
Aside from emissions through the tailpipe, which have been studied extensively (e.g., Kittelson Citation1998; Harris and Maricq Citation2001; Burtscher Citation2005; Maricq Citation2007), combustion engines are known also to emit vapors and aerosols from the crankcase, mostly in the form of oil (Sauter Citation2004; Agarwal, Goyal, and Srivastava Citation2011; Johnson Citation2012; Ehteram et al. Citation2013). The crankcase ventilation system represents an important source of aerosols. Unless they are treated by adequate means, these oily aerosols contribute significantly to the total emissions to the environment or, in case of engines equipped with a closed crankcase ventilation system (CCV; ), cause a variety of other problems (Lakshmanan et al. Citation2019). Currently, the most common approach is to remove such aerosols with an efficient particle separator (Golkarfard et al. Citation2018). Another, more sustainable approach is to develop in-engine strategies to reduce aerosol production at the source, based on an understanding of aerosol sources and formation mechanisms in that complex crankcase environment.
Figure 1. Schematic of a closed crankcase ventilation system (CCV). The blow-by flow (red arrows) contains oily aerosols. Their concentration is reduced by an oil mist separator before being vented to the intake stroke.
Vapor condensation during cool-down of the crankcase flow is mentioned frequently in the context of crankcase aerosol sources. However, the literature does not provide quantitative estimates for its importance or the size range where such aerosols might be found. The current article addresses the likelihood and importance of heterogeneous or homogenous nucleation explicitly within the range of conditions found in a typical crankcase environment.
As in many other oil-lubricated machines, crankcase aerosols can arise from mechanical processes, e.g., fast-moving engine components such as shafts and rockers, or by atomization of oil ejected through nozzles (including bearing and piston ring gaps). But aerosol is thought to form also by condensation of oil vapor generated abundantly near engine hot-spots such as pistons or lubricated liners. This all the more as modern combustion engines are designed for increasingly higher power densities and bulk oil temperatures. At present however, there is only scant evidence regarding the true extent of the vapor contribution to the crankcase aerosol detected further downstream in much cooler regions of the engine.
Following well-established concepts of vapor-to-particle conversion, such aerosols may form by homogeneous nucleation and/or by vapor condensation onto preexisting particles (including freshly nucleated oil droplets), causing their subsequent growth. According to classical theory the mechanisms and kinetics of nucleation and growth are very different, with spontaneous nucleation requiring much higher levels of supersaturation S than condensational growth, which can operate at levels barely above unity. If nucleation is relevant at all in a given system, it will, therefore, occur as an initial burst, while condensation takes over as soon as S relaxes ever so slightly and then carries on until the vapor is sufficiently depleted by condensation onto aerosol or macroscopic surfaces.
Given that their kinetics and requirements are so very different, the repartition between the two effects must be highly dependent on local conditions, in our case within an engine. Key parameters include the initial amount of vapor available (which in turn depends on temperature and type of oil), the concentration and size range of preexisting aerosol (e.g., soot from combustion, or fine oil droplets generated mechanically) as well as the mixing and cooling rate(s) further downstream. The body of studies on aerosol formation from condensable vapors by physical or chemical processes is vast, reaching back to the pioneering work of John Aitken in the nineteenth century (e.g., Fan et al. Citation2016; Kreidenweis, Petters, and Lohmann Citation2019). Unfortunately, the overwhelming majority of these studies concerns the atmosphere, which differs in almost all relevant aspects from those in an engine, including system composition and chemistry as well as the scales of time and space.
With regard to the role of condensation during the formation of crankcase aerosols, it would of course be best to consult the experimental evidence. Much of the published work on crankcase aerosols is concerned with testing the performance of abatement devices (e.g., Kissner and Ruppel Citation2009), and thus, not very helpful for our purposes. A few papers do however present size distribution information in the micron and submicron region of the aerosol spectrum originating mostly from the crankcases of fired or motored truck diesel engines (Tatli and Clark Citation2008; Johnson et al. Citation2011; Lorenz et al. Citation2020; Nowak et al. Citation2020; Scheiber et al. Citation2021). These truly complex, multi-modal size spectra do not lend themselves to straightforward interpretation. When overlayed they nevertheless shown common features that provide useful clues as to their origin.
Above 1 µm, the “typical” crankcase particle size distribution (PSD) shows two distinct size ranges: a very broad mode >10 µm (upward limited only by the measurement technique), and a fairly narrow satellite drop peak recurring around 2 µm (Nowak et al. Citation2020) also found in re-entrainment spectra from oil mist filters (Wurster, Meyer, and Kasper Citation2017) as well as the output from oil mist nebulizers (Sagot et al. Citation2014). The 2 µm peak is not very pronounced when based on particle number (and thus, sometimes overlooked) but very distinctive when PSD is based on mass. These super-micron peaks are certainly due to mechanical processes such as splashing, atomization, and the bursting of bubbles. This is also supported by the observation (Nowak et al. Citation2020) that they depend rather weakly on oil temperature (except via changes in oil viscosity) and vapor concentration.
Below the 1 µm cutoff one typically identifies three distinct modal size ranges, one around 30 nm (sometimes also a bit higher but always <100 nm), one around 130 − 300 nm, and one in the range of 600 − 900 nm (Tatli and Clark Citation2008; Johnson et al. Citation2011; Lorenz et al. Citation2020; Nowak et al. Citation2020; Scheiber et al. Citation2021). These are indeed “signature modes” in the sense that they recur in many datasets, although with somewhat varying locations on the size axis and strongly varying intensities depending on engine design, engine load (and hence, oil temperature and pressure) as well as other factors. Needless to say, some of these modes “appear” or “disappear” when switching between number and volume/mass distributions.
From among the submicron modes – where one would search primarily for signs of vapor condensation – the finest, in the range of a few tens of nanometers, is most likely due to particles from combustion, i.e., soot. It tends to increase dramatically with load, and thus, with mean effective pressure (Tatli and Clark Citation2008; Johnson et al. Citation2011). Particles in that size range are predestined to serve as condensation nuclei, but it is not clear in which part of the spectrum they re-appear after cool-down and growth, and whether homogeneous nucleation can take place concurrently.
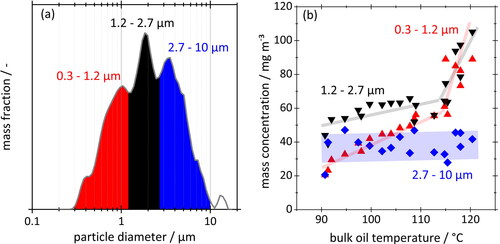
The search for clues of vapor to particle conversion effects must, therefore, concentrate on the region between about 0.1 µm and 1 µm. Lorenz et al. (Citation2020) were the first to point out that both modes in that range are very sensitive to (bulk) oil temperature, with a roughly 50-fold increase in mass concentration between 35 °C and 105 °C. The sensitivity of micron and submicron size crankcase aerosols to oil temperature becomes even more apparent in . The figure represents a compilation of data from the same medium-duty truck diesel engine used later on in this article. The mass-based PSD from this engine have a recurring pattern of peaks which permit a fractionation of aerosol mass into different size classes according to . The respective aerosol mass concentrations are then plotted against bulk oil temperature in . One notices the increasing response of oil concentration toward finer particles, and especially the abrupt increase beyond 115 °C where the submicron fraction appears to overtake the larger particles.
Figure 2. (a) Typical crankcase aerosol size distribution to illustrate the choice of particle size ranges. (b) Oil aerosol concentration vs. bulk oil temperature for three particle size intervals characteristic of crankcase aerosols. Data extracted from optical particle counter (OPC) measurements across a wide range of operating conditions for a medium-duty 4-cylinder 5.1-liter diesel engine. Lines inserted to guide the eye.
Nowak et al. (Citation2020) found that the 0.3 µm peak in engine oil spectra tends to shrink in favor of the next larger peak when cooling a mix of oil vapor and aerosol without adequate dilution. While this lends further support to the size interval between 0.1 µm and 1 µm as most interesting for condensation effects, it still leaves the question how condensation and nucleation influence these peaks, and whether spontaneous new particle formation can coexist with heterogenous growth under realistic engine-like conditions. The pursuit of this question is the principal topic of this article.
Since it is practically impossible to vary the relevant parameters independently of each other during operation of a fired (or even motored) engine, these conditions were emulated as closely as possible in a laboratory experiment with actual motor oil as well as hexadecane. Saturated air–vapor mixtures were generated from these liquids in a temperature range between 100 °C and 130 °C, and then, cooled down at known rates to near ambient, with and without preexisting oil droplets. Size distributions were recorded by optical particle counter (OPC) in combination with electrical mobility measurements (SMPS) to detect homogeneous nucleation as well growth by condensation.
Separately, nucleation and growth were simulated numerically with a one-dimensional model (Winkelmann et al. Citation2014) based on classical nucleation theory (Becker and Döring Citation1935) in combination with mass transfer by evaporation and condensation to droplets according to Friedlander (Citation1977). The model was extended via MATLAB to deal with preexisting condensation nuclei as well as multiple droplet size fractions generated along the cool-down tube used in the experiments. The simulations were validated first against the hexadecane experiments, and then used to study the parameter range where experiments are tedious such as cooling rate, vapor concentration or oil surface tension. Equilibrium vapor data for hexadecane were taken from the literature; for actual motor oil they were measured in the temperature range of interest.
At first, we present data from gas chromatography (GC) showing differences in hydrocarbon composition between sump oil and crankcase aerosol sampled during operation of an internal combustion engine. These data provide indirect evidence of significant fractionation effects due to evaporation and re-condensation at a high engine load.
2. Materials and methods
2.1. Engine characteristics - composition analysis of submicron crankcase aerosol by GC
For the purpose of composition analysis, the predominantly submicron aerosol fraction was sampled from the crankcase of a 4-cylinder 5.1-liter medium-duty diesel engine. The engine was installed on a test bench and operated at nominal power (170 kW, 730 Nm, 2200 rpm). This operating point provides for hot engine components and oil, conditions that boost oil evaporation and favor subsequent particle formation processes by condensation. Hence, it facilitates the identification of evidence for aerosols formed by the condensation of oil vapor. The engine oil used was Shell Rimula R6 LME (5W-30) pre-aged for several hours of medium to high power operation.
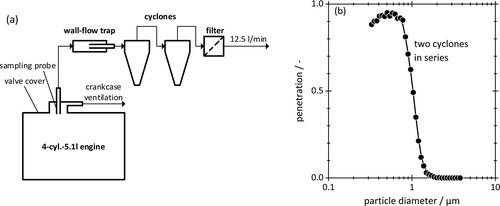
The schematic of shows that a sample flow of 12.5 L/min was extracted from the engine with a sharp-edged probe (8 mm ID) inserted vertically through the top of the valve lid cover at a point where the blow-by flow enters the crankcase ventilation system. Then, the sample flow was guided through a wall flow trap before passing through two identical cyclones (URG-2000-30E-5-2.5-S) to remove particles >1 µm. This was found necessary to avoid flooding the cyclone and obtain a sharp cut off of about 50% at 1 µm (). Finally, the aerosol was collected on a filter consisting of three layers of high-efficiency binder-free glass microfiber (MN 85/90 BF). Filter samples were evaluated visually and by smell and then transferred to the GC in air-tight containers cooled to 4 °C to avoid losing volatile components.
Figure 3. (a) Arrangement for sampling submicron crankcase aerosols from the crankcase of a 4-cylinder 5.1-liter diesel engine. The arrangement consists of a sampling probe, a wall-flow trap, two cyclones, and a filter to collect the aerosol. (b) Particle penetration through two cyclones connected in series. These data were obtained by OPC using a flow rate of 12.5 L/min. The compact line is a 3 point adjacent-average that serves as guide to the eyes.
A gas chromatograph (Shimadzu Nexis 2030) was used to determine the hydrocarbon index of crankcase aerosols as well as oil sampled from the engine sump according to DIN EN ISO 9377-2. This test method detects oil constituents according to their retention time and compares them to the signals of n-alkanes in the range of C7 to C40. Such compositional information is directly related to oil vapor pressure, and thus, helpful in tracing the origin and likely formation process of crankcase aerosols by evaporation-condensation vs. mechanical dispersion of sump oil. For example, at a temperature of 120 °C the vapor pressure of a C17 n-alkane is 105-fold larger than that of C36 (Lemmon and Goodwin 2000). As a result, oil droplets formed by evaporation and recondensation are expected to contain significantly more short-chain constituents than the bulk oil.
2.2. Generation of oil aerosols by evaporation and recondensation in the laboratory
The main purpose of these laboratory experiments was to provide reliable data generated under well-defined conditions for comparison with and validation of simulations described in Subsection 2.4. The aerosol was, therefore, generated under conditions comparable with those found in the crankcase and subsequent ventilation system of combustion engines, without, however, trying to emulate the local engine conditions exactly. Once the simulations are validated under these well-defined conditions, they can be extended to study the influence of more extreme parameters on aerosol formation (such as oil vapor temperatures and cooling rates near engine hot-spots) where direct experiments become difficult.
Condensation aerosol was generated by cooling down a vapor-saturated airflow with or without preexisting particles. The air was saturated either with pure hexadecane or motor oil taken from the engine sump. Hexadecane has the advantage of a well-defined vapor composition (ideal for simulations), while the use of bulk oil bridges the conditions of the engine and the laboratory. In case preexisting particles were needed, they were generated by a two-fluid nozzle (May Citation1973) placed within the heated chamber. The flow was saturated at temperatures between 100 °C and 130 °C, and then, cooled down to 25 °C.
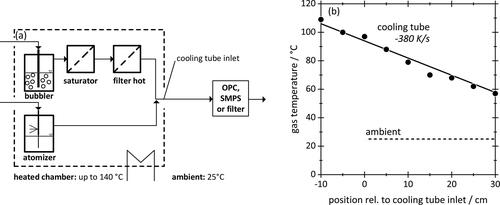
According to the setup shown in an air flow of 5 L/min was saturated in two steps. First, the air passed through a bubbler containing the respective working fluid, in order to obtain a large liquid–air interface and boost mass transport to the gas phase. This vapor laden air stream then passed through a glass microfiber filter pre-loaded with the same liquid, to bring the level of saturation as close to unity as possible. A second, but dry glass fiber filter was installed further downstream to remove droplets that might have penetrated or been re-entrained from the first filter. (Complete saturation at this point was verified as described further down.) This saturated air was then directed out of the heated chamber into a PTFE tube (length 2 m, ID 6 mm) exposed to room temperature, resulting in a temperature profile of the flow as shown in . This temperature profile corresponds to a cooling rate of approximately −380 K/s. At the end of that cooling tube, aerosol was either captured by a filter (three layers of high-efficiency glass microfiber media) for chemical analysis or transferred to an OPC or SMPS for size analysis (see next subsection).
Figure 4. (a) Experimental setup used to saturate, and then, cool down a flow of vapor laden air or aerosol in a tube exposed to an ambient temperature of 25 °C. Aerosol after cool-down is characterized either by SMPS and OPC or captured on a filter for chemical analysis. (b) Gas temperature profile in the cool-down tube relative to tube inlet, here for a heating chamber temperature of 120 °C. The ambient temperature is indicated as a dashed line. The linear fit corresponds to a cooling rate of 380 K/s.
Vapor concentrations were determined by cooling down a saturated air flow of 5 L/min for 150 min and subsequently weighing the condensate accumulated in cooling tube and filter. As an example, engine oil at 120 °C yielded a mass of about 130 mg, with good reproducibility, corresponding to a vapor concentration of about 120 mg/m3. Concentrations did not change measurably even when halving the residence time. Thus, confirming indirectly that the evaporation kinetics sufficed to saturate the air flow under the chosen conditions. This was further confirmed by comparing the experimental values of hexadecane saturated vapor concentrations with the literature (see ).
2.3. Characterization of laboratory generated aerosol particle size distributions
The PSD of oil aerosols was determined by combining a scanning mobility particle sizing system (SMPS) for the submicron portion with an optical particle counter (OPC) for the range from 0.3 µm upward to about 10 µm.
The SMPS system consisted of an 85Kr neutralizer, a DMA (Hauke model “Vienna Long”) and a CPC (TSI Model 3775). The SMPS sorts the aerosol on the basis of electrical mobility into 64 size bins per decade of logarithmically equal width. A scanning time of 180 s was used, with a sheath-air-to-sampling-flow ratio of 35 to 1. The OPC (Palas Promo 2000 H with Welas 2070 HP sensor) sorts particles on the basis of scattered light intensity into 32 size bins per decade of logarithmically equal width. The OPC was operated with the built-in calibration for paraffin oil. Paraffin has a refractive index similar to hexadecane (1.47 vs. 1.43) and almost identical to engine oil. Aerosol sampling and dilution techniques as well as precautions used to avoid soiling of the measurement devices are described by Nowak et al. (Citation2020).
2.4. Numerical simulation of new aerosol formation and growth from the vapor phase
Simultaneous nucleation and growth by condensation in the cooling tube were simulated with a one-dimensional model based in part on equations proposed by Winkelmann et al. (Citation2014). Their method calculates new particle formation from classical nucleation theory including the necessary mass and energy balances between carrier gas, vapor and droplets. In its original formulation, the nucleating vapor is assumed to form a single size fractionFootnote1 of monodisperse droplets and is, therefore, computationally quite efficient. The original model was extended and modified in several aspects to better represent our physical system while still remaining computationally efficient.
An external temperature profile () along the cooling tube (with corresponding spatial and time coordinates) is imposed on the gas temperature () which is assumed to be the global temperature for all phases. Energy balances and the heat of condensation are, thus, omitted for computational reasons. This simplification is known to overestimate the speed of particle growth (Hienola, Kulmala, and Laaksonen Citation2001) especially for very small droplets, but still describes general system behavior sufficiently well for our purposes.
As implemented in MATLAB, each population of droplets formed during a given time step, either by nucleation of by injection at t = 0, is maintained as an independent population and grows independently of the others for the remainder of the iteration process. This in effect creates a “true” size distribution width for the nucleation peak (as opposed to an arbitrary assumption made in the Winkelmann Model) and allows also for the existence of a multimodal PSD required in case of preexisting condensation nuclei. The model implementation furthermore allows for vapor losses to macroscopic surfaces along the cooling tube, which are considerable. These losses are determined experimentally as described in Subsection 3.2, and then, distributed linearly along the cooling tube.
The model is based on an oil mass balance computed for each time step for the net mass flow rate from the vapor to the liquid phase, which consists of the vapor mass consumed by nucleation,
minus or plus the vapor mass transferred from or to particles by evaporation or condensation,
plus the vapor condensing to the walls of the system,
(1)
(1)
Obviously, these rates scale with the size of the system, and thus, always refer to a reference volume of
The nucleation mass flow rate depends on the nuclei size the nucleation rate
and the density of the liquid phase
with the common assumption of “twice the critical cluster” mass for
The nucleation rate is taken either to equal zero (in case of
) or, in case of a supersaturated vapor, is calculated following Friedlander (Citation1977), so that
(2)
(2)
with
(3)
(3)
and for a supersaturated vapor (
) that exceeds a pre-defined threshold
= 107 m−3s−1
(4)
(4)
The saturation is given by
(5)
(5)
with
designating the vapor mass fraction at equilibrium vapor pressure,
Transition to dimensioned variables requires the introduction of the total density
equal to the ratio of total mass to total system volume.
The condensation or evaporation mass flow of each particle size class is calculated according to a balance of the vapor and the liquid phase:
(6)
(6)
Therein represents the droplet diameter calculated from the liquid mass and
is the binary diffusion coefficient of oil in air. The dimensionless mass inside the system boundaries consists of a liquid mass fraction in the form of droplets
plus the mass fractions of vapor
and air (
). While
remains unaffected, condensation or evaporation lead to a mass transfer between liquid and vapor phase and consequently to changes in vapor and liquid mass fractions with time.
Vapor losses to macroscopic surfaces, especially along the walls of the cooling tube, are significant. The total vapor loss from beginning to end of the tube is known experimentally from the difference between equilibrium vapor concentration and total aerosol mass. But the variation of these losses along the tube, i.e., over time, is not known and challenging to model accurately. For simplicity sake it was, therefore, assumed that losses scale linearly with ( with a constant dimensionless factor of W:
(7)
(7)
Based upon the above considerations, the following set of differential equations was derived for the mass balances of vapor and liquid droplets in the system:
(8)
(8)
Note that the overall number of droplets only changes according to the nucleation rate. Aerosol loss mechanisms such as coagulation or diffusion to the walls are neglected in the model, because overall residence times in the cooling tube are too short to be relevant.
The numerical stability of the system was ensured by reducing the duration of the time steps to a level where a further reduction only had a negligible effect on the results. In practice, subdividing the cooling process into time steps with a length of 0.3 ms each was sufficient.
The computational procedure is as follows:
Each time step begins by calculating one global temperature (gas, vapor and liquid) according to a given cool-down ramp.
Then,
is calculated according to EquationEquation (4)
When
All nuclei formed during that time step are placed into one size class with diameter
Once
Preexisting droplets are considered a separate size class undergoing the same condensation growth routine.
Finally, all droplet populations are sorted into pre-determined size intervals to obtain a PSD. Size classes were typically chosen to resemble those of a given measurement, i.e., with equal interval width on the logarithmic scale.
3. Results and discussion
3.1. Evidence of aerosol formation by vapor condensation in a crankcase environment
Engine oils are a complex blend of base oils and additives, often consisting of more than 100 different chemical compounds with greatly differing vapor pressures. In a hot engine environment this must lead to significant differences in the composition of the liquid vs. the gaseous oil phases. Uy et al. (Citation2016) had already noticed from GC measurements, that engine oil mist separators removed some higher-boiling, larger molecules from the blow-by aerosol. More generally, particles formed by condensation of engine oil vapor should have a chemical composition resembling more closely that of the vapor phase, i.e., with a significantly higher fraction of volatiles than the bulk oil. This chemical fingerprint allows a qualitative identification of any contribution of condensation to crankcase aerosol formation.
compares the GC spectra of three oil samples, submicron aerosol emitted from the crankcase of the medium-duty diesel engine (red), submicron motor oil aerosol generated in the lab by evaporation-condensation (blue), as well as a sample of bulk sump oil (black) from the engine. Note that the oil had been “broken in” by engine operation for several hours as described in the experimental section. The spectra are represented as mass fraction vs. equivalent n-alkane chain length and normalized for unit area.
Figure 5. GC spectra of sump oil, aerosol generated from sump oil by evaporation-condensation in the lab, and crankcase aerosol from the fired engine.
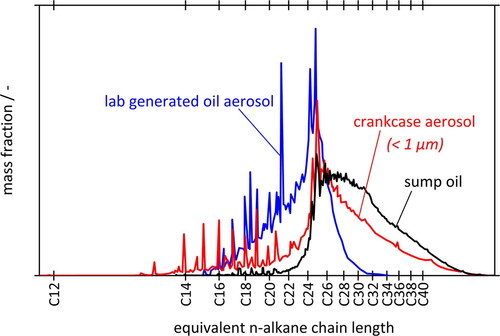
According to , the sump oil contains components with retention times corresponding to the range of C14 to beyond C40 with a broad maximum between C25 and C30. The same sump oil was used in the laboratory to generate droplets by cooling down the saturated oil vapor flow from 130 °C to 25 °C. The composition of these droplets differs significantly from that of the sump oil, in that they contain a much larger fraction of volatile components up to about C25 while the content of heavier components above C30 is negligible. This enrichment is presumably due to a fractionation process.
The third GC spectrum (red curve) is for actual submicron crankcase aerosol sampled from the diesel engine at nominal power using the same bulk oil as for the other spectra. It lies between those of the lab-generated pure condensation aerosol and the sump oil. There is still a noticeable enrichment of short-chained components in the crankcase aerosol when compared to the bulk, but not as pronounced as for the pure condensation aerosol. Both the crankcase aerosol and the lab-generated aerosol were clear in visual appearance, and both had a more aggressive smell than the much darker sump oil. However, the peaks C14 to C16 (amounting to 5% of the total sample mass) are over-represented in comparison to the other two spectra, indicating the likelihood of some carry-over of diesel fuel via the piston rings.
Vapor condensation appears to make a significant contribution to the submicron crankcase aerosol. However, these data do not tell us whether the crankcase aerosol represents an external or an internal mixture. In other words, the aerosol may consist of separate fractions of homogeneously nucleated and mechanically redispersed bulk oil; or it may have been formed entirely by vapor condensation onto redispersed (perhaps partially evaporated) droplets. This raises the question whether homogeneous nucleation can play a significant role in the crankcase, perhaps under extreme conditions near hotspots and under typical cooling rates.
The other question is, how a few mass percent of diesel fuel in the crankcase might alter the overall processes of condensation and nucleation. If fuel enters the crankcase as a spray of fine droplets, these droplets will add to the preexisting aerosol population. If the fuel is present as short-chained vapor, this will increase the overall concentration of condensables. Both these issues are covered by the experiments and simulations described in the following. A third issue concerns the influence of a few percent of shorter-chain molecules on the simulations, via the average mass diffusion coefficient and the surface tension. The latter will also be addressed.
3.2. Aerosol formation by nucleation and growth of hexadecane and engine oil vapor
3.2.1. Equilibrium vapor concentrations
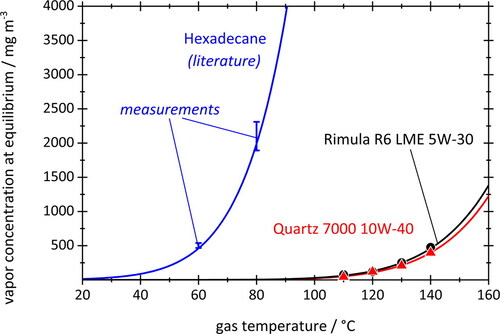
Aerosol formation and/or growth by condensation requires vapor concentrations above the thermodynamic equilibrium. Equilibrium vapor concentration data are shown in for hexadecane (in blue) and for two engine oils, Rimula R6 (in black) and Quartz 7000 (in red). The experimental data points were determined using the cold trap setup described in Subsection 2.1. For hexadecane, the error bars represent ± one standard deviation for 3 measurements each, while the blue curve is based on readily available literature data (Lemmon and Goodwin Citation2000). Agreement is very good for hexadecane, and this validates our experimental technique sufficiently to apply it also to engine oils for which vapor data can generally not be found in the open literature. For engine oil, an exponential function (solid curves) was fitted to the data points to estimate concentrations at intermediate temperatures as required for the simulations. Hexadecane has a shorter chain structure and a lower molar mass of 226 g/mol compared to the oils (∼354 g/mol for Quartz 7000 and 381 g/mol for Rimula R6). Hence, the motor oils require higher temperatures (about 80 °C higher) to reach comparable vapor concentrations.
Figure 6. Equilibrium vapor concentrations for hexadecane and two engine oils. Data points are based on measurements according to Subsection 2.1. Error bars for hexadecane represent the standard deviations of three measurements each. Solid curve for hexadecane from Lemmon and Goodwin (2000); solid curves for engine oils are exponential fit functions.
3.2.2. Nucleation
gives an overview of the nucleation experiments and includes information on vapor properties that were used for the simulations. Subsection 2.2 describes the actual experimental setup used for these experiments while Subsection 2.3 introduces the numerical simulation. The diffusion coefficient for vapor in air was obtained according to Poling, Prausnitz, and O'Connell (Citation2001), the surface tension of droplets was calculated according to Tolman (Citation1949). A density of 773 kg/m3 was used for hexadecane and 874 kg/m3 for engine oil to convert between aerosol number and mass. The cooling rate was taken according to actual experimental conditions as −380 K/s (see ). Vapor losses were derived from the experimental data from the difference in measured aerosol mass concentration (obtained by SMPS or OPC) and vapor mass concentration at equilibrium (see ).
Table 1. Conditions for cool-down experiments without preexisting particles and vapor data used for simulation.
The following figures show number-based PSDs for aerosols formed by cooling down the particle-free vapors of hexadecane () and Quartz 7000 oil () to 25 °C from saturation temperatures between 100 °C and 130 °C. Numerical results are in black, measurements by OPC in blue. Note that the numerical data were calculated using the same particle size classes as for the measurements. Total number concentrations are included to give an impression of actual concentrations obtained.
Figure 7. Number-based PSDs obtained by cooling down saturated particle-free hexadecane vapor from 100 °C (a) or 110 °C (b) to 25 °C. Concentrations stated at STP. OPC measurements (blue/circles) and numerical simulation (black/triangles) use the same size classes (32 logarithmically equal bins per decade).
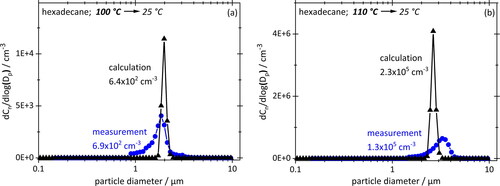
Figure 8. Number based PSDs obtained by cooling down saturated particle-free engine oil vapor from 120 °C (a) or 130 °C (b) to 25 °C. Concentrations stated at STP. SMPS measurements (blue/circles) and numerical simulation (black/triangles) use the same size classes (64 logarithmically equal bins per decade).
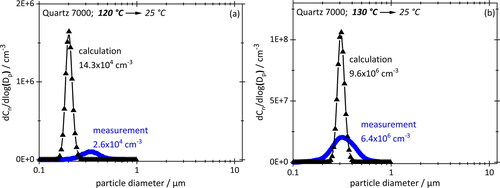
Two features are immediately apparent in and : the numerical PSDs are narrower than the experimental PSDs, but the modal values agree remarkably well. The difference in width is hardly surprising, given that the real system is not as perfectly uniform in terms of flows, temperature, vapor distributions, etc. as the simulated one. However, the overall agreement of simulated and measured size spectra confirms the relevance of homogenous nucleation in the absence of a preexisting aerosol.
Given the difference in equilibrium vapor concentrations between the two working fluids (), droplet sizes as well as concentrations in case of hexadecane are significantly higher than for engine oil, even though the starting temperature of hexadecane is lower. Modal diameters are about one order of magnitude higher; concentrations also when comparing them on a mass basis for 110 °C hexadecane (1760 mg/m3) and 130 °C engine oil (130 mg/m3).
Conversely, the increase in total aerosol concentration from the lower to the higher starting temperature (for the same working fluid) is too drastic to be justified by simple thermodynamic arguments. In case of hexadecane, the concentration jumps from 2 mg/m3 at 100 °C to 1760 mg/m3 at 110 °C. That is far more than then exponential characteristic of the vapor concentration curve would suggest, namely from 10,600 mg/m3 to 19,000 mg/m3, an 80% increase. For motor oil the increase in mass concentration by a factor of 240 is similarly strong.
Such a jump can only be explained by the kinetics of vapor transport onto system walls during cool-down. The fraction of vapor lost to the walls is by no means constant or even linear with starting temperature. For hexadecane at 100 °C and 110 °C losses amount to a staggering 99.98% and 90.72%, respectively. Yet, nucleation still occurs at these temperatures, while experiments below 100 °C produced no measurable aerosol is at all because too much vapor was lost.
The observed decrease in vapor loss fractions with increasing vapor concentration is reasonable. Similar issues have been observed and simulated in the laminar cooling section of condensation particle counters, where vapor is depleted radially inward at a rate that depends on the vapor diffusion coefficient (as well as the concentration of particles), while the build-up of supersaturation near the core is driven also by the inward cooling rate, and hence, the thermal conductivity of the carrier fluid. For our system the dependence on cooling rate, a key factor, will be discussed in the next section. Beyond that, the wall loss issue will not be pursued further because no new understanding could be gained regarding the processes in a crankcase.
3.2.3. Effects of preexisting particles on nucleation
The crankcase environment is characterized not only by large amounts of hydrocarbon vapor but also preexisting airborne particles in significantly varying concentration. These particles consume vapor during cool-down and thereby slow down the build-up of supersaturation, leading to delays or even prevent nucleation. The effect of such condensation nuclei in a crankcase environment is largely unknown and we have no good feeling for their influence on nucleation.
Numerical simulations were, therefore, conducted at first to understand the sensitivity of the crankcase system to nuclei concentration N0 and size d0, and then, compared to a few cool-down experiments using parameters and techniques described earlier. The simulation is based on initial nuclei sizes of 30 nm, which corresponds to a typical crankcase aerosol mode (cf. introduction), as well as 200 nm. The motor oil temperature was chosen at the high end of our range to account for the existence of hotspots typical for an engine at high loads. presents PSDs based on number (a) and mass (b) calculated for three different starting concentrations N0 between 0.2 and 3 × 106 cm−3 and d0 = 30 nm, which is realistic for a crankcase. For better readability, each PSD is split into a red portion that represents the nucleation mode and a blue portion representing the growth of preexisting nuclei.
Figure 9. Simulated PSDs based (a) on number and (b) on mass for three different initial nuclei concentrations with d0 = 30 nm. The nucleation part of the PSD shown in red (triangles), the preexisting nuclei in blue (diamonds).
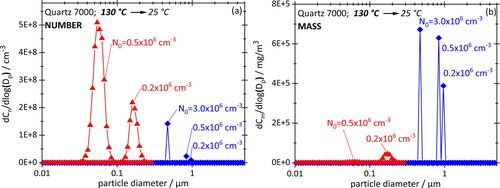
In note first of all that condensation nuclei always grow far beyond their initial size, to between about 500 nm and 900 nm, becoming smaller of course with increasing nuclei concentration because the vapor supply remains constant. The nucleation peak for N0 = 0.2 × 10⁻⁶ cm−3 appears around 200 nm and then also moves toward smaller sizes for higher N0 while the peak height increases, and then, disappears abruptly around 0.5 × 10⁻⁶. (Not shown in the graphs.) That behavior of the nucleation peak can be explained by a delay in the onset of nucleation in the presence of nuclei. Vapor is at first depleted (because the nuclei begin to grow much sooner) but not enough to prevent the development of a rather high supersaturation further down the line. The higher the supersaturation at the moment of nucleation on-set, the smaller and more copious the droplets. (This will become clearer in the following section when the effect of the cooling rate is explored.) Simulations were also performed using larger nuclei with d0 = 200 nm. The PSDs were practically indistinguishable in terms of peaks heights and location of peaks from those with d0 = 30 nm. They are, therefore, not shown here.
Needless to say, the nucleation peaks “disappear” visually when presenting these PSD in terms of particle mass (), thereby illustrating the problem with comparing crankcase aerosol data between publications.
Nucleation experiments in the presence of condensation nuclei were performed with motor oil (), using the same parameters as for and but in a much more limited range, due to experimental constraints. The initial size of the condensation nuclei was <600 nm. These data also show a nucleation peak at 300 nm for N0 = 0.2 × 10⁻⁶ cm−3. (The actual peak location is probably closer to 200 nm, but this is no longer resolved by the OPC.) However, the peak disappears almost completely when increasing N0 to 0.3 × 10⁻⁶ cm−3. The experiment is, thus, more sensitive to variations of N0 than the simulations, but this is not entirely surprising.
Figure 10. Measured PSDs for two concentrations N0 of preexisting aerosol with d0 < 600 nm. Other parameters are the same as for .
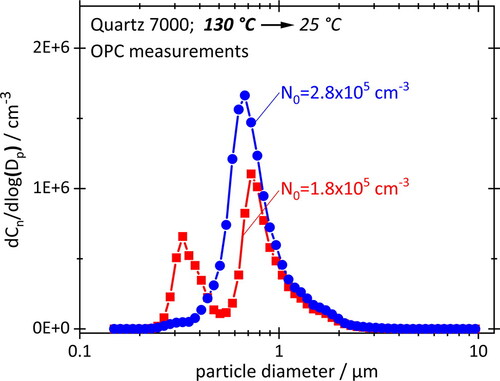
Although not fully representative of the crankcase environment, the experiment nevertheless confirms that nucleation is possible at high vapor concentrations and significant cooling rates, even in the presence of considerable number concentrations of preexisting aerosol.
3.3. Influence of cooling rate and oil properties on aerosol generation
The influence of cooling rate and oil properties (surface tension, vapor pressure) on nucleation and growth of aerosol from engine vapor are discussed on the basis of simulations using the model already introduced earlier. For simplicity and comparability, it was assumed that only vapor but no particles were present before cool-down. Vapor losses to system walls were set to zero.
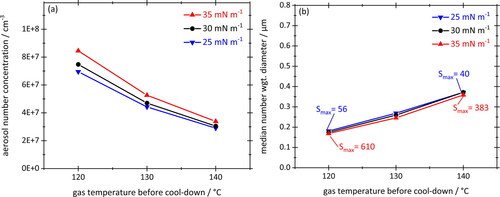
shows the influence of cooling rate on aerosol number concentration (a) and number-weighted median particle diameter (b) for starting temperatures of 120 °C, 130 °C and 140 °C equilibrium vapor concentrations of the engine oil (Quartz 7000 10W-40) at the respective temperatures and peak supersaturations at the respective cooling rates have also been added. Calculations are based on an oil surface tension of 30 mN/m. Note that the intermediate cooling rate of −380 K/s (black curve) corresponds to the conditions during the lab experiments and is our reference. The other two cooling rates were chosen as, respectively, 4x higher and lower than the reference rate.
Figure 11. Total aerosol number concentrations (a) and number-weighted median particle diameters (b) plotted against gas temperature before cool-down at three different cooling rates. Equilibrium vapor concentrations and peak saturations during cool-down are added. Simulated for Quartz 7000 10W-40 with a surface tension of 30 mN/m. Lines connecting data points serve as a guide to the eye.
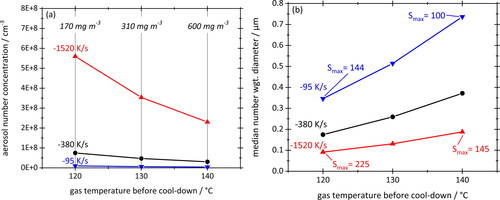
The two graphs of show, not surprisingly, that higher cooling rates produce more and smaller particles. Considering the linear concentration scale, the number concentration increases about 50-fold (in case of the 120 °C experiments) from about 1 × 107 cm−3 at −95 K/s to about 56 × 107 cm−3 at −1520 K/s, while the mean particle size drops by a factor of about 3.5. This general behavior is due to the increase in theoretical peak saturation with cooling rate, e.g., from S = 100 at −95 K/s to S = 145 at −1520 K/s for a starting temperature of 140 °C. According to classical theory the nucleation kinetics speed up considerably when increasing the supersaturation (e.g., Hinds Citation1999), thereby converting more of the vapor mass to particles while leaving less vapor for subsequent condensation and growth.
also shows that raising the initial equilibrium vapor concentration (i.e., the starting temperature) at constant cooling rate produces larger but fewer particles. This is due to a boost in vapor consumption by condensation onto newly formed particles which reduces the peak supersaturation, and hence, the nucleation rate. Note, however, that aerosol mass concentrations are determined solely by the equilibrium vapor concentration which is only a function of temperature (see ).
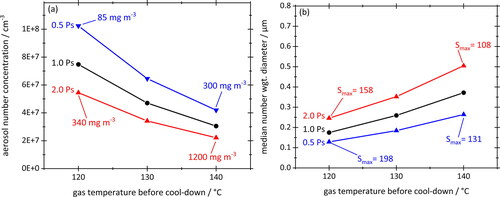
The effect of the initial vapor concentration on aerosol number concentrations and number-weighted median particle diameters is further illustrated by . Oil type (Total Quarz 7000 10W-40, surface tension 30 mN/m) and cooling rate (–380 K/s) remain unchanged in relation to the previous graphs. Hence, the black curves are based on the same reference values as before. The red and blue curves, denoted as 2Ps and 0.5Ps, respectively, represent calculations for twice and half the saturation vapor pressure of the oil. The trends seen in reinforce the findings already derived from : Regardless of whether the initial saturation vapor concentration is increased via a higher temperature or via a (hypothetical) oil with larger volatile content, the effect on aerosol number concentrations and particle diameters is always the same, namely a decrease of the former and an increase of the latter.
Figure 12. Total aerosol number concentrations (a) and number-weighted median particle diameters (b) plotted against gas temperature before cool-down. For each starting temperature, equilibrium vapor concentrations are scaled by factors of 0.5 (blue) and 2.0 (red) relative to the black reference curve. Actual vapor concentrations and peak saturations during cool-down have been added. Surface tension of 30 mN/m and cooling rate of –380 K/s remain unchanged. Straight lines connecting data points as a guide to the eye.
Finally, the role of the surface tension in the context of nucleating oil vapor is investigated in , again using the same graphical representation as before. Simulations were performed for three different surface tensions, namely 25 mN/m (blue), 30 mN/m (black) and 35 mN/m (red). These values bracket the variability of this parameter more than sufficiently, because the surface tension of oils varies little in general. The data are again based on cooling rates of −380 K/s and vapor concentrations corresponding to Quartz 7000 oil. For some data points the peak saturation value was added for information.
Figure 13. Total aerosol number concentrations (a) and number-weighted median particle diameters (b) plotted against the gas temperature before cool-down for three different values of surface tension. Cooling rate –380 K/s, equilibrium vapor concentration corresponding to Total Quartz 7000 10W-40. Straight lines connecting data points are a guide to the eye.
indicates that the surface tension has a minor impact on aerosol formation when cooling down saturated oil vapor. This was unexpected as classical nucleation theory suggests a major negative influence of surface tension on nucleation rates (see EquationEquation (4)(4)
(4) ). The simulations have shown however, that higher surface tensions also delay the start of nucleation during cool-down, thus, permitting the build-up of higher peak saturations before the on-set of particle formation. (In our simulation, the delay was from about 14 ms to 20 ms, leading to an increase in S from 40 to 383!) Ultimately both factors seem to neutralize each other resulting in similar aerosol nucleation rates, number concentrations and diameters after cool-down.
4. Summary and conclusions
The roles of nucleation and growth by oil vapor condensation (with and without preexisting nuclei) during the formation of submicron crankcase aerosols were investigated both experimentally and by simulation under engine-like conditions using actual engine oil as well as hexadecane.
The chemical composition of the submicron crankcase aerosol fraction from a commercial 4-cylinder 5.1-liter diesel engine, analyzed by GC, suggests vapor-to-particle conversion mechanisms are likely to play a role in its formation. GC spectra of the submicron aerosol had a significantly higher volatile hydrocarbon content (≤C25) than the bulk engine oil (up to C40).
Experimentally, air-vapor mixtures were saturated between 100 °C and 130 °C (equivalent to vapor concentrations between 0.2 g/m3 and 20 g/m3) and then cooled down at a defined rate to near ambient, with and without preexisting submicron oil droplets. Aerosols were characterized by OPC and SMPS. For engine oil, and in the absence of nuclei, nucleation peaks appeared near 300 nm in number concentrations that decreased with vapor supply and vanished completely below 100 °C due to vapor losses onto cooling tube walls. Addition of nuclei in concentrations above about 2 × 105 cm−3 quickly suppressed spontaneous aerosol formation. This confirms observations on fired engines that the submicron blow-by aerosol concentration is very sensitive to bulk oil temperature.
Separately, nucleation and growth were simulated numerically in MATLAB with a one-dimensional model based on classical nucleation theory in combination with mass transfer between liquid and vapor phase. Model equations are based on Winkelmann et al. (Citation2014) with computationally efficient extensions to allow for progressive cooling and vapor loss to tube walls as well as preexisting nuclei. Simulations were validated first against the hexadecane experiments, and then used to study the effects of cooling rate, vapor concentration, nuclei concentration and oil surface tension in parameter ranges difficult to reach experimentally. Equilibrium vapor data for hexadecane were taken from the literature; for actual motor oil they were measured in the temperature range of interest.
Simulations agreed well with homogenous nucleation experiments in the absence of nuclei, especially with regard to peak location. Increasing the equilibrium saturation level for a given temperature (equivalent to using a more volatile oil) shifts nucleation toward fewer but larger droplets. This is consistent with measurements on hexadecane vs. motor oil. Upon addition of increasing nuclei concentrations upward of 0.2 × 106 cm−3, nucleation peaks gradually increased in height while diminishing in asymptotic droplet size from about 200 nm to 40 nm, then, vanished completely beyond about 1 × 106 cm−3 in favor of purely condensational growth of preexisting nuclei. Growth of nuclei was less sensitive to vapor concentration, with asymptotic sizes between about 500 nm to 900 nm. Increasing the oil surface tension from 25 to 35 mN/m had almost no effect on nucleation rates, because the delayed start of nucleation due to an increased surface energy barrier was compensated by a large increase in supersaturation during cool-down.
In sum, experiments and simulation confirm the important contribution of both nucleation and condensational growth of preexisting aerosols to the submicron crankcase aerosol spectrum. The nucleation peak can be expected to lie between about 100 nm and 300 nm, while condensational growth of preexisting nuclei is usually completed between 500 nm and 900 nm. The two mechanisms, thus, appear to form distinct peaks which agree remarkably well in their respective size ranges with peaks found in the literature on crankcase aerosols.
The temporal evolution of supersaturation that goes hand in hand with vapor depletion by condensation onto preexisting nuclei as well as macroscopic surfaces during the cooling process, a characteristic of any engine environment, is key to understanding the role of nucleation for crankcase aerosol.
Applied to practical reduction strategies, it appears obvious that lower bulk oil temperatures and fewer engine hotspots have a key role to play in reducing the aerosol mass output from the crankcase. The role of less volatile engine oils, although intuitively desirable, is less straightforward because a higher vapor pressure (at otherwise constant temperatures) leads to the formation of fewer but larger droplets by nucleation and to more growth of preexisting aerosols. And larger droplets are the easier to remove by most abatement devices. Finally, the results suggest that lower cooling rates (although difficult to control in engine design) would be equally beneficial for the same reasons.
| Nomenclature | ||
| Roman | = | |
| = | droplet diameter ( | |
| = | nucleus diameter ( | |
| = | binary diffusion coefficient of oil in air | |
| = | nucleation rate | |
| = | Boltzmann constant ( | |
| = | molecular mass ( | |
| = | Mass flow rate of condensation minus evaporation ( | |
| = | net mass flow rate from vapor to liquid phase ( | |
| = | mass flow rate of nucleating oil vapor ( | |
| = | number concentration of droplets | |
| = | vapor pressure | |
| = | vapor pressure at equilibrium ( | |
| = | saturation | |
| = | gas phase temperature | |
| = | liquid phase temperature | |
| W | = | vapor loss scaling factor |
| = | mass fraction of air | |
| = | mass fraction of liquid | |
| = | mass fraction of vapor | |
| = | mass fraction of vapor at equilibrium | |
| Greek | = | |
| = | density of liquid phase | |
| = | total density | |
| = | surface tension of droplet ( | |
Additional information
Funding
Notes
1 The Winkelmann model actually uses a log-normal output size distribution, but with pre-defined geometric standard deviation, and therefore, in effect, generates a single size fraction.
References
- Agarwal, A. K., S. K. Goyal, and D. K. Srivastava. 2011. Time resolved numerical modeling of oil jet cooling of a medium duty diesel engine piston. Int. Commun. Heat Mass Transfer 38:1080–5. doi: 10.1016/j.icheatmasstransfer.2011.05.006.
- Becker, R., and W. Döring. 1935. Kinetische Behandlung der Keimbildung in übersättigten Dämpfen. Ann. Phys. 416 (8):719–52. doi: 10.1002/andp.19354160806.
- Burtscher, H. 2005. Physical characterization of particulate emissions from diesel engines. A review. J. Aerosol Sci. 36 (7):896–932. doi: 10.1016/j.jaerosci.2004.12.001.
- Ehteram, M. A., H. B. Tabrizi, G. Ahmadi, M. Safari, and M. A. Mirsalim. 2013. Investigation of fine droplet generation from hot engine oil by impinging gas jets onto liquid surface. J. Aerosol Sci. 65:49–57. doi: 10.1016/j.jaerosci.2013.07.004.
- Fan, J., Y. Wang, D. Rosenfeld, and X. Liu. 2016. Review of aerosol-cloud interactions: Mechanisms, significance and challenges. Journal of the Atmospheric Sciences 73 (11):4221–52. doi: 10.1175/JAS-D-16-0037.1.
- Friedlander, S. K. 1977. Smoke, dust and haze. New York: Wiley.
- Golkarfard, V., R. Subramaniam, J. Broughton, A. King, and B. Mullins. 2018. Comparative performance of 12 crankcase oil mist separators. SAE Int. J. Engines 12 (1):5–14. doi: 10.4271/03-12-01-0001.
- Harris, S. J., and M. M. Maricq. 2001. Signature size distributions for diesel and gasoline engine exhaust particulate matter. J. Aerosol Sci. 32 (6):749–64. doi: 10.1016/S0021-8502(00)00111-7.
- Hienola, J., M. Kulmala, and A. Laaksonen. 2001. Condensation and evaporation of water vapor in mixed aerosols of liquid droplets and ice: Numerical comparison of growth rate expressions. J. Aerosol Sci. 32 (3):351–74. doi: 10.1016/S0021-8502(00)00085-9.
- Hinds, W. C. 1999. Aerosol technology. In Properties, behavior, and measurement of airborne particles. 2nd ed. New York: Wiley.
- Johnson, B. T. 2012. Experimental analysis of crankcase oil aerosol generation and control. Doctoral Thesis, Loughborough University. https://hdl.handle.net/2134/10968.
- Johnson, B., G. Hargrave, B. Reid, and V. J. Page. 2011. Crankcase sampling of PM from a fired and motored compression ignition engine. SAE Int. J. Engines 4 (2):2498–509. doi: 10.4271/2011-24-0209
- Kissner, G., and S. Ruppel. 2009. Highly efficient oil separation systems for crankcase ventilation. SAE Technical Paper 2009-01-0974. doi: 10.4271/2009-01-0974.
- Kittelson, D. B. 1998. Engines and nanoparticles. J. Aerosol Sci. 29 (5–6):575–88. doi: 10.1016/S0021-8502(97)10037-4.
- Kreidenweis, S. M., M. Petters, and U. Lohmann. 2019. 100 years of progress in cloud physics, aerosols, and aerosol chemistry research. Meteorological Monographs 59:11.1–.72. doi: 10.1175/AMSMONOGRAPHS-D-18-0024.1.
- Lakshmanan, M., V. Maddali, R. Natrajan, R. Muthyam, and N. Balasubramanian. 2019. Insight into effect of blow-by oil mist deposits on turbocharger performance deterioration in a diesel engine. SAE Technical Paper 2019-26-0340. doi: 10.4271/2019-26-0340.
- Lemmon, E. W., and A. R. Goodwin. 2000. Critical properties and vapor pressure equation for alkanes CnH2n + 2: Normal alkanes with {less then or equal to}36 and isomers for n = 4 through n = 9. J. Phys. Chem. Ref. Data 29 (1):1–39. doi: 10.1063/1.556054.
- Lorenz, M., T. Koch, G. Kasper, J. Pfeil, and N. Nowak. 2020. Origin and Separation of Submicron Oil Aerosol Particles in the Blow-by of a Heavy-Duty Diesel Engine. SAE Int. J. Eng. 13:363–75.
- Maricq, M. M. 2007. Chemical characterization of particulate emissions from diesel engines: A review. J. Aerosol Sci. 38:1079–118.
- May, K. 1973. The Collison nebulizer: Description, performance and application. J. Aerosol Sci. 4 (3):235–43. doi: 10.1016/0021-8502(73)90006-2.
- Nowak, N., K. Scheiber, J. Pfeil, J. Meyer, A. Dittler, T. Koch, and G. Kasper. 2020. Sampling and conditioning of engine blow-by aerosols for representative measurements by optical particle counters. J. Aerosol Sci. 148:105612. doi: 10.1016/j.jaerosci.2020.105612.
- Poling, B. E., J. M. Prausnitz, and J. P. O'Connell. 2001. The properties of gases and liquids. 5th ed. New York: McGraw-Hill.
- Sagot, B., A. Forthomme, M. Wojda, and G. De La Bourdonnaye. 2014. Tuning of an oil mist generator for the performance evaluation of oil separators used in blow-by applications. Proceedings of the 1st European Conference on Fluid-Particle Separation, Lyon, France.
- Sauter, H. 2004. Analysen und Lösungsansätze für die Entwicklung von innovativen Kurbelgehäuseentlüftungen. Berlin: Logos-Verlag.
- Scheiber, K. M., N. Nowak, M. L. Lorenz, J. Pfeil, T. Koch, and G. Kasper. 2021. Comparison of four diesel engines with regard to blow-by aerosol properties as a basis for reduction strategies based on engine design and operation, Automot. Engine Technol. 6:79–90. doi: 10.1007/s41104-021-00075-4.
- Tatli, E., and N. N. Clark. 2008. Crankcase particulate emissions from diesel engines. SAE Int. J. Fuels Lubr. 1 (1):1334–44. doi: 10.4271/2008-01-1751.
- Tolman, R. C. 1949. The effect of droplet size on surface tension. J. Chem. Phys. 17 (3):333–7. doi: 10.1063/1.1747247.
- Uy, D., J. Storey, C. S. Sluder, T. Barone, S. Lewis, and M. Jagner. 2016. Effects of oil formulation, oil separator, and engine speed and load on the particle size, chemistry, and morphology of diesel crankcase aerosols. SAE Int. J. Fuels Lubr. 9 (1):224–38. doi: 10.4271/2016-01-0897.
- Winkelmann, C., M. Nordlund, A. K. Kuczaj, S. Stolz, and B. J. Geurts. 2014. Efficient second-order time integration for single-species aerosol formation and evolution. Int. J. Numer. Meth. Fluids 74 (5):313–34. doi: 10.1002/fld.3851.
- Wurster, S., J. Meyer, and G. Kasper. 2017. On the relationship of drop entrainment with bubble formation rates in oil mist filters. J. Sep. Purif. Technol. 179:542–9. doi: 10.1016/j.seppur.2017.02.036.