
Abstract
In recent years, a growing number of studies investigated the presence of micro- and nanoscopic particles in the environment originating from commonly used plastics. Pathways into the environment and generation mechanisms are still not well understood. Controlled generation methods of particles from macroplastics are required to enable research of the fundamental processes governing the dispersion of these particles in the environment. Here, we present the results of a study focusing on the generation and characterization of aerosol nanoparticles from macroplastics using a tube furnace. Three common thermoplastics were used as particle material: Polyethene (PE), Polypropene (PP) and Polyethylene Terephthalate (PET). Commodity versions of these materials were compared to higher-purity versions. The produced particles were size characterized using a Differential Mobility Particle Sizer. Furthermore, we investigated the activation of particles from PET in Condensation Particle Counters by measuring the 50% cutoff diameters. The results could be directly compared to previous measurements using other organic seed particles. Our study provides crucial insights into the effects governing the production of aerosolized nanoparticles from thermoplastics at comparatively low temperatures. We therefore expect our study to act as basis for further research toward a thorough understanding of the physicochemical processes governing nanoparticle production from plastic materials. Eventually this may lead to new detection methods of nanoplastics in airborne state and allow for quantification of airborne nanoplastic concentrations.
Copyright © 2021 American Association for Aerosol Research
EDITOR:
1. Introduction
Since the introduction of the first synthetic polymer by Leo Baekeland in 1907, plastics have revolutionized our lives (Feldmann Citation2008; Frias and Nash Citation2019). The basis of plastics are organic polymers, which are made of repeating monomer units (Wiesinger, Wang, and Hellweg Citation2021). One of the reasons for the versatility of that class of materials is the option to tune the properties of the polymers by adding chemical agents, commonly known as additives. Different kinds of additives are used for different applications. According to Hahladakis et al. (Citation2018), commonly used polymer additives can be grouped into three categories: functional additives, e.g., flame retardants or slip agents, colorants, like pigments, and reinforcements. The scope of different types of plastics spans from regular commodity plastics, used in cups, clothing and many other everyday items, via technological applications like electrically conductive plastic materials (Gulrez et al. Citation2014) to high precision implants in human eyes (Bozukova et al. Citation2010). With a rising demand for plastics also come rising amounts of plastic waste, which, if not properly handled, can have devastating effects on the environment. Especially in its degraded form as micro- and nanoparticles and fibers, plastics are endangering ecosystems, wildlife and human health (Lehner et al. Citation2019). While environmental plastic pollution has mainly been studied in an aquatic context (Gasperi et al. Citation2018), the atmosphere is also affected, with microplastics being found in atmospheric fallout from cities like Paris, France (Dris et al. Citation2016) or Dongguan, China (Cai et al. Citation2017), as well as in remote areas like the Swiss Alps or the Arctic (Bergmann et al. Citation2019). Recent studies emphasized the importance of atmospheric transport as a pathway of microplastics into remote and sparsely inhabited regions (Allen et al. Citation2019; Evangeliou et al. Citation2020).
To further investigate airborne particles originating from precursor plastics of varying dimensions a clear and distinctive definition of macro-, micro- and nanoplastics should be followed. Based on Frias and Nash (Citation2019) and Velimirovic et al. (Citation2021), nano-, micro- and macroplastics are defined as follows: Nanoplastics refers to plastic particles with a size <1 µm in diameter. Microplastics are plastic particles with diameters between 1 µm and 5 mm. Consequently, plastic particles with diameters >5 mm are referred to as macroplastics.
It has been shown that the concentration of micro- and nanoplastics is linked to harmful effects on ecosystems (Redondo-Hasselerharm et al. Citation2020). Hence, it is crucial to investigate the mechanisms yielding pathways into the environment. This includes the urgent need for measurement techniques capable of detecting and characterizing aerosolized nanoplastics. The first necessary step is to produce nanometer-sized particles from plastics in a reproducible and stable way. Plastic particles were successfully produced by dissolution of Polyethene in toluene (Balakrishnan et al. Citation2019) or by mechanical breakdown of polystyrene products (Ekvall et al. Citation2019). Additionally, 3 D printing has been reported to be a source of nanoparticles from plastic materials (e.g., Mendes et al. Citation2017). Mendes et al. (Citation2017) evaluated the emission from a low-end 3 D printer and detected particles with diameters smaller than 10 nm.
Here, we present the reproducible generation of sub-40 nm aerosol nanoplastics using a tube furnace for the first time. Three different thermoplastics, including commodity versions and higher-purity versions of the same materials, have been investigated and the effects of external parameters on particle generation, e.g., temperature and flow rates, were analyzed. Furthermore, the activation of the produced particles in butanol-based CPCs was characterized by measuring the 50% cutoff diameters.
2. Materials and methods
2.1. Particle materials
Three different types of commonly available thermoplastics were used as starting materials: Polyethene (PE), Polypropene (PP) and Polyethylene Terephthalate (PET). Following the description of Biron (Citation2007), thermoplastics soften when heated and can therefore be easily formed or molded. The selected thermoplastics can be subdivided into two groups: thermoplastics from commodity products and higher-purity thermoplastics, respectively. Low-density PE (LDPE) was harvested from packaging foil, the commodity PP originated from a candy box and the commodity PET was retrieved from a plastic water bottle. All retrieved commodity material was cut into strips (approximately 2.5 cm in length and 0.3 cm in width) or chipped into platelets using a hole puncher. In addition, higher-purity versions of the investigated thermoplastics were bought (Merck KGaA, Darmstadt, Germany). Thermophysical properties of the materials used in the experiments are presented in the supplementary information (SI; Tables S1 and S2). Taking into account the sizes of the pieces of thermoplastics as well as the number of pellets, strips and stripes of the respective materials used in this study, the starting materials for the presented measurements are classified as macroplastics (SI, Table S3). Additionally, it needs to be stated that the higher-purity LDPE and PET pellets were not free of any additives based on the product specifications as stated by the manufacturer. The higher-purity LDPE contained 320–480 ppm of a slip agent, a common additive. The selected higher-purity PET contained 30% of glass as reinforcer. The higher-purity versions of the materials are denoted by “p” throughout the text. Apart from the white PETp pellets, all particle materials used in the experiments were transparent. The particle materials were weighed prior to the measurements using an analytical balance (Mettler Toledo AT201 Analytical Balance, Mettler-Toledo GmbH, Laboratory & Weighing Technologies, Greifensee, Switzerland).
Table 1. Exemplary measurements: the table shows the settings for the set of data presented in .
Table 2. 50% cutoff diameters: The table shows the 50% cutoff diameters (d50) measured for PETp and PET using the TSI 3772 and the Airmodus A20.
2.2. Experimental setup
A schematic of the experimental setup is shown in . Crucibles loaded with the respective materials were placed centrally in the quartz glass-working tube of the tube furnace (Nabertherm R50/250/13, Nabertherm GmbH, Lilienthal, Germany). Compressed, dried and filtered air was used as carrier gas. Consequently, shifts of the detection efficiencies of the CPCs due to the relative humidity of the carrier gas can be excluded (Biskos et al. Citation2006; Tauber et al. Citation2019). By heating the tube furnace the material is vaporized and carried into cooler regions of the furnace (Scheibel and Porstendorfer Citation1983). Particles are formed due to homogeneous nucleation. The set point temperature of the tube furnace was varied between 110 °C and 220 °C. The exact set point temperatures are presented in the next section. The aerosol was then fed into a Liebig-type condenser that was constantly flushed with purified water. A water temperature of 15.0 °C was maintained with a thermostat (Lauda, Model RMS 6, Dr. R. Wobser GmbH & Co KG, Koenigshofen, Germany). Downstream of the tube furnace the aerosol was mixed with a dilution flow of compressed air and fed into a bipolar soft X-ray charger (Advanced Aerosol Neutralizer 3088, TSI Inc., Shoreview, USA) where a steady-state charge distribution was established (Kallinger, Steiner, and Szymanski Citation2012).
Figure 1. Schematic of the experimental setup: A tube furnace was used for particle generation. The aerosol exiting the tube furnace is brought into a stable charging state using a soft X-ray charger and fed into a DMA that is operated in analyzer-mode. The particles are detected using a Faraday Cup Electrometer and a CPC.
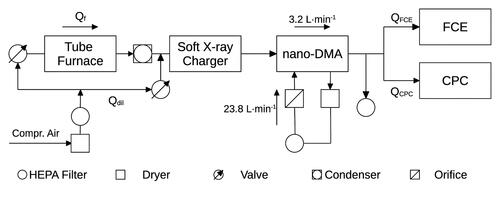
Next, the aerosol entered a Differential Mobility Analyzer (DMA). A custom-made Vienna-type nano-DMA was used for all experiments. The geometrical parameters of the DMA are presented in the SI (Table S4). Further information about the DMA used is presented in Winkler et al. (Citation2008) and Wlasits et al. (Citation2020). Positive voltage was applied to the DMA and negatively charged particles with electrical mobility diameters between 1 nm and 40 nm were selected. Consequently, effects due to multiple charging of particles were neglected (Wiedensohler Citation1988). The voltage was applied to the DMA using a control box (Gruenwald Laboratories GmbH, Taxenbach, Austria). The DMA was operated in scanning mode (2 V to 10,000 V, 97 channels). The sample flow rate through the DMA was 3.2 L·min−1 and a sheath flow rate of 23.8 L·min−1 was maintained. The closed sheath air cycle was composed of a silica gel dryer, a HEPA filter and a critical orifice (). As a result, the sheath air passing through the DMA was free of any particles and dried during all experiments. By assuming perfectly symmetric flow rates and neglecting any effects due to particle diffusion the limiting resolution of the nano-DMA yields 7.44 for the selected flow rates (Flagan Citation1999). The diffusional broadening of the transfer function of a similar nano-DMA for particles with mobility diameters <5 nm was presented by Winkler et al. (Citation2008). According to the presented data the geometric standard deviation of output aerosol consisting of particles with electrical mobility diameters around 3 nm is given by approximately 1.043.
Following size selection, the flow of aerosol was symmetrically split up and fed into a Faraday Cup Electrometer (Aerosol Electrometer Model 3068B, TSI Inc.) and a Condensation Particle Counter. The FCE was mainly used as a backup detector for particle diameters smaller than 5 nm as well as for settings yielding high particle number concentrations (<4·105 cm−3). Measurements of the particle number size distributions were performed using a TSI 3776 UCPC. During these measurements the inlet flow rates of the particle detectors (QFCE and QCPC) were kept at 1.5 L·min−1.
For measurements of the 50% cutoff diameters a TSI 3772 and an Airmodus A20 (Airmodus Oy, Helsinki, Finland) were used. Any excess aerosol flow was fed into the exhaust via another HEPA filter. The inlet of the FCE was adjusted to the inlet flow rate of the CPCs under investigation (1.0 L·min−1).
Prior to any measurement an empty crucible was inserted into the tube furnace and the flow rates were adjusted. As soon as the temperature reading of the tube furnace was stable, one to two particle number size distributions were recorded to check for any particle contamination. If the system was free of particles, particle material was put into the crucible using a forceps and the crucible was reinserted into the preheated furnace. After 30 min. the actual measurement was started. This dwell time is referred to as t0 in all figures. The accuracy of all instruments used in the experiments can be found in the SI (Table S5). Uncertainties of the measured data were analyzed following the rules of Gaussian error propagation.
3. Results
For the sake of readability and easier comparison of the data, uncertainty bars have been excluded from the plots. A table containing the settings for every presented curve can be found in the SI (Table S6).
3.1. Particle number size distributions and stability
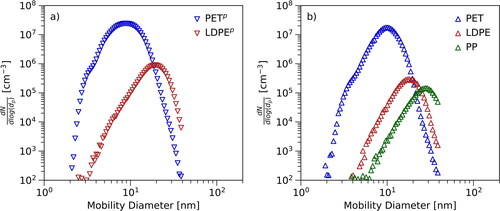
shows one representative particle number size distribution for each of the investigated materials. The particle number size distribution for PPp has been excluded due to the absence of the maximum in the available size range (SI, Figure S1). Any investigated material could be used to generate aerosol nanoparticles at high number concentrations in the size range between 1 and 40 nm. presents the results for PETp and LDPEp and shows data measured using the commodity plastics. Significant differences between the particle number size distributions of the investigated thermoplastics were observed. The curves differ not only in the steepness of the slopes, but also in the position of the maxima and the covered diameter ranges. The diameters corresponding to the onset of the curves at the smaller diameters (d1), the diameters corresponding to the maxima (dmax) as well as settings can be found in . The onset of the curve was defined as the diameter at which the particle number concentration on the increasing slope reached 1% of the maximum concentration. Shifts of the curves due to parameters like set point temperature of the tube furnace need to be considered when interpreting the results (Subsection 3.2). Nonetheless, the smallest particles could be produced using PETp and PET as primary materials and the corresponding maxima were located at the smallest diameters compared to the other materials. The smallest onset diameter could be measured with PETp (2.8 ± 0.4 nm), followed by the onset diameter for PET at approximately 4.5 nm. The largest onset diameter corresponds to PP at about 11 nm. The onset diameters of the higher-purity versions of a material are more similar to the onset diameters of the related commodity version than to any other thermoplastic material.
Figure 2. Set of particle number size distributions: The figure shows a set of representative particle number size distributions for the investigated materials. The exact settings for every distribution are presented in . Panel (a) shows the data measured with PETp and LDPEp. Panel (b) shows the results for PET, LDPE, and PP. The higher-purity materials are marked with “p”.
Furthermore, the stability of the particle number concentrations of the investigated thermoplastics was studied. The measurements revealed that the dwell time t of the particle material inside the tube furnace significantly influences the shape of the related particle number size distribution.
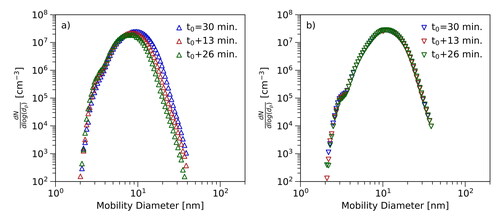
shows selected results for PETp and PET. The curves correspond to different dwell times of the materials in the tube furnace. Based on the selected settings, three cases could be distinguished: The total number of produced particles remained stable, increased or decreased. The total number of produced particles was calculated by integration over the measured particle number size distributions and is referred to as total concentration throughout the text. Depending on the settings, decreasing and increasing size distributions were measured for all particle materials. Stable particle number size distributions in the available size range could be measured using PETp as particle material (). It was found that increasing particle number concentrations were not just connected to a higher maximum concentration, but also to a broadening of the particle number size distribution. The opposite effect was observed for decreasing particle concentrations. The distributions became narrower along the decrease of the maximum concentration. However, no change in position and shape of the increasing slopes of the distributions was observed. The majority of the distributions was unstable and exhibited a decreasing trend () within the measurement period. Stable distributions could be measured using PETp at set point temperatures of 200 °C or higher (). Based on these results, PETp and PET turned out to be the most interesting materials for further investigations. Additional data on the stability of the particle number size distributions measured using Polyethene and Polypropene are presented in the SI (Figure S2).
Figure 3. Stability: The figure shows the temporal evolution of the particle number size distributions for two different materials. The curves correspond to different dwell times of the materials in the tube furnace. Panel (a) corresponds to measurement using PET and a set point temperature of 180 °C. Panel (b) shows the temporal evolution of the size distribution measured with PETp at 220 °C.
3.2. Effects of temperature, flow rate and amount of material
Three parameters were changed to test the impact on the resulting size distributions: the flow rates (Qf and Qdil), the set point temperature of the tube furnace (T) and the amount of particle material placed inside the crucible (m). All three parameters significantly influence the concentration and diameters of the produced particles. Measurements have been performed using approximately 35 combinations of settings. shows the results for a set of selected parameters. All measurements of this kind were performed such that just the parameter of interest was changed. All the other settings were kept constant.
Figure 4. Effects of temperature, flow rates and amount of material: The figure shows the influence of different flow rates (panel (a), PETp, 200 °C), amounts of material (panel (b), PETp, 200 °C) and set point temperatures (panel (c), PETp, 160–200 °C). Panel (d) presents the results of the direct comparison between PETp and PET using identical settings.
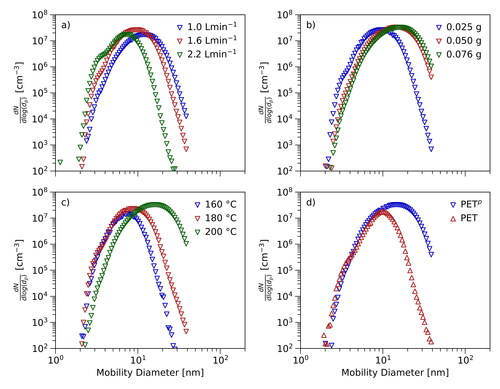
reveals the results for PETp at a set point temperature of 200 °C and different flow rates. The indicated flow rates are Qf, i.e., the flow rate of compressed and dried air passing the furnace. Since the flow rate of aerosol upstream the DMA was kept at 3.2 L·min−1 during all measurements, the dilution flow is given by subtracting Qf from QDMA. The graph clearly shows that the highest flow rate is linked to the smallest total concentration of particles. Compared to the result for 1.6 L·min−1 the particle number concentration corresponding to the maximum is approximately 50% lower. Interestingly, the highest number concentration of particles is linked to a flow rate of 1.6 L·min−1 and not to the minimal flow rate of 1.0 L·min−1. Within the uncertainties the position of the maximum shifts to larger particle diameters when the flow rate of 2.2 L·min−1 is decreased.
As illustrated in the amount of particle material also influences the shape of the measured particle number size distributions. The presented data corresponds to measurements using one to three pellets of PETp and a set point temperature of 200 °C. The resulting particle number size distributions exhibit an expected trend: Increasing the amount of particle material leads to higher particle number concentrations. Additionally, the already discussed broadening of the distribution including the shift of the position of the maximum was observed.
reveals the influence of the set point temperature of the tube furnace on particle generation. Starting from the onset of particle generation the furnace temperature was steadily increased by approximately 10 °C intervals. The maximum set point temperatures were chosen such that the particle material could still be removed from the crucible after the end of the measurement. By adhering to that approach, the need for a vast number of crucibles could be avoided. The results indicate that higher temperatures inside the tube furnace correlate with a higher total concentration of particles. Similar to , a broadening of the particle number size distributions as well as a significant shift of the position of the maximum to larger particle diameters can be seen.
In a consecutive step PETp was compared to PET using exactly the same settings (). Significantly fewer particles could be produced using PET at 200 °C. The particles produced using PET also covered a smaller range of diameters. The positions of the maxima of the distributions in can be directly compared. The maximum for PETp is located at approximately 20 nm whereas the maximum for PET is centered around 10 nm. Additionally, the total concentrations of the generated particles can be analyzed. Compared to PET three times more particles could be produced using PETp. Taking into account the measurement uncertainties, there is no difference between the onset diameters of the two materials. The differences between the discussed particle number size distributions gradually decrease when the temperature of the tube furnace is increased. Comparisons of the particle number size distributions for Polyethene, Polypropene as well as Polyethylene Terephthalate at a lower set point temperature are presented in the SI (Figure S3).
3.3. Probing the CPC counting efficiency for nanoplastic particles
We have used the nanoparticles generated from the tube furnace to test the counting efficiencies of CPCs operated with n-butanol as working fluid. Interactions between seed particles and the working fluid of CPCs can be characterized using the method presented in Wlasits et al. (Citation2020). Based on measurements of the 50% cutoff diameter (d50), i.e., the electrical mobility diameter of the seed particles that corresponds to a detection efficiency of 50%, the authors stated that chemical similarities between seed particles and working fluids influence the activation of seeds in CPCs. Due to the obtained particle number size distributions, ultrafine CPCs such as the TSI 3776 were not suitable for measurements of the 50% cutoff diameters as particles below 3 nm cannot be produced in sufficient quantities. Consequently, measurements have been performed using CPCs with larger 50% cutoff diameters, namely the TSI 3772 and the Airmodus A20. PETp and PET were used as primary materials. The particle number concentrations were kept between 500 and 70,000 cm−3 in case of the A20 and between 500 and 100,000 cm−3 for the TSI 3772. Exemplary plots showing the measured detection efficiencies can be found in the SI (Figure S4).
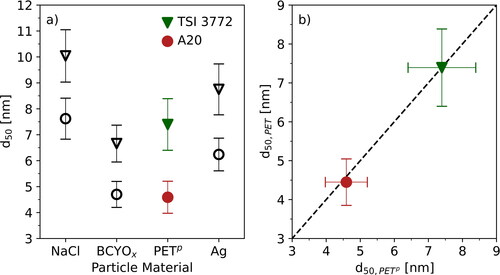
highlights the results of the measurements. The black markers correspond to data presented by Wlasits et al. (Citation2020). Triangles depict data measured with the TSI 3772 and rings mark data related to the A20. The filled markers correspond to the mean values of the diameters using PETp as primary material. Compared to the other materials presented in the graphs the 50% cutoff diameters of the investigated CPCs for PETp correspond to the 50% cutoff diameters measured with oxidized β-caryophyllene particles (BCYOx, ). Taking into account the working fluid as well as already measured data from other materials, the seed particles created from the thermoplastics can be allocated to the group of particles that are chemically similar to n-butanol and BCYOx. The same measurements were also repeated with PET as seed particle material (). The abscissa shows the 50% cutoff diameters measured with PETp and the ordinate refers to the corresponding values for PET. No significant differences between the measured 50% cutoff diameters using these materials were observed suggesting chemically similar particles (s. ).
Figure 5. 50% cutoff diameters: The figure presents the results of the measurements of the 50% cutoff diameter for PETp and PET using the TSI 3772 and Airmodus A20 as particle detectors. The triangles correspond to the TSI 3772, the rings to the Airmodus A20. The black data points correspond to the results of Wlasits et al. (Citation2020). Panel (a) shows the comparison of the 50% cutoff diameters for PETp to the aforementioned study. Panel (b) presents the 50% cutoff diameters for both CPCs based on measurements using PETp and PET.
4. Discussion
Our results demonstrate that aerosolized nanoplastics can be generated from macroplastics using a tube furnace. The set point temperatures of the tube furnace thereby ranged between 110 °C and 220 °C. Particle number size distributions in the diameter range of interest could be recorded for all particle materials under investigation. The findings of this study clearly show the benefits, limitations and challenges linked to the chosen particle material and generation method.
The materials used in this study for particle generation differed in their properties and on the reproducibility and controllability of the experimental conditions. It has become evident that PETp and PET are the most controllable particle materials and consequently, particle generation and size characterization from these two materials could be thoroughly investigated. Sub-10 nm particles could be reproducibly generated thereby enabling measurements of the 50% cutoff diameters. Furthermore, the two kinds of PET were the only materials yielding decent particle number concentrations below the melting point. Detailed investigations of PPp and PP could not be performed due to the diameter range the produced particles covered. LDPEp and LDPE posed a significant challenge due to a strong dependence on the dwell time and frequent shifts of the particle number size distribution. The presented generation method can be used to produce nanoplastics with maximum diameters of approximately 80 nm (SI, Figure S5).
In general, the use of macroplastics as particle material requires close monitoring of potential contaminations of the glass parts used in the experiments. Set point temperatures well above the melting points and overly filled crucibles may result in contamination of the working tube within the tube furnace. Consequently, particle generation from stains on the glass tubes needs to be excluded before any measurements are performed.
Comparisons of the particle output based on measurements of the higher-purity and commodity versions of PET yielded narrower particle number size distributions as well as lower maximum concentrations for the commodity plastics. Smaller and fewer particles were produced. This trend diminished with increasing temperatures and therefore points toward the use of additives, like flame retardants, in the production of PET. Most of the particle number size distributions measured with PETp and PET show a distinct flattening between 3 and 4 nm. Data suggests that the manifestation of that feature is linked to the selected settings ( and ). Since the flattening was observed for PET and PETp a connection to additives can be excluded (). The observed flattening might be related to the two-stage cooling, since it is more observed in particle number size distributions showing relatively high number concentrations of particles with diameters around 3 nm. Increasing the temperatures was connected to a gradual darkening of the material (SI, Figure S6). Effects linked to the shape of the pieces of raw material were not investigated. Differences concerning particle production using pellets, platelets or strips of the same material cannot be excluded.
Influences of the temperature of the tube furnace, flow rates and amount of material were characterized. The range of set point temperatures was mainly limited by an increasing broadening of the distributions at higher temperatures. This effect could be attenuated by reducing the amount of material. As a result, a stable particle number size distribution in the available diameter range with PETp at 220 °C could be measured after 30 min. of dwell time. In general, the stability of the particle output improved with increasing temperatures and longer dwell times. The observed temperature related broadening of the distribution agrees with results obtained when using common particle materials like NaCl and Ag. Data related to using increasing amounts of particle material followed our expectations as well. The observed influence of the flow rates is mainly governed by an enhanced surface cooling when using higher flow rates and dilution effects when using lower flow rates. Furthermore, higher flow rates result in a shorter residence time in the hot and cooled zones of the setup thereby impeding vapor nucleation.
Measurements of the 50% cutoff diameters yielded diameters very similar to the measurements with BCYOx and a n-butanol-based CPC as presented in Wlasits et al. (Citation2020). The produced particles are chemically different from ionically bonded and highly polar salts. Analyzing the thermal stability of PET suggests a possible explanation for the measured 50% cutoff diameters. As already mentioned, increasing set point temperatures of the tube furnace were linked to progressive darkening of the selected materials. This darkening indicates polymer degradation. Material discoloration did not have any effects on the measured 50% cutoff diameters. Our results and observations point toward thermal and thermo-oxidative degradation of PETp and PET in the presence of oxygen (Pergal and Balaban Citation2017). Following Pergal and Balaban (Citation2017) and De A. Freire et al. (Citation1999) particle production might be linked to the random scission of the polymer chains and subsequent reaction of the radicals. Especially particle formation based on oxidation processes would explain the similarity to the 50% cutoff diameters of oxidized β-caryophyllene.
Our work has led us to the conclusion that particles with diameters between 2.8 and 40 nm can be produced at high concentrations using a tube furnace in combination with thermoplastics as particle materials at surprisingly low temperatures. In this study we have not just measured particle number size distributions of particles produced from different kinds of thermoplastics but also assessed the influence of flow rates, temperatures of the tube furnace and amount of material. Higher-purity and commodity versions of the same kind of thermoplastic material have been compared and the 50% cutoff diameters of commonly used CPCs could be measured using PETp and PET as seed particle materials. The 50% cutoff diameters for these materials were found to be in good agreement with the 50% cutoff diameters of chemically similar systems. To the best of our knowledge these are the first counting efficiency measurements using nanoplastic particles. PETp and PET have proven to be a valuable addition to the set of seed particle materials commonly used for calibration measurements. Future research should include a thorough chemical analysis of the produced particles as well as the characterization of particle activation in CPCs based on different working fluids.
The availability of defined aerosol nanoplastic particles enables quantitative studies of heterogeneous nucleation and ice nucleating ability providing direct insight to the impact of nanoplastic particles on cloud formation. We therefore anticipate our study to serve as a basis for further investigations toward a thorough understanding of the processes governing particle generation, dispersion and toxicology.
uast_a_1998339_sm0583.pdf
Download PDF (689.4 KB)Acknowledgment
The authors thank Dr. Paulus S. Bauer for valuable comments on the data inversion.
Disclosure statement
The authors state that they have no conflict of interest.
Additional information
Funding
References
- Allen, S., D. Allen, D. V. R. Phoenix, G. Le Roux, P. D. Jiménez, A. Simonneau, S. Binet, D. Galop. 2019. Atmospheric transport and deposition of microplastics in a remote mountain catchment. Nat. Geosci. 12:339–44. doi: 10.1038/s41561-019-0335-5.
- Balakrishnan, G., M. Deniel, T. Nicolai, C. Chassenieux, F. Lagarde. 2019. Towards more realistic reference microplastics and nanoplastics: preparation of polyethylene micro/nanoparticles with a biosurfactant. Environ. Sci: Nano. 6 (1):315–24. doi: 10.1039/C8EN01005F.
- Bergmann, M., S. Mützel, S. Primpke, M. B. Tekman, J. Trachsel, G. Gerdts. 2019. White and wonderful? Microplastics prevail in snow from the Alps to the Arctic. Sci. Adv. 5 (8):1–10. doi: 10.1126/sciadv.aax1157.
- Biron, M. 2007. Outline of the actual situation of plastics compared to conventional materials. In Thermoplastics and thermoplastic composites, 1–32. Oxford: Elsevier. doi: 10.1016/B978-1-85617-478-7.X5001-6.
- Biskos, G., A. Malinowski, L. M. Russell, P. R. Buseck, S. T. Martin. 2006. Nanosize effect on the deliquescence and the efflorescence of sodium chloride particles. Aerosol Sci. Technol. 40:97–106. doi: 10.1080/02786820500484396.
- Bozukova, D., C. Pagnoulle, R. Jérôme, R. C. Jérôme. 2010. Polymers in modern ophthalmic implants—Historical background and recent advances. Mater Sci Eng R: Report. 69:63–83. doi: 10.1016/j.mser.2010.05.002.
- Cai, L., J. Wang, J. Peng, Z. Tan, Z. Zhan, X. Tan, Q. Chen. 2017 . Characteristic of microplastics in the atmospheric fallout from Dongguan city, China: preliminary research and first evidence. Environ. Sci. Pollut. Res. Int. 24:24928–35. doi: 10.1007/s11356-017-0116-x.
- De A. Freire, M. T., A. P. Damant, L. Castle, F. G. R. Reyes. 1999. Thermal stability of polyethylene terephthalate (PET): oligomer distribution and formation of volatiles. Packag. Technol. Sci. 12 (1):29–36. doi: 10.1002/(SICI)1099-1522(199901/02)12:1 < 29::AID-PTS451 > 3.0.CO;2-D.
- Dris, R., J. Gasperi, M. Saad, C. Mirande, B. Tassin. 2016. Synthetic fibers in atmospheric fallout: a source of microplastics in the environment? Mar. Pollut. Bull. 104 (1–2):290–3. doi: 10.1016/j.marpolbul.2016.01.006.
- Ekvall, M. T., M. Lundqvist, E. Kelpsiene, E. Šileikis, S. B. Gunnarsson, T. Cedervall. 2019. Nanoplastics formed during the mechanical breakdown of daily-use polystyrene products. Nanoscale Adv. 1 (3):1055–61. doi: 10.1039/C8NA00210J.
- Evangeliou, D., H. Grythe, Z. Klimont, C. Heyes, S. Eckhardt, S. Lopez-Aparicio, A. Stohl. 2020. Atmospheric transport is a major pathway of microplastics to remote regions. Nat. Commun. 11:3381. doi: 10.1038/s41467-020-17201-9.
- Feldmann, D. 2008. Polymer history. Des. Monomers Polym. 11 (1):1–15. doi: 10.1163/156855508X292383.
- Flagan, R. C. 1999. On differential mobility analyzer resolution. Aerosol Sci. Technol. 30 (6):556–70. doi: 10.1080/027868299304417.
- Frias, J. P. G. L., R. Nash. 2019. Microplastics: finding a consensus on the definition. Mar. Pollut. Bull. 138:145–7. doi: 10.1016/j.marpolbul.2018.11.022.
- Gasperi, J., S. L. Wright, R. Dris, F. Collard, C. Mandin, M. Guerrouache, V. Langlois, F. J. Kelly, B. Tassin. 2018. Microplastics in air: are we breathing it in? Curr. Opin. Environ. Sci. Health. 1:1–5. doi: 10.1016/j.coesh.2017.10.002.
- Gulrez, S. K. H., M. E. Ali Mohsin, H. Shaikh, A. Hamid, A. M. Pulose, M. K. Yadav, E. H. P. Qua, S. M. Al-Zahrani. 2014. A review on electrically conductive polypropylene and polyethylene. Polym. Compos. 35:900–14. doi: 10.1002/pc.22734.
- Hahladakis, J. N., C. A. Velis, R. Weber, E. Iacovidou, P. Purnell. 2018. An overview of chemical additives present in plastics: migration, release, fate and environmental impact during their use, disposal and recycling. J. Hazard. Mater. 344:179–99. doi: 10.1016/j.jhazmat.2017.10.014.
- Kallinger, P., G. Steiner, W. W. Szymanski. 2012. Characterization of four different bipolar charging devices for nanoparticle charge conditioning. J. Nanopart. Res. 14 (6):944. doi: 10.1007/s11051-012-0944-z.
- Lehner, R., C. Weder, A. Petri-Fink, B. Rothen-Rutishauser. 2019. Emergence of nanoplastic in the environment and possible impact on human health. Environ. Sci. Technol. 53 (4):1748–65. doi: 10.1021/acs.est.8b05512.
- Mendes, L., A. Kangas, K. Kukko, B. Mølgaard, A. Säämänen, T. Kanerva, F. Tomi, I. Ituarte, M. Huhtiniemi, H. Stockmann-Juvala, et al. 2017. Characterization of emissions from a desktop 3d printer. J. Ind. Ecol. 21 (S1):94–106. doi: 10.1111/jiec.12569.
- Pergal, M., V. M. Balaban. 2017. Polyehtylene terephtalate: synthesis and physicochemical properties. In: Polyethylene terephthalate: Uses, properties and degradation, ed. N. A. Barber, 1–102. Hauppauge, New York: Nova Science Publishers.
- Redondo-Hasselerharm, P. E., G. Gort, E. T. H. M. Peeters, A. A. Koelmans. 2020. Nano- and microplastics affect the composition of freshwater benthic communities in the long term. Sci. Adv. 6 (5):1–11. doi: 10.1126/sciadv.aay4054.
- Scheibel, H. G., J. Porstendorfer. 1983. Generation of monodisperse Ag- and NaCl-aerosols with particle diameters between 2 and 300 nm. J. Aerosol. Sci. 14 (2):113–26. doi: 10.1016/0021-8502(83)90035-6.
- Tauber, C., S. Brilke, P. J. Wlasits, P. S. Bauer, G. Köberl, G. Steiner, P. M. Winkler. 2019. Humidity effects on the detection of soluble and insoluble nanoparticles in butanol operated condensation particle counters. Atmos. Meas. Tech. 12 (7):3659–71. doi: 10.5194/amt-12-3659-2019.
- Velimirovic, M., K. Tirez, S. Verstraelen, E. Frijns, S. Remy, G. Koppen, A. Rotander, E. Bolea-Fernandez, F. Vanhaecke. 2021. Mass spectrometry as a powerful analytical tool for the characterization of indoor airborne microplastics and nanoplastics. J. Anal. At. Spectrom. 36 (4):695–705. doi: 10.1039/D1JA00036E.
- Wiedensohler, A. 1988. An approximation of the bipolar charge distribution for particles in the submicron size range. J. Aerosol Sci. 19 (3):387–9. doi: 10.1016/0021-8502(88)90278-9.
- Wiesinger, H., Z. Wang, S. Hellweg. 2021. Deep dive into plastic monomers, additives, and processing aids. Environ. Sci. Technol. 55 (13):9339–51. doi: 10.1021/acs.est.1c00976.
- Winkler, P. M., A. Hienola, G. Steiner, G. Hill, A. Vrtala, G. P. Reischl, M. Kulmala, P. E. Wagner. 2008. Effects of seed particle size and composition on heterogeneous nucleation of n-nonane. Atmos. Res. 90 (2):187–94. doi: 10.1016/j.atmosres.2008.02.001.
- Wlasits, P. J., D. Stolzenburg, C. Tauber, S. Brilke, S. H. Schmitt, P. M. Winkler, D. Wimmer. 2020. Counting on chemistry: laboratory evaluation of seed-material-dependent detection efficiencies of ultrafine condensation particle counters. Atmos. Meas. Tech. 13 (7):3787–98. doi: 10.5194/amt-13-3787-2020.