
 ?Mathematical formulae have been encoded as MathML and are displayed in this HTML version using MathJax in order to improve their display. Uncheck the box to turn MathJax off. This feature requires Javascript. Click on a formula to zoom.
Abstract
There is a lack of aerosol measurement technology capable of quantifying, in real time, the size, concentration, and composition of large inhalable particles – specifically those with aerodynamic diameter larger than 20 µm. Aerosols of this size penetrate into the upper respiratory system upon inhalation and present surface contamination hazards upon settling. The objective of this work was to validate the performance of a prototype direct-reading particle sizer (DRPS) that counts and sizes particles via time-of-flight light scattering and determines single-particle elemental composition via laser-induced breakdown spectroscopy (LIBS). Counting, sizing, and spectral measurement efficiency were evaluated using test aerosols of multiple materials in the size range 25–125 µm. Particle sizing results showed good agreement with optical microscopy images, and LIBS measurements allow simultaneous elemental composition measurements. The relationship between the median aerodynamic diameters measured by the DRPS time-of-flight and optical microscopy was linear (Deming regression slope of 0.998) and strongly correlated (r2 > 0.999). The mean absolute difference between the median aerodynamic diameters measured by the instrument by time-of-flight and microscopy over all eight test aerosol types was 0.9 µm with a mean difference in interquartile range of 1.9 µm. LIBS spectra have been collected and analyzed to reveal spectral features of species from silver-coated glass and titanium samples. The expected system performance for future field use is considered through numeric simulations based on the instrument parameters and assumed particle size distributions. Finally, potential hardware changes to optimize detection efficiency and facilitate field use are discussed.
EDITOR:
Introduction
There are many industrial processes where workers are exposed to large metal aerosols. Inhalation of these metal particles poses health hazards regardless of their chemical composition (Linnainmaa et al. Citation2008). Exposure to inhalable aerosols is common but challenging to quantify. The aerodynamic diameter (da) of the particle determines where it is most likely to deposit in the body with toxicity depending on the particle's chemical composition. Industrial processes that produce particles with mass median aerodynamic diameter (MMAD) greater than 20 µm include grinding (MMAD 59 µm) (Lidén, Juringe, and Gudmundsson Citation2000), laser machining (mean diameter 50 µm) (Voisey et al. Citation2003), lead smelting (MMAD 1.6–95 µm) and battery manufacturing (MMAD 4.6–90 µm) (Boyce, Sax, and Cohen 2017). One of the limiting factors in furthering our understanding of inhalable aerosol exposure has been a lack of adequate measurement techniques – specifically, time-resolved determination of the count, size and composition of particles. The present work focuses on the development and laboratory validation of an instrument to characterize size and composition of the largest particles of the inhalable range, specifically, those with an aerodynamic diameter of ∼20–100+ µm.
The inhalable fraction is based on the penetration of particles into the nose and mouth while breathing and is typically defined by the range da < 100 µm (ISO 1995). However, larger particles than this do exist in some environments, with a reasonable probability of inhalation (Volkwein, Maynard, and Harper Citation2011). Few particles larger than 20 µm will penetrate further than the larynx and tend to deposit in the upper respiratory system due to their high inertia (Brown et al. Citation2013; Cheng, Zhou, and Chen Citation1999). Potential health hazards associated with particle inhalation and deposition in the upper respiratory system include irritation and infection in the nasal mucous membrane, asthmatic responses, and sinonasal cancer (Salvaggio Citation1994; Youlden et al. Citation2013). Many of these particles are eventually swallowed (via deposition or mucociliary clearance) and therefore pose potential hazards to the gastrointestinal tract (de Vocht et al. 2009; Li et al. Citation2003).
Aerosol exposure limits in the workplace are often based on mass concentration. Since the mass of a particle with given density scales with the cube of its diameter, the presence of large particles in a workplace environment can contribute substantially to the total aerosol mass concentration. Further, while knowledge of the overall aerosol mass concentration is useful for hazard identification, aerosol control technologies are most effective when matched to a specific size distribution. Identifying the composition of airborne particles is also important from the standpoint of hazard identification and risk assessment. For example, higher levels of exposure are permitted for aluminum or iron oxide dust (5 mg/m3 in both cases) than for known carcinogens like nickel (1 mg/m3) or beryllium (5 µg/m3) (OSHA Citation2005). We know of no current technology that allows simultaneous time-resolved measurement of both the size and elemental composition for large (>20 µm) airborne particles. The present work describes a portable, direct-reading instrument to determine the size and composition of airborne particles larger than 20 μm in aerodynamic diameter.
This work builds upon the portable inhalable particle separator (Anderson et al. Citation2015) to perform particle sizing based on a particle’s terminal settling velocity (VTS), the constant velocity achieved when drag and gravitational forces are in equilibrium (Hinds Citation1999). The determination of terminal settling velocity allows for the calculation of aerodynamic diameter (da):
(1)
(1)
where ρ0 is the standard particle density (1000 kg/m3), g is the acceleration due to gravity, Cc is the slip correction factor (Cc = 1 for particles >20 µm), η and ρg are the dynamic viscosity and density of the surrounding gas, respectively. The aerodynamic diameter is the diameter of a spherical particle of standard density with equal settling velocity as the particle in question; and defines the aerodynamic properties of the particle necessary for characterizing filtration and respiratory deposition. The relationship between settling velocity and aerodynamic diameter (EquationEquation (1)
(1)
(1) ; Hinds Citation1999) takes on a different functional form depending on the particle Reynolds number (Re). In the Stokes regime (Re < 1), there is a theoretical basis for the relationship between particle velocity and particle size based on the Navier-Stokes equation. However, at Reynolds numbers greater than 1, the assumptions made in the Stokes regime are no longer valid, and an empirical solution based on experimentation is used in the transition region (1 ≤ Re ≤ 1000). The transition from Stokes to transition flow typically occurs for particle settling at aerodynamic diameters of ∼80 µm and larger.
The aerodynamic diameter can be related to the spherical equivalent diameter (deq), which is defined as the diameter of a sphere having equal volume as a particular particle:
(2)
(2)
where χ is the dimensionless dynamic shape factor (the ratio of actual air resistance force on a nonspherical particle to the resistance force on a spherical particle with the same volume and velocity), ρp is the bulk density of the particle and ρ0 is the standard density. Note that EquationEquation (2)
(2)
(2) only applies in the continuum regime (Knudsen number <0.01 or particles larger than 13.2 µm at standard environmental conditions) (DeCarlo et al. Citation2004; Hinds Citation1999).
To obtain direct, time-resolved elemental composition data, we build upon past work employing laser-induced breakdown spectroscopy (LIBS) to analyze particles (Carranza et al. Citation2001; Kim et al. Citation2019; Xiong et al. Citation2016). The LIBS technique involves focusing a high-power laser beam onto a sample to ablate material and then analyze the spectral content of light emitted from the resulting laser-induced microplasma (Cremers and Radziemski Citation2013). The collected spectra provide a way to determine the elemental composition of a sample because each constituent element emits light at different characteristic wavelengths depending on its energy level structure. Extensive past research has examined how the mass of ablated material, its composition, and the position of the sample relative to the center of the plasma affect the quality of the collected spectra (Fortes, Fernández-Bravo, and Laserna 2014; Kumar et al. Citation2021). Aerosol focused elemental analysis with LIBS is typically performed on stationary samples, e.g., with filter media loaded with sample aerosols (Panne et al. Citation2001), particles deposited on the tip of a charged needle (Diwakar, Kulkarni, and Birch Citation2012), or single particles and droplets trapped with an electrodynamic balance (Heikkilä et al. Citation2020; Järvinen and Toivonen Citation2016). In the present work, LIBS is used to analyze airborne particles as they settle in situ. Such an approach is challenging due to the need to achieve spatial and temporal overlap of the transient laser plasmas with the small moving targets. Related approaches to characterize moving airborne particles with LIBS have also included use of focusing nozzles and sheath flows to improve the probability of plasma formation coincident with a sample particle (Manninen et al. Citation2008; Tjärnhage et al. 2013).
The present work details the design and testing of an instrument for sizing based on settling velocity with the simultaneous determination of composition based on LIBS oriented to particles in the 20–100 μm range. Existing instrumentation such as cascade impactors, condensation particle counters and the Aerodynamic Particle Sizer (TSI Inc. Shoreview, MN) are designed for smaller aerosol sizes and are not appropriate for particles much larger than ∼10–20 µm due to aspiration issues and transmission losses (Volckens and Peters Citation2005). The aerosol mass spectrometer (Jayne et al. Citation2000) is an advanced direct-reading instrument capable of measuring both size and composition of aerosols, but only for particles <1 µm. A common sampling methodology for characterizing large particles in occupational settings involves active sampling and collection of particles onto filter media. These samples are typically sent to an off-site lab for analysis. However, post facto analysis via inductively coupled plasma mass spectroscopy, or similar processes, is expensive and may take weeks to return the results (Su et al. Citation2014; Wilschefski and Baxter Citation2019). The delay in receiving results means that dangerous levels of contaminants may continue to be present for weeks or months after exposure assessment occurs.
There remains, therefore, a need for an instrument allowing real-time sizing and elemental composition for particles larger than 20 µm as part of aerosol hazard monitoring in the workplace.
Materials and methods
Device overview
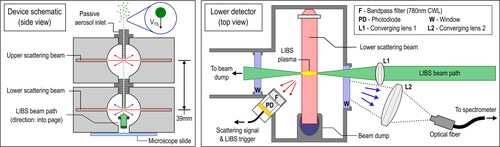
A direct-reading particle sizer (DRPS) to determine the count, size and elemental composition of large particles (∼20–100 μm) was developed and evaluated in the laboratory. Particles are counted and sized based on their time-of-flight as they settle through a pair of vertically aligned laser beams. Particles passing the second (lower) beam trigger a LIBS laser pulse used to determine elemental composition. A schematic of the DRPS is provided in .
Figure 1. Schematic of the DRPS prototype. (Left) A side view of the two vertically stacked particle counting stages. (Right) A top-down view of the lower detection stage highlighting components of the LIBS system.
Aerodynamic diameter measurement
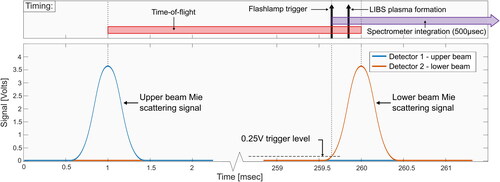
The method used to size and count particles is based on Mie scattering (Pinnick, Rosen, and Hofmann Citation1973) of laser light as particles pass through the device at their terminal settling velocity. The aerodynamic diameter is determined by measuring the particle time-of-flight (transit time) between two vertically separated beams (each projecting light orthogonal to and intersecting the settling particle pathline) placed within a cylindrical housing (). In the current prototype, the DRPS hardware is based on two modified commercial particle counters (9301P-OEM, Particles Plus Inc., Stoughton, MA, USA) connected in series. The inlet and outlet of the DRPS are open to ambient air, allowing particles to settle through a small passive inlet (1.5 mm diameter) under gravity. Except for the inlet and outlet, the sampler is fully enclosed to minimize air currents that could potentially change the trajectory of the falling particles. Each Mie scattering beam is generated using a 785 nm diode laser collimated and focused into a thin sheet with thickness ∼50 µm in the direction of the aerosol flow and width ∼3 mm in the transverse direction. Light scattered by falling particles in each beam is collected with a photodiode. For the upper beam, the light collection is at a 90° scattering angle, whereas the collection is at 135° for the scattering of the lower beam as not to obstruct the LIBS beam path. An intermediate 1.5-mm diameter inlet separates the regions associated with the upper and lower Mie beams and provides enough optical isolation to prevent cross-talk between the two detector channels. An optical bandpass filter with a 780 nm central wavelength (FL05780-10, Thorlabs Inc., Newton, NJ, USA) is placed in front of each detector to minimize the influence of ambient light. The voltage output from each photodiode is monitored using a USB voltage logger (DI-1120, DATAQ Instruments Inc., Akron, OH, USA) sampling at 80 kHz per channel. The minimum detectable particle size can be adjusted by specifying the input current of each laser diode such that only particles of sufficient size scatter enough light to generate a detectable voltage peak. The time-of-flight for a given particle is found as the elapsed time between the maxima of the two Mie scattering signals from the upper and lower beams; an illustrative schematic can be found in . The particle settling velocity is found by dividing the known vertical beam separation (3.9 cm) by the time-of-flight. The lower photodiode does detect the LIBS plasma; however, this interference is timed to occur after a suitable time-of-flight determination has been made. Additional information about the influence of the LIBS plasma on the second scattering signal is presented in the SI. The time-of-flight approach requires that the Mie signals from the two beams be attributed appropriately to the falling particles. For each voltage peak in the record of the lower photodiode, a script (MATLAB, version R2109b) is used to find a corresponding peak in the upper photodiode record. Details of this process and coincidence error considerations are examined further in the “Detection efficiency and optimization” section.
Figure 2. Timing diagram with time-of-flight measurement and trigger timing of LIBS laser source and spectral acquisition for an illustrative pair of Mie scattering signals.
Test aerosol selection and dispersion
Four test aerosols (Cospheric LLC, Santa Barbara, CA, USA) were examined in this work with aerodynamic diameters ranging from 24 to 125 µm and bulk densities from 1025 (polyethylene) to 7800 (stainless steel) kg/m3. Details of the size and density of the test particles are presented in . All eight particle sizes and types were used for validation of the time-of-flight sizing methodology. Three sizes of silver-coated glass microspheres and the titanium microspheres were used to test the LIBS system. An initial study of particle counting and LIBS detection efficiencies was performed using silver-coated glass spheres only.
Table 1. Particle size and composition data provided by the manufacturer and measured size characteristics from the time-of-flight and microscope image analysis methods.
Due to the large size of the test aerosols and the need for low particle concentration, common dispersion methods such as a nebulizer or fluidized bed generator were not appropriate. Instead, a blast of compressed air was used to propel a small quantity (<10 mg) of aerosol through a copper pipe into the air above the DRPS. The outlet of the copper pipe is oriented vertically and positioned ∼70 cm above the sampler inlet to allow even the largest aerosols sufficient vertical distance to reach their terminal settling velocity. The air volume in which the aerosols are dispersed is constrained by a 20 cm diameter 120 cm tall open-ended tube, which contains the particle cloud and reduces the influence of room air currents. Particles used in this work are nominally spherical (χ = 1), as is further discussed below.
Particle size verification and counting efficiency
Microscopy was used to verify the count and size of particles passing through the DRPS inlet. The accuracy of the aerodynamic diameters determined by DRPS time-of-flight was evaluated against microscope images of the same test aerosols, along with knowledge of particle density. A glass microscope slide () was held in a fixture under the sampler such that the same particles measured by the scattering beams were deposited onto the slide. Microscope images were captured at 6.3× magnification using a microscope (Orthoplan, Leitz, Wetzlar, Germany) and USB camera (GRYPHAX, Jenoptik AG, Germany). At this magnification value, a single pixel in the captured images corresponds to a 1.2 × 1.2 µm square. Therefore, the aerodynamic diameters reported for each measurement method are rounded to the nearest micrometer. The projected area of each particle was calculated using ImageJ image analysis software (Schneider, Rasband, and Eliceiri Citation2012). Assuming the particles are spheres, the spherical equivalent diameter (deq) is computed using EquationEquation (3)(3)
(3) , where Aproj is the projected area of an individual particle in the microscope images.
(3)
(3)
The equivalent diameter is then converted to aerodynamic diameter using the particle density specified by the manufacturer and EquationEquation (2)(2)
(2) for direct comparison with the results obtained by the time-of-flight method. Plots of the cumulative distribution function (CDF) were generated to visualize and quantify the agreement between the number size distributions found from time-of-flight (da) and those from microscopy (deq) for each test particle material and size. A two-sample Kolmogorov–Smirnov (KS) test was used to test for a statistically significant difference between the empirical CDFs for each sizing method. In addition to the result of the KS test, the total particle counts obtained by each method, the median, first and third quartile values were computed for comparison.
The counting efficiency (ηcount) represents the fraction of all particles entering the device which are successfully counted and sized. The number of entering particles is found as the number of scattering events in the top beam while the number of particles counted and sized is found as the number of particles yielding a pair of scattering signals that can be paired to compute a transit time:
(4)
(4)
Factors that reduce the experimental counting efficiency include transmission losses between the two scattering beams and coincidence error. Coincidence error is defined in the context of this work as cases where the scattering signal appearance rate in the bottom beam exceeds the inverse of the transit time of the smallest particles of interest. Particle losses occur due to the trajectory of falling particles deviating from the vertical direction, thereby causing them to deposit on surfaces (e.g., intermediate inlet) between the upper and lower beams.
LIBS composition measurement
The LIBS analysis system used for composition determination is shown in and trigger timing with respect to the Mie scattering signals in . The axis of the LIBS beam horizontally and orthogonal to the Mie scattering beams. The path of the LIBS beam is aligned slightly below the centerline of the lower scattering beam such that the microplasma (∼0.5 mm3 in volume) is positioned coincident with the path of the falling particles in the horizontal plane. A trigger signal is sent to the laser to initiate the LIBS process when the lower photodiode detects a light scattering signal. Specifically, a delay generator (DG535, Stanford Research Systems, Sunnyvale, CA, USA) is used to monitor the voltage output of the lower photodiode and, when a trigger threshold of 0.25 V is reached, a trigger pulse is sent to the Nd:YAG laser (Q-Smart 100, Quantel Laser, Les Ulis, France). After an additional fixed delay of 270 μs to allow gain buildup within the laser, the output pulse is produced. The Nd:YAG laser has pulsed output (8 ns) at a wavelength of 1064 nm with an energy of ∼40 mJ which is sufficient for reliable plasma breakdown even in relatively clean air (no large particles). The beam has a diameter of 4.5 mm and is focused by a 4 cm focal length lens (LA4130-ML, Thorlabs Inc.) to a waist of ∼50 μm at the location of the aerosol stream. The fraction of laser energy not absorbed by the plasma is transmitted to a beam dump to avoid surface ablation and heating inside the DRPS detection volume so as to mitigate residual air currents. The beam enters and exits the sampler volume through UV-grade fused silica windows (WG41050-C, Thorlabs Inc.).
The light emitted from the LIBS microplasma is collected by a 4 cm focal length lens (LA4306-ML, Thorlabs Inc.) and imaged with 1:2 magnification onto the bare end of a 1.5 mm core diameter optical fiber (M93L, Thorlabs Inc.) coupled to a USB spectrometer (HR4000, Ocean Insight, Orlando, FL, USA). The same trigger pulse used for the Nd:YAG also initiates the 500 μs integration period of the fiber-coupled spectrometer. A single emission spectrum is collected for each LIBS plasma formation event. The size of the laser plasma kernel is estimated to be ∼2–3 mm in the direction of laser propagation and 200–700 µm in both orthogonal dimensions (Alberti et al. Citation2020; Brieschenk, Kleine, and Obyrne Citation2013). Given the relative sizes of the plasma and particle, the resulting plasma and emitted spectrum contain contributions from both ambient air and a particle when present. Each collected spectrum is analyzed with a peak detection script (MATLAB R2109b). The spectral features that differ from a reference spectrum of clean air are recorded and composition is determined by comparing emission line wavelengths against a National Institute of Standards and Technology (NIST) spectroscopic database (Harmon et al. Citation2006; Kramida, Olsen, and Ralchenko Citation2019).
The LIBS efficiency (ηLIBS) is defined as the fraction of counted (and sized) particles that yield LIBS spectra containing emission lines from the analyte (silver, in this case). The purpose of the LIBS efficiency is to quantify the “hit rate” of the LIBS system in terms of successfully overlapping the transient laser plasma with the falling particles. The final efficiency metric of overall efficiency (ηoverall) is defined as the fraction of particles entering the device that are successfully counted (and sized) and that yield a final spectrum containing the analyte:
(5)
(5)
(6)
(6)
The LIBS efficiency is limited by the relatively small area of the LIBS detection region in the horizontal plane defined by the plasma size when compared with the total area through which particles can fall. With a 1.5 mm inlet diameter, the plasma covers ∼45% of the projected area of the aerosol stream. If the aerosol flow diverges at all after passing through the orifice, the fractional area covered by the plasma further decreases.
Results and discussion
Time-of-flight sizing
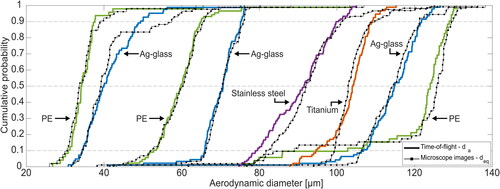
Aerodynamic diameter measurements made by the DRPS and by optical microscopy are presented in for each material type and particle size range (as specified by the manufacturer). Summary statistics appearing in for each test aerosol were computed from a combined dataset of multiple experimental trials (3–8 trials depending on size and material). Cumulative distribution plots are provided in showing all particle measurements for each technique and for each material type/size. The measured aerodynamic diameter distributions inferred from the DRPS time-of-flight agree closely with those found by microscope imaging over all particle sizes and compositions (). The greatest deviations occurred at the upper tail of the “33–44 µm” Ag-Glass spheres and the lower tail of the “81–103 µm” stainless steel particles. However, across both of these distributions the median, 25th and 75th diameter sizes differed only between 1 and 4 µm (see and ). Results from the two-sample KS tests suggest that the DRPS and optical microscopy methods reported similar underlying size distributions across all test aerosols (; no rejection of the null hypothesis that distributions are similar at the 95% confidence level for any test aerosol type).
Figure 3. Empirical cumulative distribution function (CDF) plots for each test aerosol. Solid lines indicate aerodynamic diameter distributions measured by the time-of-flight method and dotted lines show the predicted distributions based on microscopy.
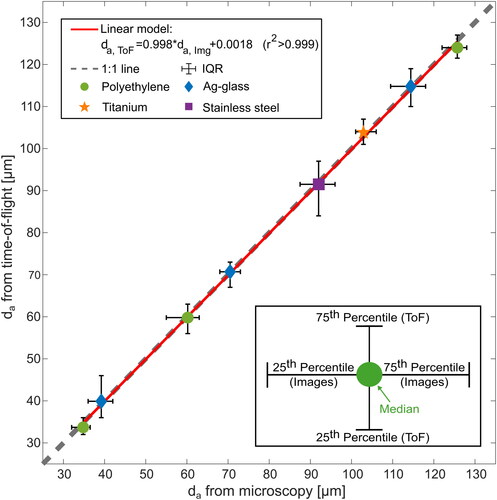
Agreement between median diameters reported by the two methods was excellent, as shown in and , respectively. A Deming regression of median sizes measured across the full range of tested diameters gave a slope of 0.988, an intercept of 0.02 µm and an r2 value above 0.999. This regression matches the 1:1 line shown in well. The mean absolute difference between the median aerodynamic diameters measured by the instrument by time-of-flight and microscopy over all 8 test aerosol types was 0.9 µm with a mean difference in interquartile range of 1.9 µm; these values are close to the uncertainty limits of the optical microscope itself, which are on the order of 1 µm for the imaging/magnification system used here.
Figure 4. Linear regression of median aerodynamic diameter measurements obtained by time-of-flight and microscopy. Vertical and horizontal bars indicate the interquartile range of aerodynamic diameter measurements for each method (time-of-flight and microscopy, respectively).
The number of usable scattering signal pairs for time-of-flight measurements and the number of particles captured in the microscope images were also similar. The particle count on the microscope slide and the number of particles detected by the instrument were approximately equal in 21 of 38 trials. For the 17 trails where the total counts differed, the discrepancy in microscope slide versus time-of-flight particle counts was ≤10% in all but 2 trials (and never greater than 3 counts). Low slide counts can be attributed to losses as particles may deposit inside the sampler or otherwise fail to reach the microscope slide and/or unusable Mie scattering signals (below the voltage threshold or rejected due to coincidence error). Particles may also be miscounted if they settle on top of each other and agglomerate (though this artifact appears infrequent based on collected microscope images). When non-spherical particles are encountered in the images, the equivalent spherical diameter skews larger than the true aerodynamic diameter. The majority of the particles examined in the microscope image size verification procedure were nominally round, however, some non-spherical particles were present. Based on microscope image analysis, non-spherical particles are attributed to either manufacturing anomalies or doublets/agglomerates of spherical particles. The frequency of non-spherical particles varies slightly with material and particle size. The circularity of a representative sample of 432 test aerosols was computed and the majority (>75%) of particles could be considered to be spherical for every test aerosol size and material. Details of the circularity analysis are provided in the SI. For initial device validation, work has focused on spherical particles over relatively narrow size ranges. Opportunities for hardware optimization to facilitate operation with polydisperse samples are discussed in the “Detection efficiency and optimization” section.
LIBS composition
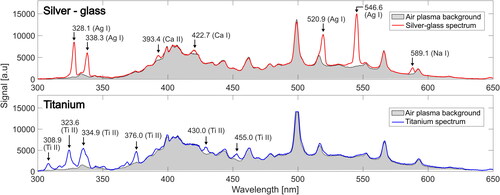
LIBS emission spectra have been obtained using the prototype device to identify both solid Titanium microspheres and the ∼75–225 nm thick silver coating of the Ag-glass microspheres. Example spectra for these materials are provided in . Examples for both the silver-glass (da ≈ 66–80 μm) and titanium (da ≈ 78–100 μm) microspheres are shown when compared with the background air spectra. The specific neutral silver (Ag I) lines from the NIST emission database are labeled (328.1, 338.3, 520.9 and 546.6 nm). Peaks associated with the soda lime glass core of the particle are typically not detectable in the experimental spectra due to partial ablation of the particle, though Na I (589.1 nm), Ca I (422.7 nm) and Ca II (393.4 nm) emission can be seen in the example plot (). Titanium emits at a larger number of wavelengths and only the most prominent Ti II peaks are labeled in the figure. The ability to detect these spectral features unique to silver and titanium supports the capability of the DRPS to determine single-particle composition with LIBS. Future work will examine the ability to use the magnitudes of spectral lines to determine mass fraction of multi-component materials. A potential challenge in estimating mass is the possibility of slightly different positions of falling particles relative to the LIBS beam resulting in varying overlap between the particle and the microplasma. The temperature and density of the plasma and ablated mass can reasonably be expected to have some variation which will influence the spectral line intensities (Kumar et al. Citation2021). Additionally, the particles are not completely ablated by the plasma and the analyte measured in the collected spectrum may not be representative of the entire particle for a non-homogenous sample. Nonetheless, the proof of concept spectra presented here clearly support the ability to identify species and perform composition measurements.
Figure 5. Example LIBS spectra obtained from silver-coated glass (top) and titanium (bottom) test aerosols. Shaded regions indicate spectral features associated with breakdown of ambient air and peaks resulting from ablation of the analyte species are called out with arrows.
Detection efficiency and device optimization
Counting, LIBS, and overall efficiency results for the three tested size ranges of silver-coated glass microspheres are presented in . In some cases (4 of 15 trials), the signal counts in the lower beam are greater than the count in the upper beam. This is hypothesized to be a result of particle resuspension following the shockwave produced by the formation of the LIBS plasma. The device achieved overall efficiencies in the range ∼48%–64% which is considered reasonable for the non-optimized prototype.
Table 2. Scattering signal counts, collected spectra, and detection efficiency values calculated from five trials with each silver-coated glass test aerosol size bin.
To investigate potential instrument performance limitations in the field (and to motivate possible future modifications), the expected instrument particle counts were modeled under several assumed particle size distributions and mass concentrations. We assume the instrument is configured to detect all particles larger than some minimum particle diameter D1 (set by the detector voltage threshold) which we take here as 20 µm. The instrument count rate φ (number of counts per unit time) is then found as the flux of particles through the inlet integrated over a specified size distribution:
(6)
(6)
where Ai is the area of the inlet, dN/dD is the specified particle number distribution function, and D2 is the largest particle to be detected. (The D2 limit can be set as infinity given that even the largest particles of interest readily fall through the inlet in practical designs.) A practical consideration is that, to avoid coincidence error (i.e., the presence of multiple particles between the Mie beams at a given instant which may confound the pairing algorithm), one should set an upper limit on the final count rate φ. Specifically, the smallest particles of interest, with da = 20 µm, require 3.3 s to settle through the two beams (for current separation of 39 mm) meaning that the instrument count rate should be limited to a maximum of 0.3 particles/s. For illustrative exposition of instrument performance, a lognormal particle size distribution with geometric mean diameter 30 µm and geometric standard deviation of 1.5 is assumed in the following calculations. With the current design, the DRPS could operate reliably at ambient aerosol mass concentrations up to 144 µg/m3 before the coincidence error limit. The maximum mass concentration (before the coincidence error limit) is inversely proportional to the beam separation, e.g., if the beam separation were reduced by a factor of 3 (to 1.3 cm) then the maximum allowable mass concentration increases to ∼430 µg/m3. Furthermore, reduced inlet diameter reduces the particle flux in proportion to its area (diameter squared). Increasing the inlet area admits more particles to the device but increasing beyond the dimension of the Mie beam or LIBS plasma will not generally be useful. These parameters can be optimized to yield needed instrument performance in different environments (i.e., for different particle distributions). A practical consideration is that reducing inlet orifice sizes will also tend to increase the probability of particles depositing within the inlet tube.
Studies of occupational exposure to inhalable aerosols of welders have measured mass concentrations in the range 0.53 − 11.6 mg/m3 depending on the type of welding with a median concentration of 2.48 mg/m3 (Lehnert et al. Citation2012; Lin et al. Citation2015). The particle distribution produced by automatic welding was found to be bimodal with an approximately lognormal distribution in the coarse mode (da ≥ 3.5 µm) containing 47.9% of the total mass. The coarse mode distribution had a mass mean aerodynamic diameter (MMAD) of 9.93 µm and GSD of 1.73 (Lin et al. Citation2015). Assuming the current configuration of the DRPS (1.5 mm inlet and 20 µm minimum detectable particle size) and the mean mass concentration for automatic welding (0.66 mg/m3), the flux of particles into the device is estimated to be 0.131 particles/s, or a particle every 7.6 s which is reasonable for practical field use. The maximum mass concentration (11.6 mg/m3) was measured for flux-cored arc welding (Lehnert et al. Citation2012). Using the same lognormal distribution parameters as the previous case with this mass concentration, the particle flux increases to 2.3 particles/s. This count rate would exceed the criterion for avoiding coincidence error based on the current design but the instrument could be modified accordingly. By reducing the inlet area by a factor of ∼3 (which would reduce the particle ingestion by ∼3 to ∼0.8 s−1) and reducing the Mie beam separation by a factor of ∼3 (which would increase the maximum allowed count rate by ∼3 to ∼0.9 s−1), the coincidence error limit would not be exceeded.
Finally, we note that room air currents could impact field performance of the current DRPS prototype, as particles will not settle vertically when local air velocities are high. This potential bias will be the subject of ongoing work, though we note that Baldwin and Maynard (Citation1998) surveyed wind currents across various occupational settings and reported that >85% of measurements were <0.1 m/s (Baldwin and Maynard Citation1998).
Conclusions
The prototype DRPS sampler was able to provide accurate single-particle measurements of aerodynamic diameter using a time-of-flight calculation over the 25–125 µm range when evaluated with spherical particles in laboratory conditions. The LIBS system was successfully integrated into the device without compromising the time-of-flight measurement. The ability to generate a laser plasma coincident with a settling particle and obtain spectra with characteristic emission lines of the analyte material was demonstrated with silver-coated glass and titanium microspheres. The focus of future work will be experimental evaluation of reduced beam separation and variable inlet diameter to determine the effect on LIBS detection efficiency. Additionally, the DRPS will be field tested with non-spherical and polydisperse aerosols.
Supplemental Material
Download MS Word (326.4 KB)Acknowledgment
The authors acknowledge Particles Plus Inc. for support with sampling hardware.
Additional information
Funding
References
- Alberti, A., A. Munafo, M. Koll, M. Nishihara, C. Pantano, J. B. Freund, G. S. Elliott, and M. Panesi. 2020. Laser-induced non-equilibrium plasma kernel dynamics. J. Phys. D Appl. Phys. 53 (2):025201. doi:10.1088/1361-6463/ab492a.
- Anderson, K. R., D. Leith, M. Ndonga, and J. Volckens. 2015. Novel instrument to separate large inhalable particles. Aerosol Sci. Technol. 49 (12):1195–209. doi:10.1080/02786826.2015.1112874.
- Baldwin, P. E. J., and A. D. Maynard. 1998. A Survey of Wind Speeds in Indoor Workplaces. Ann. Occup. Hyg. 42 (5):303–13. doi:10.1093/annhyg/42.5.303.
- Boyce, C. P., S. N. Sax, and J. M. Cohen. 2017. Particle size distributions of lead measured in battery manufacturing and secondary smelter facilities and implications in setting workplace lead exposure limits. J. Occup. Environ. Hyg. 14 (8):594–608. doi:10.1080/15459624.2017.1309046.
- Brieschenk, S., H. Kleine, and S. O'Byrne. 2013. The Effect of blast wave re-focusing on a laser-induced plasma. J. Appl. Phys. 113 (10):103101. doi:10.1063/1.4794017.
- Brown, J. S., T. Gordon, O. Price, and B. Asgharian. 2013. Thoracic and respirable particle definitions for human health risk assessment. Part Fibre Toxicol. 10 (1):12. doi:10.1186/1743-8977-10-12.
- Carranza, J. E., B. T. Fisher, G. D. Yoder, and D. W. Hahn. 2001. On-line analysis of ambient air aerosols using laser-induced breakdown spectroscopy. Spectrochim. Acta B At. Spectrosc. 56 (6):851–864. doi:10.1016/S0584-8547(01)00183-5.
- Cheng, Y. S., Y. Zhou, and B. T. Chen. 1999. Particle deposition in a cast of human oral airways. Aerosol Sci. Technol. 31 (4):286–300. doi:10.1080/027868299304165.
- Cremers, D. A., and L. J. Radziemski. 2013. Handbook of laser-induced breakdown spectroscopy. 2nd ed. Chichester, West Sussex, UK: John Wiley & Sons, Ltd.
- de Vocht, F., W. Sobala, U. Wilczynska, H. Kromhout, N. Szeszenia-Dabrowska, and B. Peplonska. 2009. Cancer mortality and occupational exposure to aromatic amines and inhalable aerosols in rubber tire manufacturing in Poland. Cancer Epidemiol. 33 (2):94–102. doi:10.1016/j.canep.2009.06.013.
- DeCarlo, P. F., J. G. Slowik, D. R. Worsnop, P. Davidovits, and J. L. Jimenez. 2004. Particle morphology and density characterization by combined mobility and aerodynamic diameter measurements. Part 1: theory. Aerosol Sci. Technol. 38 (12):1185–1205. doi:10.1080/027868290903907.
- Diwakar, P., P. Kulkarni, and M. E. Birch. 2012. New approach for near-real-time measurement of elemental composition of aerosol using laser-induced breakdown spectroscopy. Aerosol Sci. Technol. 46 (3):316–332. doi:10.1080/02786826.2011.625059.
- Fortes, F. J., A. Fernández-Bravo, and J. J. Laserna. 2014. Chemical characterization of single micro- and nano-particles by optical catapulting-optical trapping-laser-induced breakdown spectroscopy. Spectrochim. Acta B At. Spectrosc. 100:78–85. doi:10.1016/j.sab.2014.08.023.
- Harmon, R. S., F. C. DeLucia, C. E. McManus, N. J. McMillan, T. F. Jenkins, M. E. Walsh, and A. Miziolek. 2006. Laser-induced breakdown spectroscopy: an emerging chemical sensor technology for real-time field-portable, geochemical, mineralogical, and environmental applications. Appl. Geochem. 21 (5):730–747. doi:10.1016/j.apgeochem.2006.02.003.
- Heikkilä, P., J. Rossi, A. Rostedt, J. Huhtala, A. Järvinen, J. Toivonen, and J. Keskinen. 2020. Toward elemental analysis of ambient single particles using electrodynamic balance and laser-induced breakdown spectroscopy. Aerosol Sci. Technol. 54 (7):837–848. doi:10.1080/02786826.2020.1727408.
- Hinds, W. C. 1999. Aerosol technology: properties, behavior, and measurement of airborne particles. 2nd ed. New York: Wiley.
- ISO. 1995. Particle Size Fraction Definitions for Health-Related Sampling. ISO 7708. https://www.iso.org/obp/ui/#iso:std:iso:7708:en.
- Järvinen, S. T., and J. Toivonen. 2016. Analysis of single mass-regulated particles in precisely controlled trap using laser-induced breakdown spectroscopy. Opt. Express 24 (2):1314–1323. doi:10.1364/oe.24.001314.
- Jayne, J. T., D. C. Leard, X. Zhang, P. Davidovits, K. A. Smith, C. E. Kolb, and D. R. Worsnop. 2000. Development of an aerosol mass spectrometer for size and composition analysis of submicron particles. Aerosol Sci. Technol. 33 (1–2):49–70. doi:10.1080/027868200410840.
- Kim, G., K. Kim, H. Maeng, H. Lee, and K. Park. 2019. Development of aerosol-LIBS (laser induced breakdown spectroscopy) for real-time monitoring of process-induced particles. Aerosol Air Qual. Res. 19 (3):455–460. doi:10.4209/aaqr.2018.08.0312.
- Kramida, A., K. Olsen, and Y. Ralchenko. 2019. NIST LIBS Database. National Institute of Standards and Technology (NIST). https://physics.nist.gov/PhysRefData/ASD/LIBS/libs-form.html.
- Kumar, A. U., B. S. Leonov, Y. Wu, and C. Limbach. 2021. Spatio-temporal studies on laser induced plasma interactions with micro-particles using stereo-imaging. Paper presented at the AIAA Q2 Scitech 2021 Forum, Virtual Event, January 19–21. doi:10.2514/6.2021-1376.
- Lehnert, M., B. Pesch, A. Lotz, J. Pelzer, B. Kendzia, K. Gawrych, and E. Heinze. 2012. Exposure to inhalable, respirable, and ultrafine particles in welding fume. Ann. Occup. Hyg. 56 (5):557–567. doi:10.1093/annhyg/mes025.
- Li, K., F. Aghazadeh, S. Hatipkarasulu, and T. G. Ray. 2003. Health risks from exposure to metal-working fluids in machining and grinding operations. Int. J. Occup. Saf. Ergon. 9 (1):75–95. doi:10.1080/10803548.2003.11076555.
- Lidén, G., L. Juringe, and A. Gudmundsson. 2000. Workplace validation of a laboratory evaluation test of samplers for inhalable and “total” dust. J. Aerosol Sci. 31 (2):199–219. doi:10.1016/S0021-8502(99)00049-X.
- Lin, C. C., M. R. Chen, S. L. Chang, W. H. Liao, and H. L. Chen. 2015. Characterization of ambient particles size in workplace of manufacturing physical fitness equipments. Ind. Health. 53 (1):78–84. doi:10.2486/indhealth.2014-0160.
- Linnainmaa, M., J. Laitinen, A. Leskinen, O. Sippula, and P. Kalliokoski. 2008. Laboratory and field testing of sampling methods for inhalable and respirable dust. J. Occup. Environ. Hyg. 5 (1):28–35. doi:10.1080/15459620701763723.
- Manninen, A., M. Putkiranta, A. Rostedt, J. Saarela, T. Laurila, M. Marjamäki, J. Keskinen, and R. Hernberg. 2008. Instrumentation for measuring fluorescence cross sections from airborne microsized particles. Appl. Opt. 47 (2):110–115. doi:10.1364/AO.47.000110.
- OSHA. 2005. “Permissible Exposure Limits (PELs).” http://www.osha.gov/SLTC/pel/.
- Panne, U., R. E. Neuhauser, M. Theisen, H. Fink, and R. Niessner. 2001. Analysis of heavy metal aerosols on filters by laser-induced plasma spectroscopy. Spectrochim. Acta B At. Spectrosc. 56 (6):839–850. doi:10.1016/S0584-8547(01)00209-9.
- Pinnick, R. G., J. M. Rosen, and D. J. Hofmann. 1973. Measured light-scattering properties of individual aerosol particles compared to mie scattering theory. Appl. Opt. 12 (1):37–41. doi:10.1364/ao.12.000037.
- Salvaggio, J. E. 1994. Inhaled particles and respiratory disease. J. Allergy Clin. Immunol. 94 (2):304–309. doi:10.1053/ai.1994.v94.a56009.
- Schneider, C. A., W. S. Rasband, and K. W. Eliceiri. 2012. NIH Image to ImageJ: 25 years of image analysis. Nat. Methods. 9 (7):671–675. doi:10.1038/nmeth.2089.
- Su, Y. Y., Z. M. Li, M. Li, X. W. Yi, G. Q. Zhou, J. Xu, L. H. Zhai, G. Y. Wei, and F. R. Zhu. 2014. Development of aerosol sample introduction interface coupled with ICP-MS for direct introduction and quantitative online monitoring of environmental aerosol. Aerosol Sci. Technol. 48 (1):99–107. doi:10.1080/02786826.2013.861894.
- Tjärnhage, T., P. Gradmark, A. Larsson, A. Mohammed, L. Landström, E. Sagerfors, P. Jonsson, F. Kullander, and M. Andersson. 2013. Development of a laser-induced breakdown spectroscopy instrument for detection and classification of single-particle aerosols in real-time. Opt. Commun. 296:106–108. doi:10.1016/j.optcom.2013.01.044.
- Voisey, K. T., S. S. Kudesia, W. S. O. Rodden, D. P. Hand, J. D. C. Jones, and T. W. Clyne. 2003. Melt ejection during laser drilling of metals. Mater. Sci. Eng. A. 356 (1–2):414–424. doi:10.1016/S0921-5093(03)00155-2.
- Volckens, J., and T. M. Peters. 2005. Counting and particle transmission efficiency of the aerodynamic particle sizer. J. Aerosol Sci. 36 (12):1400–1408. doi:10.1016/j.jaerosci.2005.03.009.
- Volkwein, J. C., A. D. Maynard, and M. Harper. 2011. Workplace aerosol measurement. In Aerosol measurement: principles, techniques, and applications, ed. P. Kulkarni, P. A. Baron, and K. Willeke, 3rd ed., 571–590. Hoboken, NJ: John Wiley and Sons. doi:10.1002/9781118001684.ch25.
- Wilschefski, S., and M. Baxter. 2019. Inductively Coupled Plasma Mass Spectrometry: Introduction to Analytical Aspects. Clin. Biochem. Rev. 40 (3):115–133. doi:10.33176/aacb-19-00024.
- Xiong, G., S. Li, Y. Zhang, S. G. Buckley, and D. T. Stephen. 2016. Phase-selective laser-induced breakdown spectroscopy of metal-oxide nanoparticle aerosols with secondary resonant excitation during flame synthesis. J. Anal. At. Spectrom. 31 (2):482–491. doi:10.1039/C5JA00186B.
- Youlden, D. R., S. M. Cramb, S. Peters, S. V. Porceddu, H. Møller, L. Fritschi, and P. D. Baade. 2013. International comparisons of the incidence and mortality of sinonasal cancer. Cancer Epidemiol. 37 (6):770–779. doi:10.1016/j.canep.2013.09.014.