
 ?Mathematical formulae have been encoded as MathML and are displayed in this HTML version using MathJax in order to improve their display. Uncheck the box to turn MathJax off. This feature requires Javascript. Click on a formula to zoom.
Abstract
Momentum transfer from nasal spray droplets to the surrounding gas may create droplet cloud motion and influence nasal deposition patterns. The objective of this study was to develop a validated computational fluid dynamics (CFD) model of nasal spray deposition for two different spray-pump designs that includes cloud motion effects (i.e. two-way coupling) in a computationally efficient manner. Spray droplet transport and deposition were simulated in an average adult nasal airway model (that captures average drug delivery) using both two-way coupled and one-way coupled Euler-Lagrange frameworks. CFD model accuracy was established by comparing predictions of the two-way and one-way modeling frameworks with in vitro measurements. The two-way coupled simulation showed that momentum from the spray cloud resulted in displacement of surrounding gas, leading to an upward air velocity in the direction of the spray, which significantly increased the travel distance of smaller droplets with diameters equal to a median diameter of ∼70 µm and below. For the Flonase Sensimist spray pump, two-way coupling produced <10% relative error in posterior deposition fraction compared with the in vitro data, versus 47% relative error using one-way coupling. For the Flonase spray pump, two-way coupling did not improve posterior deposition agreement with both methods having a relative error of ∼30%; however, two-way coupling showed substantial increase in posterior deposition. As a result, two-way coupling is likely needed for the simulation of most nasal spray pumps and additional factors may be important to better capture final formulation distribution of the Flonase product, like post-deposition liquid motion.
Copyright © 2021 American Association for Aerosol Research
EDITOR:
1. Introduction
Delivering pharmaceutical formulations in aerosol form directly to the nose is an attractive approach to combat diseases and disorders such as allergic rhinitis, sinusitis, nasal polyposis and migraines (Djupesland Citation2013; Dykewicz and Hamilos Citation2010; Le Guellec, Ehrmann, and Vecellio Citation2021). Nasal spray pumps are commonly used as drug delivery systems to administer locally acting pharmaceutical formulations to the nasal mucosa (Macias-Valle and Psaltis Citation2020). In addition to the already approved and marketed nasal spray innovator and generic products, many new and generic products are under development (Choi et al. Citation2018; Li et al. Citation2013). Furthermore, investigations are underway to deliver medications and vaccines to the nasal airways to combat SARS-CoV-2 and other respiratory viruses (Csaba, Garcia-Fuentes, and Alonso Citation2009; Wilkins et al. Citation2021; Zhang et al. Citation2020). Hence, it is important to develop and improve strategies for testing nasal spray device drug delivery performance under variable usage conditions (Newman, Pitcairn, and Dalby Citation2004).
The delivery efficiency of a nasal spray system, which is estimated as the amount of drug delivered from the device to the intended site of action, typically the posterior nasal region, is dependent on the device, drug formulation, patient-related factors such as inhalation conditions, and the nasal geometry (Gao, Shen, and Mao Citation2020; Kimbell et al. Citation2007; Kundoor and Dalby Citation2011; Suman et al. Citation2002). Quantitative and qualitative testing of nasal sprays is a critical step in the product development process for analyzing the device performance and ensuring device safety and efficacy. In vivo testing, including radiolabeled imaging or plasma concentration measurements, may provide clinically relevant data (Newman, Pitcairn, and Dalby Citation2004); however, it can be challenging and expensive. In vitro testing can provide details regarding the performance of specific device and formulation combinations in terms of different spray parameters, also referred to as in vitro test metrics (Dayal et al. Citation2005; Fung et al. Citation2013; Grmaš et al. Citation2017; Guo et al. Citation2008; Inthavong et al. Citation2015; Laube et al. Citation2015; Liu, Doub, and Guo Citation2010; Pennington et al. Citation2008; Sosnowski et al. Citation2020). For evaluating generic nasal spray/aerosol systems that target local action, the U.S. Food and Drug Administration (FDA) Draft Guidance on Bioavailability and Bioequivalence Studies for Nasal Aerosols and Nasal Sprays for Local Action recommends in vitro testing approaches (U.S. FDA Citation2003).
Recent in vitro testing and experimental visualization studies using realistic nasal airway geometries have helped to understand the different factors influencing drug delivery to the nasal airways (Chen et al. Citation2020; Foo et al. Citation2007, Citation2018; Frank et al. Citation2012; Hosseini et al. Citation2019; Kundoor and Dalby Citation2010; Manniello et al. Citation2021; Pu et al. Citation2014; Sawant and Donovan Citation2018; Suman, Laube, and Dalby Citation2006; Tong et al. Citation2016; Warnken et al. Citation2018; Xi et al. Citation2016). For example, Manniello et al. (Citation2021) highlighted the importance of including the nasal airway anatomy in determining drug delivery to the posterior region and showed that posterior regional deposition is sensitive to differences in nasal anatomy. In this study, the regional deposition fractions showed high variability among 40 nasal models with an average standard deviation of more than 20% for Flonase and 15% for Flonase Sensimist. This study also showed that the interaction of the device with the nose affected the final deposition patterns.
In silico testing using computational fluid dynamics (CFD) guided with in vitro measurements is another approach which can reduce the time and cost associated with device testing (Feng et al. Citation2021; Koullapis et al. Citation2021; Longest and Holbrook Citation2012; Walenga, Babiskin, and Zhao Citation2019). CFD modeling is based on a first principles transport approach, which makes it an efficient research tool to evaluate the nasal spray product performance in realistic nasal airway models under variable usage conditions (Corley et al. Citation2012; Kannan et al. Citation2017; Kleinstreuer, Zhang, and Donohue Citation2008; Longest, Bass et al. Citation2019). Recent CFD investigations have helped to characterize nasal spray pump performance and evaluate drug delivery to the nasal cavities (Basu et al. Citation2020; Chari et al. Citation2021; Inthavong et al. Citation2011; Kiaee et al. Citation2019; Kimbell et al. Citation2007; Rygg, Hindle, and Longest Citation2016a; Rygg, Hindle, and Longest Citation2016b). While these studies highlight the use of CFD for nasal spray testing, there are additional modeling challenges that need to be addressed.
During actuation, a nasal spray pump atomizes the liquid formulation and generates droplets (Liu, Doub, and Guo Citation2010). Nasal spray pumps produce relatively large droplets with diameters typically larger than 10 µm. Moreover, the droplet ejection velocity is relatively high, with droplet speeds reaching above 10 m/s (Fung et al. Citation2013; Inthavong et al. Citation2014; Inthavong et al. Citation2015; Kolanjiyil et al. Citation2021; Liu, Doub, and Guo Citation2011; Manniello et al. Citation2021). Injection of relatively large droplets with high velocity leads to high momentum transport in the dispersed phase. This momentum is exchanged with the surrounding medium during the transport process, which again affects further transport of the dispersed phase.
Only a limited number of studies have modeled this cascade (or two-way coupled) effect, while simulating delivery of pharmaceutical drug aerosols using spray systems. For example, Longest and Hindle (Citation2009) used a two-way coupled Euler-Lagrange approach to simulate the Respimat soft mist inhaler spray and showed that the droplet transport with momentum exchange can be approximated using an air-jet. Later, Fung et al. (Citation2012) reported a preliminary comparison of spray axial velocity from a two-way coupled spray transport simulation with a one-way coupled simulation. Rygg, Hindle, and Longest (Citation2016a, Citation2016b; Rygg and Longest 2016) simulated the effect of momentum exchange during nasal spray transport using an air-jet with velocity to match the in vitro droplet velocity measurements, following the approach from Longest and Hindle (Citation2009). Recently, Kolanjiyil et al. (Citation2021) simulated nasal spray droplet transport with momentum exchange in an open geometry and showed that the momentum exchange creates a cloud like motion of smaller droplets together with a momentum-jet. This cloud motion influenced the transport of droplets with size equal to the spray volume median diameter (VMD) and smaller. In addition, it was shown that the two-way coupled Euler-Lagrange approach accurately captured the spray plume progression, while the one-way coupled Euler-Lagrange approach under-predicted the distance traveled by the spray plume.
The objective of this study is to develop a validated computational fluid dynamics (CFD) model of nasal spray deposition for two different spray pump designs that includes cloud motion effects (i.e. two-way coupling) in a computationally efficient manner. As described, the previous study of Kolanjiyil et al. (Citation2021) developed approaches to capture two-way momentum coupling for nasal sprays in an open environment, but did not explore the associated effects on deposition in a nasal cavity model. As mentioned earlier, other previous nasal spray simulation studies have only approximated two-way momentum coupling effects, such as with high initial droplet velocities or simulated air jets but have not attempted to capture this complex physical phenomenon from a first principles perspective. This study is the first to attempt direct simulation of two-way coupled cloud motion from nasal sprays in a nasal cavity geometry. While computationally expensive, the previous study of Kolanjiyil et al. (Citation2021) implied that two-way momentum coupling may have a significant impact on the total and regional nasal deposition of nasal sprays. Through comparison with in vitro nasal deposition data for two different spray pumps, theoretically generating different levels of two-way momentum exchange, this study will seek to determine if two-way coupling should be included in future studies of nasal spray transport and deposition. Furthermore, computationally efficient methods to approximate two-way momentum coupling while also capturing important aspects of this complex physical phenomenon are also explored.
2. Materials and methods
2.1. Nasal airway model
The nasal airway geometry used in this study was selected from an in-house set of 20 adult healthy nasal geometries (40 nasal cavities) that were extracted from computer tomography (CT) scans as part of a larger study to identify a range of representative nasal models based on nasal spray deposition (Hosseini et al. Citation2020; Manniello et al. Citation2021). The nasal airway was selected from the representative nasal models based on an average volume-to-surface area ratio among the 20 sampled adult nasal models. The average volume-to-surface area ratio parameter and similar geometrical parameters of nasal airways have previously been associated with average nasal deposition (Carrigy et al. Citation2014; Storey-Bishoff, Noga, and Finlay Citation2008; Walenga et al. Citation2014). The selected model was Subject 16, who was a 22 years old female (Hosseini et al. Citation2020). The associated nasal surface area and volume values after including the nasopharyngeal region and excluding the sinus cavities were 18,760 mm2 and 25,900 mm3, respectively.
shows the interior surface of the nasal airway that was implemented in the CFD and in vitro studies. The CT extracted nasal geometry in stereolithographic (STL) format was refined and translated to a CAD accessible model by reducing thousands of STL triangles to approximately 100 CAD-format surfaces. This was achieved by manually fitting polygonal patches consisting of b-splined surfaces, conforming to the faceted surfaces (Bass et al. Citation2019). This step made it possible to do CAD processing with any third-party CAD software. The nasal model was then converted to produce 3D printed models that were used for in vitro testing. The 3D printed nasal models were fabricated with high clarity rigid plastic (Accura ClearVue with standard finish), utilizing 3D Systems Quickparts printing (3D Systems, USA) (Hosseini et al. Citation2019; Manniello et al. Citation2021). shows the 3D printed hollow model used in the in vitro experiments. shows the in vitro setup with the spray pump inserted into the nostril, for measuring spray deposition. A novel feature of the in vitro nasal model was adding a 3D printed adapter/positioner ring made of the same material (with a thickness of approximately 1 mm) placed in the anterior nose region that accepted the tip of the spray pump and positioned it at a known and controllable location, angle and insertion depth ( and ). The spray adapter design was built into the anterior nasal portion of the in vitro model and was fabricated as a single piece, so that the spray could be inserted without deforming the nasal anatomy. While the adapter ring thickness slightly occluded the nostril opening, the thickness was small enough to ensure ample open area for nasal inhalation. For testing different spray positions, different adapter designs can be fabricated into the anterior nasal region. Considering that the anterior region is smaller in size compared with the posterior part of the model, multiple anterior parts can be fabricated for each spray position. The 3D printed adapter also ensured that the spray pump positioning was identical between the CFD model and the experiments.
Figure 1. (a) Nasal airway geometry. (b) In vitro model with the spray pump adapters. (c) Setup for spray actuation and in vitro deposition measurement. Images showing the (d) head angle and (e) coronal angle for a nasal spray insertion in a representative nasal geometry.
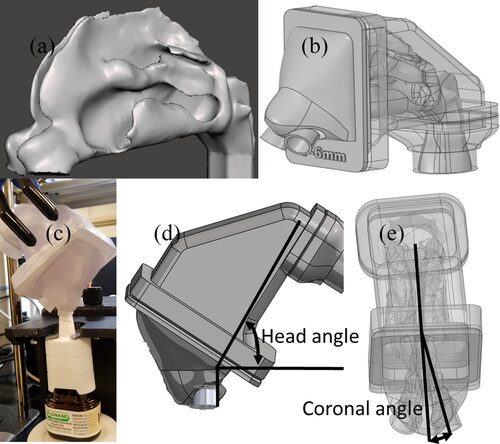
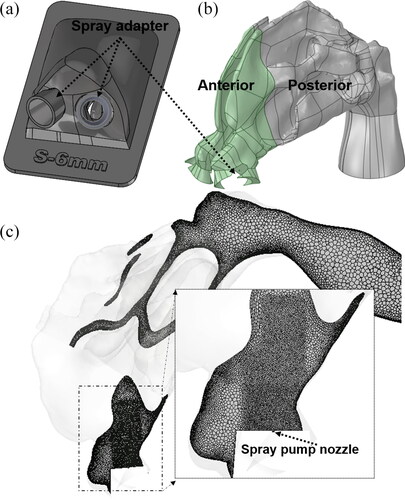
Figure 2. (a) Spray adapters placed into the nostrils to guide and position the spray pumps. (b) CFD nasal airway model after pump volume subtraction. (c) Mesh for the nasal model with localized refinements near spray nozzle.
The spray pumps were inserted into the left nasal cavity and aligned with the approximate center of the downstream nasal valve, thereby avoiding direct impaction of spray droplets on the anterior nasal walls. The spray pump insertion depth from the nostril plane was 6 mm, head angle was 60°, and coronal angle was 12°. The head and coronal angles are the administration angles as defined in . The head angle captures the head tilt with respect to the spray bottle and coronal angle captures the spray pump axis with respect to the nasal septum. Further information on the specifics of measuring head and coronal angles are provided in Manniello et al. (Citation2021). Both CFD simulations and experiments were first performed without the nasal inhalation flow condition (spray actuated into a quiescent air field) to isolate and study the interaction between the spray droplets and surrounding air without surrounding flow from inhalation. Simulations and experiments were also performed in conjunction with a nasal inhalation flow to study the influence of the subject’s inhalation on spray droplet transport. The inhalation profile used was the recommended “gently sniffing” pattern with a peak volumetric flowrate of 20.2 L/min, suggested to be used during the actuation of both types of nasal sprays (Guo, Laube, and Dalby Citation2005; Manniello et al. Citation2021). For spray with nasal inhalation flow, the in vitro experiments were conducted with the full inhalation profile (spray was actuated at the beginning of the inhalation flow) and the simulations were performed with a quasi-steady state assumption that implemented the maximum inhalation flow rate that occurred during the spray actuation.
The nasal airway volume for the CFD model and the in vitro model were divided into anterior and posterior regions based on a coronal slice cut at the first (anterior) occurrence of the middle turbinate (see ) (Kolanjiyil et al. Citation2020). As shown in , the spray pump adapters were constructed into the anterior nasal volume with space available for entrance airflow between the adapter and nostril walls. In the CFD model, the volumes occupied by the spray pump and the adapter were subtracted from the nasal airway volume, to account for the presence of the pump and the adapter during the airflow and droplet transport simulation (). Subtraction of the spray pump and adapter volumes reduced the nostril inlet and realistically captured the insertion of the spray pump in the CFD models, identical to the in vitro setup.
2.2. Experimental measurements to characterize the nasal sprays and in vitro nasal deposition
In this study, two commercially available locally acting glucocorticosteroid nasal sprays, Flonase® (active ingredient—fluticasone propionate) and Flonase® Sensimist™ (active ingredient—fluticasone furoate) (Glaxo-SmithKline Consumer Healthcare, Warren, NJ), were selected as representative products. For the in vitro deposition measurements, the Flonase Sensimist spray pump was hand actuated and Flonase spray pump was actuated (actuation force 7.2 kgf) using the MightyRunt® actuation station (InnovaSystems, Inc., Moorestown, NJ, USA), keeping the spray bottles in the vertical direction (following spray pump “instructions to use,” which recommend tilting the head forward slightly while keeping the bottle upright), as shown in (Manniello et al. Citation2021). The anterior and posterior deposition fractions (%) were defined as a percentage of the drug mass deposited in specific regions to the total deposited drug mass in the entire model. In vitro experimental setups and procedures for measuring the Flonase and Flonase Sensimist spray deposition in the nasal model are detailed in previous publications (Hosseini et al. Citation2019; Manniello et al. Citation2021). The in vitro experiments reported that the escaped mass fraction through the model outlet (based on drug mass on the filter attached to the outlet) was zero for all the in vitro spray deposition measurements, due to the very small drug mass, if any. Hence, the in vitro deposition fractions in the anterior and posterior regions were calculated based on the deposition in the anterior region, posterior region, spray nozzle and drip. For example,
(1)
(1)
Additional in vitro tests were performed that provided initial and boundary conditions for the CFD spray models (Manniello et al. Citation2021). These tests included measurement of density of the spray formulation, spray cone angle (high-speed imaging, Phantom Miro ex2; Ametek), shot-weight, droplet velocity measured at 3 cm from the spray tip (Phase Doppler Particle Anemometry, Powersight PDPA; TSI) and the emitted spray droplet size distribution (Spraytec, Malvern Instruments, Inc.) for each spray pump. Further details on the experimental setup and procedures are reported in Manniello et al. (Citation2021). provides the results from these measurements. Flonase Sensimist had a wider spray plume with cone angle of 35°, while the Flonase spray cone was 28°. On actuation, Flonase Sensimist spray emitted 56.3 mg of liquid within a span of 50 ms, while Flonase spray pump emitted 94.5 mg within a span of 95 ms. The spray duration of Flonase Sensimist was measured using the high speed images and the spray duration of Flonase was measured using the Spraytec, following the corresponding actuation conditions. The droplet size distributions of Flonase (VMD = 64 µm) and Flonase Sensimist (VMD = 66 µm) sprays were similar, as shown in (Manniello et al. Citation2021). These test procedures are described in more detail in previous publications (Hosseini et al. Citation2019; Manniello et al. Citation2021).
Figure 3. (a) Droplet diameter distribution for Flonase Sensimist and Flonase. (b) Representative Flonase Sensimist spray droplet injection profile captured inside the nasal cavity at 0.005 s after actuation.
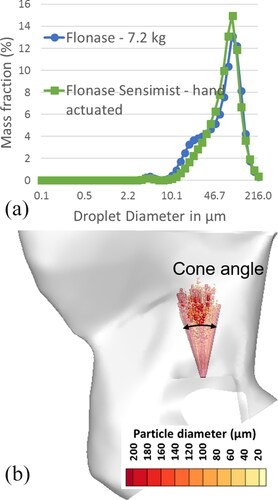
Table 1. In vitro characterization [mean and (standard deviation—SD)] of Flonase and Flonase Sensimist sprays (Hosseini et al. Citation2019; Manniello et al. Citation2021).
2.3. Nasal spray simulation
The computational domain representing the nasal airway volume was discretized using polyhedral elements in Fluent Meshing 19.0 (ANSYS Inc., Canonsburg, PA, USA) as shown in . It was observed that the local mesh density in the anterior region (near the spray tip) influenced the droplet trajectories. For capturing the high droplet laden flow characteristics near the spray nozzle, the mesh in this region was highly refined. Meshes with ∼2 million polyhedral elements per nasal cavity, excluding the nasopharyngeal region, together with near-wall prism elements and a refined mesh in the spray nozzle tip vicinity achieved mesh independent spray particle deposition (). Additionally, to capture the near-wall flow dynamics, the near-wall region was refined with five near-wall prism layer mesh elements. The first prism layer thickness was specified to give an average wall y + of approximately one and the remaining layers were generated by specifying a growth rate of ∼1.2. Current meshing parameters were verified to be mesh independent by comparing the regional deposition predicted using meshes with different mesh densities. Increasing the mesh size by a factor of 2 resulted in less than 1% difference in the regional spray deposition results. Further details on meshing parameters for modeling nasal sprays are detailed in Kolanjiyil et al. (Citation2021).
Based on previous nasal spray analysis comparing different modeling approaches, the spray transport was modeled using an Euler-Lagrange framework, comparing one-way momentum coupled and two-way momentum coupled results (Kolanjiyil et al. Citation2021). In the Euler-Lagrange framework, the carrier-fluid (air) is modeled in an Eulerian reference frame, while the dispersed-phase droplets are modeled in a Lagrangian reference frame. Details on the modeling approaches are provided in Kolanjiyil et al. (Citation2021). The initial and boundary conditions of the CFD models were based on measurements from the in vitro experiments (Manniello et al. Citation2021). Specifically, the spray droplets were injected with the measured polydisperse droplet size distributions (), cone angle, spray mass flow rate and a turbulent velocity profile with an average velocity matching the experimentally measured value for each spray pump. shows a representative Flonase Sensimist spray droplet injection profile, where randomly distributed droplets were injected from the nozzle orifice tip. The droplets were injected with an initial spray velocity assuming a turbulent velocity profile at the nozzle orifice. The nozzle orifice diameter was 300 µm for both sprays. The turbulent velocity profile was selected after a comparative analysis of the predicted plume progression with the in vitro plume progression measurements (Kolanjiyil et al. Citation2021). The selection of a solid cone injection profile (in contrast with a hollow cone) was based on the top-down view of the spray dispersion from both spray pumps, which showed high liquid concentration in the spray plume center for both sprays (see in Hosseini et al. Citation2019). In the two-way coupled Lagrangian model, the droplets were injected with a predetermined mass flow rate so that the net mass of the liquid droplets injected was equal to the shot weight of the spray (Kolanjiyil et al. Citation2021). In order to replicate the in vitro procedure, CFD deposition fractions in the anterior and posterior regions were calculated following the approach used in the in vitro procedure. Specifically, anterior and posterior deposition fractions were estimated based on deposition in the entire model, neglecting the outlet escape fraction. As with the experiments, CFD results also indicted that the model outlet escaped fraction was very small (∼0.5%). The only exception to <1% escaped fraction predicted by CFD was for one-way coupled Flonase Sensimist with nasal inhalation flow, which had 2.8% escaped mass fraction. In this one case, the escaped mass fraction was put into the posterior deposition fraction to allow reporting consistent with the experiments.
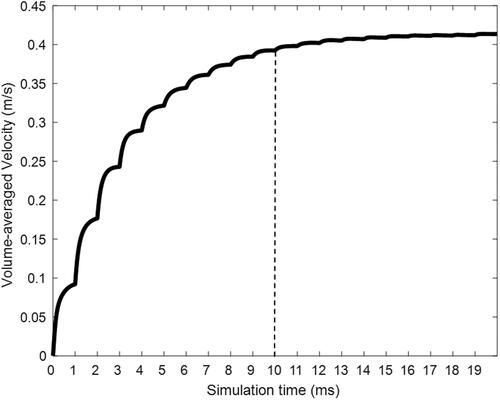
Figure 4. Change in volume-averaged velocity in the nasal model vs. spray time.
A parcel-based approach was used for the droplet transport modeling in which each parcel is a representative fraction of the total injected liquid droplets in multiple distinct droplet diameter bins at each injection time step (Longest and Hindle Citation2009). The droplets were assumed to deposit and remain fixed at the location where they contacted the airway surface or spray pump surface. The trajectory of a parcel is determined by tracking a droplet in the parcel with the specified diameter and mass flow rate. In both the one-way and two-way coupled Lagrangian simulations, the droplets were injected continuously into the Eulerian domain at each flow time-step for the entire spray duration. The parcel injection rate for the Lagrangian simulations were 500 polydispersed droplet parcels per time-step (10 parcels per diameter bin per time-step), which resulted in a total of 25,000 and 47,500 injected parcels for the Flonase Sensimist and Flonase simulations. Previous results showed that increasing the droplet injection rate by a factor of 2 resulted in similar plume progression with maximum difference less than 1% (Kolanjiyil et al. Citation2021). Additionally, previous results showed that randomizing the injection profile within each time-step did not show any significant difference in the spray plume progression (Kolanjiyil et al. Citation2021).
To reduce the computational time and resources required for two-way coupled simulations, a quasi two-way coupled approach and a momentum transfer approach were introduced (Kolanjiyil et al. Citation2021). In the quasi two-way coupled approach, the velocity field due to the momentum exchange was frozen at a particular time, then the full spray liquid mass was injected into this frozen velocity field, using one-way coupled droplet tracking (Kolanjiyil et al. Citation2020). In the momentum transfer approach, the momentum exchange from a two-way coupled simulation in a geometrically simpler model was transferred to the nasal model as a momentum source term to simulate the two-way coupled effect of spray droplets on the surrounding air medium. The geometrically simpler model was taken to be a frustum of a cone that encapsulated the spray for a length of 6 cm. In this model, the spray actuation and droplet transport were simulated for 10 ms and the two-way coupled momentum source from this model was transferred into the nasal model, using the spray nozzle tip as the reference point. Further details are provided in Section 3.7 and Section 3.8 of Kolanjiyil et al. (Citation2021). For the quasi two-way coupled simulation, the parcel injection rate was 20,000 polydisperse droplet parcels at one time-step.
In the Lagrangian spray transport simulations, the major forces acting on each droplet were drag and gravity (in the vertical direction) and for the two-way coupled simulations, the interphase forces were taken into account through momentum source terms (Kolanjiyil et al. Citation2021). In one of the spray transport simulations, the influences of turbulent dispersion on droplet trajectories and associated nasal deposition patterns were investigated. The droplet turbulent dispersion was approximated using an eddy interaction model that stochastically recreated turbulent eddy structures and predicted associated chaotic motion of particles as a random walk. Further details describing modeling the turbulent dispersion of droplets and best modeling practices can be found in Bass and Longest (Citation2018). Based on the comparative analysis of the droplet transport and nasal spray deposition with and without the turbulent dispersion force for this simulation case, remaining simulations were performed without the turbulent dispersion forces. To add the turbulent dispersion force, user defined functions (UDFs) were used to incorporate droplet turbulent dispersion modified with the anisotropic fluctuating velocity components and accurate droplet-wall hydrodynamic interactions by damping the wall-normal velocity in the near-wall region, following our previously established modeling methods (Longest, Farkas, et al. Citation2019). Furthermore, the velocity and turbulence field quantities for the droplet tracking were interpolated at the particle location instead of using cell centroid values. Further details on the particle tracking with turbulent dispersion can be found in Bass and Longest (Citation2018) and Longest, Bass, et al. (Citation2019).
2.4. Numerical methodology
CFD simulations were performed using Fluent 19.0 (ANSYS Inc., Canonsburg, PA, USA). The Reynolds number was estimated for the two-way coupled spray simulations based on the hydraulic diameter of the nasal valve plane and also with respect to the average nasal dimension based on the volume to surface area ratio. Based on the area-averaged velocity at the nasal valve plane, the Rearea-averaged velocity was 1340 and based on the maximum velocity, the Remaximum velocity was 8650. Based on the average nasal dimension, the Revolume/area was 1500. Considering the high maximum Reynolds number value and the large recirculatory flow behavior in the nasal spray simulations from the momentum exchange, the computations were performed using a transient incompressible low-Reynolds number (LRN) k-ω turbulence flow solver (Bass and Longest Citation2018; Longest, Bass et al. Citation2019). The flow equations were solved using a solver time-step value of 10−3 s with a maximum number of iterations per time step of 1200 and the solution was deemed to be converged when all the mass and momentum residuals dropped by at least three orders of magnitude and did not change with further iterations. The influence of time step on solution was investigated by simulating and comparing the plume progression of the two-way coupled Flonase droplet transport using a time step of 10−3 with another simulation using a time step of 5*10−4 s, which is close to the characteristic time of spray breakup initiation (calculated as t* = (d/Δv) (ρl/ρg)1/2 where d is characteristic spray length, Δv is the relative spray velocity, ρl and ρg are the liquid and gas densities) (Kolanjiyil et al. Citation2021). The simulation results showed that plume progression was mostly overlapping with a maximum difference less than 1%. However, increasing the time-step showed solution residual convergence issues. Hence, a solver time-step value of 10−3 s was selected for this study. In addition to tracking the mass and momentum residuals, volume-average velocity over the entire flow domain was also tracked at each time step and the solution was deemed converged when the volume-averaged velocity profile plateaued during each time step. Additionally, velocity contours in one of the coronal slice planes was tracked between iterations within time steps, and convergence was verified when the velocity field in the planes did not change with further iterations (Longest, Farkas, et al. Citation2019). Details on the governing equations, solver settings and additional details on the CFD procedure are available in Rygg and Longest (Citation2016) and Kolanjiyil et al. (Citation2021).
3. Results
3.1. Spray deposition in left nasal cavity
3.1.1. Two-way coupled spray simulation
To illustrate two-way coupled nasal spray transport with Flonase Sensimist, spray conditions were first considered under no inhalation flow conditions. Physical time for the transient Flonase Sensimist spray transport consisted of simulation with spray droplet injection for the measured spray duration of 50 ms, followed by an additional 10 ms of airborne spray droplet tracking. Further increase in the simulation time for additional airborne droplet tracking had a negligible impact on the nasal deposition results. The fully transient two-way coupled Flonase Sensimist spray transport simulation covered the spray duration of 60 ms and required approximately 1300 core hours of computational time. In addition to residual convergence monitoring, the volume-averaged value of velocity (averaged over the entire flow domain) was monitored to ensure a sufficient number of iterations within a specific time-step to adequately resolve the flow field in smaller cells near the nozzle tip. shows the calculated volume-averaged velocity plotted against the simulation time during a two-way coupled simulation. Within each simulation time-step (expressed in milliseconds; ms), the plot shows the volume-averaged velocity calculated during each solution iteration. The volume-averaged velocity steadily increased during the initial time-steps, because of the momentum transfer from the spray droplets, and plateaued around 10 ms.
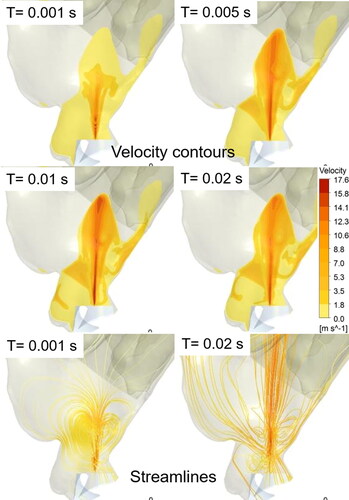
In the two-way coupled spray droplet simulation, the exchange of momentum between the spray droplets and the air-molecules was taken into account. This momentum exchange drove the air-molecules (primary phase) in the direction of the injected droplets, which led to a visible air-jet velocity profile (or “momentum-jet”). shows the velocity contours on the sagittal plane, depicting the development of a momentum-jet due to the momentum transfer from the spray droplets to the surrounding air at specific simulation time-steps with Flonase Sensimist. The momentum-jet profile follows the spray plume, and the velocity magnitude of the momentum-jet is comparable to the injected droplet velocity with peak velocity in the vicinity of the spray nozzle tip. At 1 ms, the spray plume and consequently the momentum-jet traversed up to the nasal valve region. Within 5 ms, the momentum-jet traversed the anterior region with recirculating flow patterns around the momentum-jet core and within 10 ms the momentum-jet developed a stable jet core. The magnitude of the recirculatory flows around the jet core compared to the jet velocity reduced with the increase in spray time (as depicted using the streamlines in the bottom figure panels in ).
Figure 5. Development of the momentum-jet at specific simulation times.
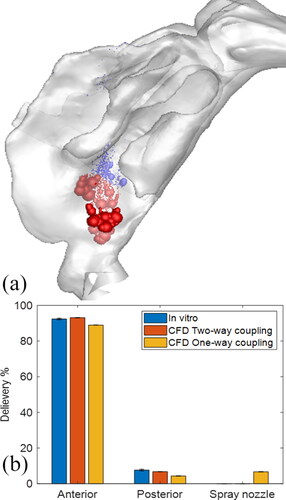
Together with the spray transport and momentum-jet simulation, the spray deposition profiles in specific nasal regions were predicted. shows the location of the Flonase Sensimist spray droplet deposition in the nasal airway model with no inhalation. The spray deposition results indicate that a higher percentage of the spray droplets deposit in the anterior region due to the high inertial forces. In addition to the two-way coupled approach, simulation was also performed assuming a one-way coupled approach, where the spray droplets are not interacting with the air-phase. Under the no-flow inhalation condition, the droplets were injected into a zero magnitude velocity field. The spray droplet transport models using one-way and two-way coupled Lagrangian model predictions were compared with in vitro experimental measurements under identical conditions. shows the comparison of the in vitro spray deposition measurements with the two-way and one-way coupled spray transport simulation predictions. For Flonase Sensimist, the deposition predictions using the two-way coupled approach showed closer agreement to the in vitro spray deposition measurements, while one-way coupled approach under-predicted the posterior spray deposition. Furthermore, the one-way coupled approach showed higher deposition on the spray nozzle compared to the two-way coupled approach. The in vitro measurements in the anterior region also included the spray nozzle deposition and drippage, if any. For brevity, only the results concerning the Flonase Sensimist spray transport results are reported in this section. A detailed comparative analysis between the two approaches for both Flonase Sensimist and Flonase is provided in the next section.
Figure 6. (a) Flonase Sensimist spray droplet deposition locations. (b) Comparison of the deposition predictions with in vitro measurements.
3.1.2. Quasi two-way coupled spray simulation
In order to reduce the computational time for the two-way coupled simulations, a time-saving simulation strategy (“quasi two-way coupled” Lagrangian model) was introduced. The Flonase Sensimist and Flonase spray transport and depositions were first simulated for the insertion under the no inhalation flow condition and deposition predictions were compared with in vitro measurements. In the quasi two-way coupled approach, the velocity field due to the momentum exchange was frozen at 10 ms, then the full spray liquid mass was injected into this frozen velocity field, using one-way coupled droplet tracking. The selection of 10 ms was based on the observation that the characteristics of the momentum-jet from the droplets were comparable to the posterior length of a nasal geometry and not significantly changing after 10 ms (see ). Additionally, the volume-averaged velocity from the transient two-way coupled simulation plateaued at 10 ms, indicating that the momentum-jet became fully developed by this time (see ). It is noted here that the net momentum exchange from the droplets to the surrounding air resulted in the momentum-jet velocity profile and, hence, the frozen velocity field indirectly approximates two-way coupled momentum exchange in the quasi two-way coupled simulations. By using the quasi two-way coupled simulation, the computational time for the nasal spray deposition prediction was reduced to 120 core hours, representing an order of magnitude reduction in computational time requirement.
Figure 7. (a) Streamlines depicting the momentum-jet from the Flonase Sensimist spray droplet injection at 10 ms. Location of the Flonase Sensimist spray droplet deposition using (b) quasi two-way coupled approach and (c) one-way coupled approach. One-way coupled droplets in (c) that fall back to the spray nozzle tip are approximately 30 µm and smaller, representing approximately 6.6% of the injected droplet mass.
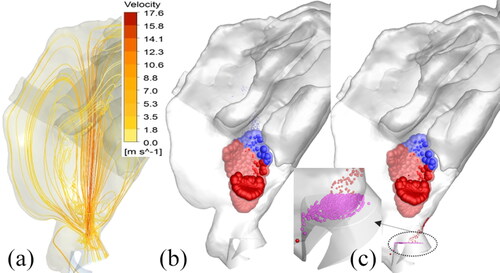
The location of the Flonase Sensimist deposited spray droplets from the quasi two-way coupled and the one-way coupled simulations are shown in . The spray droplet deposition locations in the quasi two-way coupled study were similar to the fully transient simulation results in ; however, since more droplets were injected at one time-step (20,000 droplets at 10 ms with frozen velocity field—quasi two-way coupling), more droplets were randomly distributed from the injection plane. This resulted in slightly dispersed deposition, although the deposition predictions were very similar with the fully transient two-way coupled simulation using a relatively smaller number of injected droplets per time-step ( and ), confirming the selection of the random droplet injection profiles. To illustrate the effects of the two-way coupling in spray droplet transport, a detailed comparative analysis of the regional nasal deposition was performed with the corresponding deposition using a one-way coupled approach. As reported with the full two-way coupled prediction, with the quasi two-way coupled approach only a very few droplets deposited back on to the spray nozzle and nasal wall in the region of the nozzle (see ). However, with the one-way coupling approach, smaller droplets were not carried by the momentum-jet, and hence, a higher percentage (6.6%) of the injected droplets deposited back on the spray nozzle surface (see ). In the one-way coupled simulation, the smaller droplets, having shorter stopping distance traversed shorter distances before dropping down due to gravity. However, the two-way coupled simulation showed that the momentum exchange resulted in the displacement of the surrounding gas, leading to an upward velocity which carried the smaller droplets further into the nose.
Table 2. Comparison of CFD predicted Flonase Sensimist deposition in specific nasal regions using the quasi two-way and one-way coupling with the in vitro measurements.
provides the comparison of the CFD predicted droplet mass deposition in specific nasal regions with quasi two-way and one-way coupling versus the in vitro deposition measurements for Flonase Sensimist. For the in vitro deposition measurements, the anterior deposition was considered together with the spray wall deposition and the drippage in the in vitro experiments (if any occurred). Hence, the CFD predicted anterior deposition together with the spray nozzle deposition was compared with similar conditions from the in vitro measurements. The CFD predicted anterior deposition with the one-way coupled approach resulted in higher relative error than the two-way coupled approach. Compared to the in vitro data, the one-way coupled solution produced 3.9% and 47% relative error in predicting the anterior and posterior nasal depositions, respectively, while using the two-way coupled solution resulted in reduction of the relative errors to 0.8% and 9%, respectively.
Following the same simulation procedure, Flonase spray droplet transport was simulated using the quasi two-way and one-way coupled approaches and the results were compared with in vitro measurements. The quasi two-way coupled simulation was conducted by injecting spray droplets with the velocity field frozen at 10 ms. shows the momentum-jet at 10 ms for the Flonase spray under the two-way coupled approach. Considering that the spray pump insertion angles are the same for both Flonase Sensimist and Flonase, the droplet deposition locations were also similar, with Flonase deposition showing a narrower shape compared to Flonase Sensimist, because of the relatively smaller cone angle (see ). Compared to the two-way coupled approach, the one-way coupled approach resulted in a higher percentage of the droplets depositing back on the spray wall/nozzle (see ), a trend similar to the Flonase Sensimist spray. lists the comparison of CFD predicted droplet deposition mass in specific nasal regions with two-way and one-way coupling versus the in vitro deposition measurements for Flonase. The in vitro nasal deposition measurements with Flonase spray had a relatively higher standard deviation compared to Flonase Sensimist. The CFD predictions are within the standard deviation of the in vitro deposition measurements. Even though both the two-way and one-way coupled approaches showed similar relative error for both the anterior (3%) and posterior (33%) depositions compared to the in vitro measurements, the predictions using the two approaches are on opposite sides of the standard deviation. To be noted here is the higher percentage (13.5%) of predicted Flonase spray droplet deposition on the spray wall/nozzle under the one-way coupled approach compared with the two-way coupled approach (0% deposition fraction).
Figure 8. (a) Streamlines depicting the momentum-jet from the Flonase spray droplet injection at 10 ms. Location of the Flonase spray droplet deposition using (b) quasi two-way coupled approach and (c) one-way coupled approach. One-way coupled droplets in (c) that fall back on the spray nozzle tip are approximately 30 µm and smaller, representing approximately 13.5% of the injected droplet mass.
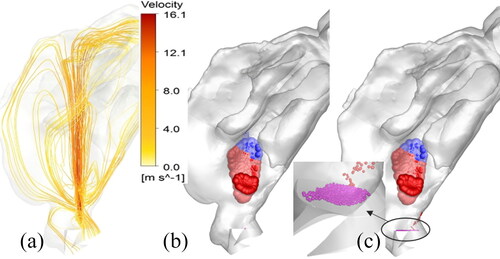
Table 3. Comparison of CFD predicted Flonase deposition in specific nasal regions using quasi two-way and one-way coupling with the in vitro measurements.
3.1.3. Influence of turbulent particle dispersion
To analyze the influence of turbulent dispersion on the spray droplet transport and deposition, Flonase Sensimist and Flonase spray deposition under the no inhalation flow condition was investigated using the quasi two-way coupled approach including the droplet turbulent dispersion. Specifically, in addition to the mean flow velocity estimated by the two-equation turbulence model, the fluctuating or the instantaneous velocity was estimated based on the turbulent flow parameters. lists the comparison of spray deposition using the quasi two-way coupled approach with and without the turbulent dispersion. The relative difference in the deposition predictions in the anterior and posterior regions with and without the turbulent dispersion were small, except the posterior deposition for Flonase Sensimist. Considering that turbulent dispersion is not largely influencing the droplet transport, the rest of the simulations considered in this study were performed without including the droplet turbulent dispersion.
Table 4. Comparison of CFD predicted Flonase Sensimist and Flonase deposition in specific nasal regions using quasi two-way coupling with and without the turbulent dispersion.
3.1.4. Momentum transfer approach to simulate two-way coupling
To further reduce the computational time and resources required for two-way coupled simulations, a momentum transfer approach was introduced, where the momentum exchange from a two-way coupled simulation in a geometrically simpler model was transferred to other complex models as a momentum source term to simulate the two-way coupled effect of spray droplets on the surrounding air medium. A transient flow simulation with the transferred momentum as a 3D source (without the droplet transport) was then conducted to capture the developing momentum-jet profile for 10 ms, recreating the quasi two-way coupled simulation results. The momentum transfer approach has shown faster convergence and, hence, it was possible to use a larger time-step value of 0.005 s for the simulations and still achieve good residual convergence, resulting in an additional order of magnitude reduction in computational cost compared with the quasi two-way coupled approach.
For transferring the momentum sources from the simpler geometry to the full nasal model, the nozzle tip was used as the origin and the mesh cells with equal distance from the nozzle tip were identified in both geometries. In order to avoid dependency on the computational mesh size while transferring the momentum from one geometry to another, the momentum sources were first normalized with the volume of the respective mesh element in the simplified geometry and then de-normalized with the corresponding mesh element volume in the targeted geometry. As shown in , transferring the momentum sources from the cells along the droplet trajectories followed the shape of a cone, because of the droplet spray configuration. It was also observed that the largest momentum sources were located close to the spray nozzle tip. Hence, the momentum transfer from the 3D cone region of fixed length was able to capture the momentum exchange and the development of the momentum-jet due the droplet transport. Cone lengths of 2 cm and 3 cm were considered to transfer the momentum sources from the simple model to the targeted nasal model (). Further increase in cone length was prohibitive because of the shape of the nasal airway and nasal wall boundary.
Figure 9. (a) Schematic for transferring momentum sources from a simpler geometry to a nasal geometry. Development of the momentum-jet due to momentum transfer in the nasal model at 10 ms for Flonase Sensimist with a cone length of (b) 2 cm and (c) 3 cm. Similar development of the momentum jet for Flonase with a cone length of (d) 2 cm and (e) 3 cm.
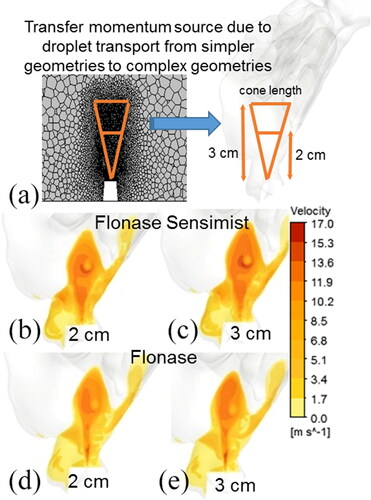
As shown in , the development of the momentum-jet profile produced in a transient simulation with just the transferred momentum sources was similar to the two-way coupled spray transport simulation. To compare the Flonase Sensimist spray mass transport, droplet trajectories were simulated in conjunction with the transferred momentum generated momentum-jet velocity condition (frozen flow field) at 10 ms. lists the predicted spray deposition using the momentum transfer approach with cones of length 2 cm and 3 cm for both sprays. The deposition predictions in the anterior and posterior regions for the momentum transfer approach were similar to the quasi two-way coupled approach, with maximum relative error below 11%. Considering that the momentum-transfer approach can complete nasal spray simulations within 20 core hours, the simulation time was reduced by two orders of magnitude compared to the full two-way momentum coupled simulation.
Table 5. Comparison of spray deposition prediction when using cone lengths of 2 cm and 3 cm for transferring the momentum sources.
3.2. Spray actuation with nasal inhalation flow
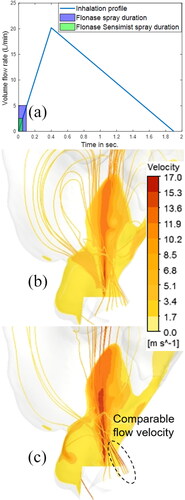
It is recommended to actuate nasal sprays in conjunction with the subject’s inhalation flow. In this case, spray droplets are transported together with the inhalation airflow and this could influence the droplet trajectories and, hence, the momentum transfer. To test this effect, the spray transport and deposition were simulated with the inhalation flow profile previously used by Manniello et al. (Citation2021) (). The inhalation profile used was the recommended “gently sniffing” pattern with a peak volumetric flowrate of 20.2 L/min, suggested to be used during the actuation of both types of nasal sprays (Guo, Laube, and Dalby Citation2005; Manniello et al. Citation2021). In this study, the spray was actuated at the beginning of the inhalation flow. For Flonase Sensimist, because the spray duration was 50 ms, the maximum volumetric flowrate of the inhaled air during inhalation during spray actuation was only 2.5 L/min, while for Flonase with spray duration of 95 ms, it was 5 L/min. Clearly, the spray droplets interact with only a fraction of the full profile peak flowrate, due to the short spray duration for both sprays. In order to reduce the required computational time and resources, and to investigate the influence of inhalation flow on droplet trajectories, the quasi two-way coupled simulation with a steady inhalation flowrate (maximum flowrate at the end of the spray duration) was used. The maximum flowrate at the end of the spray duration was chosen to evaluate the influence of airflow on spray droplet trajectories and regional deposition. show the velocity contours on the sagittal plane, depicting the development of the momentum-jet due to the momentum transfer, while the streamlines starting from the nostrils show the airflow arising from the inhalation boundary condition. For Flonase Sensimist, the magnitude of the inhalation flow in comparison to the momentum-jet was smaller, while for the Flonase Sensimist it was comparable to the momentum-jet, as shown in .
Figure 10. (a) Inhalation flow profile with Flonase Sensimist and Flonase spray overlap. Contours showing the air-jet and streamlines starting from the nostril inlets under inhalation flow conditions for (b) Flonase Sensimist (c) Flonase.
reports the predicted Flonase Sensimist and Flonase deposition in the anterior and the posterior regions using the quasi two-way coupled approach and one-way coupled approach under the inhalation flow condition, in comparison with the in vitro measurements. Similar to the previous findings, the CFD predicted deposition with the one-way coupled approach resulted in higher relative error than the two-way coupled approach. The inhalation flow was shown to have only minor influence on the spray droplet transport and regional deposition. Compared to the no flow condition, the spray deposition in the anterior region under the inhalation flow condition increased slightly, with the exception of the in vitro measurement for Flonase, which had a larger standard deviation.
Table 6. Comparison of CFD predicted spray deposition results with the in vitro measurements under the inhalation flow condition.
4. Discussion
The main delivery mechanism of nasal sprays that administer locally acting drugs to the nasal airway surface is by inertial impaction. Nasal sprays are designed to produce larger micrometer-sized droplets with high inertia that deposit in the nose and avoid inhalation into the lungs. As shown in our previous study (Kolanjiyil et al. Citation2021), these high inertial droplets injected into the nasal airway cavity impart significant momentum onto the continuous phase, which induces a cloud-based gas velocity and cloud motion of droplets. The cloud-based gas velocity as a whole imparts significant momentum on the smaller droplets and transports them further into the flow field (). This exchange of momentum from the dispersed phase to the continuous phase and its consequential impact on the dispersed phase transport is fully captured in a two-way coupled simulation (Kolanjiyil et al. Citation2021). As shown in this study, using the two-way coupled approach, the transport of droplets created the momentum-jet which again resulted in imparting sufficient momentum to the smaller droplets. The one-way coupled simulations did not account for this momentum exchange resulting in a general under-prediction of net droplet deposition on the nasal surface, while predicting higher deposition back on the nasal spray pump due to gravitational sedimentation ( and ).
Regional spray deposition prediction in the nasal regions for Flonase Sensimist and Flonase using the two-way coupled approach showed good agreement with the in vitro measurements, while the one-way coupled simulations resulted in higher overall relative error and showed higher deposition on the spray pump. Specifically, for Flonase Sensimist and Flonase sprays, the two-way coupled simulation predicted posterior drug delivery of 6.9% and 12.3%, while one-way coupled simulation predicted 4% and 6.3%, in comparison to the in vitro measurements of 7.7 ± 0.5% and 9.3 ± 3.32%, respectively. The two-way coupled simulations of Flonase Sensimist resulted in an average relative error of 5% (average of anterior and posterior relative errors), while the one-way coupled simulations resulted in an average relative error of 25% when compared with the in vitro measurements (). Taking into consideration that the standard deviation values for the in vitro regional deposition measurements of Flonase spray were relatively higher, both two-way and one-way coupled Flonase simulation predictions were within the standard deviation of the in vitro measurements with an average relative error of 18% when compared with the in vitro measurements ().
Considering that two-way coupled simulations improved agreement with in vitro data for the Flonase Sensimist spray pump but not for the Flonase case (in the absence of inhalation), a question arises regarding when the two-way technique should be used. No clear momentum differences are observed in the spray characteristics reported in , with the main differences being a larger shot weight (over a longer period) and smaller cone angle with Flonase. It is important to recognize that for both spray pumps, two-way coupling had a significant influence producing an increase in posterior deposition fraction, which is perhaps the most important nasal region to consider. In the case of Flonase Sensimist, two-way coupling increased posterior deposition by a factor of 1.7-fold bringing it into very close agreement with the in vitro data. With Flonase, two-way coupling increased posterior deposition by a factor of 2-fold, which causes an overshoot of the in vitro data mean value and resulted in the same relative error as with the one-way coupled under-prediction. Based on these observations, we can conclude that for both spray pumps, two-way coupling has a significant physical effect and is therefore highly important. This finding is further supported by the cases with nasal inhalation in which two-way coupling remained significant and improved agreement with in vitro deposition for both spray pumps. The question then becomes why two-way coupling caused an overshoot of posterior deposition with Flonase. Based on experimental visual observations, a hypothesis to explain this question is that the larger volume of liquid delivered with the Flonase spray pump (2-fold greater shot weight) and tighter cone angle created post-deposition liquid motion (film motion on the wall) with dripping back into the anterior region. Hence, we postulate that two-way coupling is a highly important phenomena in all cases considered and should be included with these and similar nasal spray pumps. We are actively developing liquid motion models to test our hypothesis on post-deposition liquid film motion with the Flonase spray product, which should further improve agreement with in vitro data for Flonase and not significantly impact Flonase Sensimist under the current delivery conditions.
While two-way coupling was found to be important, the fully two-way coupled spray droplet simulations are computational time and resource intensive. Hence, a quasi two-way coupled modeling approach was introduced, where the momentum-jet was first simulated for 10 ms followed by a one-way coupled droplet injection and deposition simulation (Kolanjiyil et al. Citation2021). The momentum-jet reached a quasi steady state within 10 ms, which captured the effects of the two-way coupling between the high inertial droplets and the surrounding air. The quasi two-way coupled modeling approach reduced the simulation time by an order of magnitude. Additionally, another approach using the droplet momentum source transfer was introduced to increase the computational efficiency of the two-way coupled spray transport (Kolanjiyil et al. Citation2021). The momentum transfer approach, where the 3D momentum source from a simplified cone geometry is applied to a complete nasal model, has been shown to reduce the simulation time by two orders of magnitude. The momentum transfer approach is best suited for repeated spray simulations, investigating various pump insertion conditions. For simulating the nasal spray transport in conjunction with the nasal inhalation flow, the steady state one-way coupled simulation can take around 12 core hours, while the quasi two-way coupled spray deposition simulation took 120 core hours and a momentum transfer approach simulation can be completed under 20 core hours. The quasi two-way coupled or momentum transfer approach spray simulations can be easily computed using a standard desktop CPU. Using the multicore schemes in a standard desktop architecture, the runtime for these simulations can be reduced to a few hours.
Another constraint in using the two-way coupled approach is the slow solution convergence in the initial time-step resulting in large numbers of solver iterations. This is primarily because of the interaction between the droplets and the primary phase in a very small volume near the spray nozzle compared to the large computational domain. This issue was resolved by using a custom solver domain initialization routine which effectively identifies cells near the spray nozzle within the spray cone volume and initializes the flow variables only in these cells.
Spray deposition in the anterior nasal region, as measured experimentally and predicted via CFD simulations, was higher compared to the posterior region, for Flonase Sensimist and Flonase sprays. Flonase had a slightly higher deposition in the posterior region, which is the intended target for pharmaceutical nasal sprays, compared to Flonase Sensimist. Considering that the net liquid injection flow rate and the injection velocity are comparatively similar for both sprays, and the sprays were actuated with the same insertion conditions, a contributing factor for the higher deposition of Flonase spray in the posterior region could be the smaller spray cone angle. Similar results showing the influence of spray cone angle on nasal deposition have been noticed in recent nasal in vitro studies (Sawant and Donovan Citation2018). Factors that have not been investigated in this study such as the formulation viscosity, surface tension and density, and pump design are different for these sprays and, hence, could influence the spray cone angle and resulting regional nasal deposition (Dayal, Shaik, and Singh 2004; Guo, Laube, and Dalby Citation2005; Kundoor and Dalby Citation2011; Pu et al. Citation2014).
As shown using the simulations with the nasal inhalation flow in conjunction with the spray actuation, when the spray was actuated at the beginning of the inhalation flow, the maximum flow rate interacting with the spray droplets was relatively lower than the peak inhalation flow rate. This is due to the smaller spray durations in comparison to the nasal inhalation flow cycle. Hence, the regional nasal deposition values were mostly determined by the high momentum droplet transport and were not largely affected by the inhalation flow. Similar results were also noted in other recent nasal spray deposition investigations, where different inhalation flow profiles showed minimal influence on the spray trajectories with larger droplets (Foo et al. Citation2007; Guo, Laube, and Dalby Citation2005; Kundoor and Dalby Citation2010; Warnken et al. Citation2018). In this study, despite the smaller influence of the inhalation flow on the spray deposition, the flow velocities from the inspiratory flow was comparable to the momentum-jet velocity. Higher inhalation flowrates or delay in spray actuation could generate large flow turbulence and influence the spray droplet trajectories and spray deposition profiles (Azimi et al. Citation2016). Hence, further investigations may be needed to evaluate the influence of inhalation flow and delay in spray actuation on nasal deposition.
As detailed in Kolanjiyil et al. (Citation2021), the spray droplets were initiated from the spray nozzle, following the measured droplet size distribution, spray velocity and cone angle. Considering that the primary objective of this study was to develop a time and resource efficient computational spray modeling framework by incorporating the in vitro measured spray parameters that can accurately predict the nasal deposition, volumetric coupling effects, primary and secondary spray atomization, droplet evaporation, coalescence, collision, deformation and droplet breakup were neglected. Nevertheless, recent advances in hybrid Euler-Lagrange frameworks including spray atomization models are interesting approaches for explicit spray dynamics simulations; however, the model parameters may need to be fine-tuned for nasal sprays (Fung et al. Citation2012). Other modeling advancements like the Euler-Euler population balance equation models with method of moments solver can also capture the dense spray dynamics at the expense of high computational resources (Marchisio and Fox Citation2013; Yeoh, Cheung, and Tu Citation2013).
In conclusion, nasal spray transport and deposition were modeled in this study using the one-way and two-way coupled Euler-Lagrange frameworks and model deposition predictions were compared with in vitro measurements performed under matching spray actuation conditions. A spray adapter was used to guide and position the spray in both the experiments and CFD model, which increased reproducibility, reduced the standard deviations of the in vitro measurements and ensured identical spray insertion conditions in the CFD simulations. The comparative analysis showed that the two-way coupled approach is accurate in simulating the spray deposition in the nasal airways when compared with the in vitro data. The one-way coupled approach under-predicted regional nasal deposition and showed higher deposition on the spray pump. The simulation results also confirmed the findings that two-way coupled approach better predicts the nasal deposition when the spray is actuated in conjunction with a nasal inhalation flow. While the two-way coupled approach is accurate in simulating spray transport, time and resource saving models using either the quasi two-way coupling or momentum transfer approach were found to be accurate and provided one and two order of magnitude savings in computational cost, respectively.
Acknowledgments
Views expressed in this article do not necessarily reflect the official policies of the U.S. Food and Drug Administration, nor does any mention of trade names, commercial practices, or organization imply endorsement by the United States Government. Laboratory assistance provided by Dr. Michele Dario Manniello is also gratefully acknowledged.
Disclosure statement
The authors declare that they have no known competing financial interests or personal relationships that could have appeared to influence the work reported in this article.
Additional information
Funding
References
- Azimi, M., M. Hindle, P. W. Longest, and R. L. Walenga. 2016. Comparison of the in vitro deposition of Nasonex nasal spray product in two realistic nasal airway models. Respiratory Drug Deliv. 2016:617–21.
- Bass, K., S. Boc, M. Hindle, K. Dodson, and W. Longest. 2019. High-efficiency nose-to-lung aerosol delivery in an infant: Development of a validated computational fluid dynamics method. J. Aerosol Med. Pulm. Drug Deliv. 32 (3):132–48. doi:10.1089/jamp.2018.1490.
- Bass, K., and P. W. Longest. 2018. Recommendations for simulating microparticle deposition at conditions similar to the upper airways with two-equation turbulence models. J. Aerosol Sci. 119:31–50. doi:10.1016/j.jaerosci.2018.02.007.
- Basu, S., L. T. Holbrook, K. Kudlaty, O. Fasanmade, J. Wu, A. Burke, B. W. Langworthy, Z. Farzal, M. Mamdani, W. D. Bennett, et al. 2020. Numerical evaluation of spray position for improved nasal drug delivery. Sci. Rep. 10 (1):1–18. doi:10.1038/s41598-020-66716-0.
- Carrigy, N. B., C. A. Ruzycki, L. Golshahi, and W. H. Finlay. 2014. Pediatric in vitro and in silico models of deposition via oral and nasal inhalation. J. Aerosol. Med. Pulm. Drug Deliv. 27 (3):149–69. doi:10.1089/jamp.2013.1075.
- Chari, S., K. Sridhar, R. Walenga, and C. Kleinstreuer. 2021. Computational analysis of a 3D mucociliary clearance model predicting nasal drug uptake. J. Aerosol Sci. 155:105757. doi:10.1016/j.jaerosci.2021.105757.
- Chen, J. Z., M. Kiaee, A. Martin, and W. H. Finlay. 2020. In vitro assessment of an idealized nose for nasal spray testing: Comparison with regional deposition in realistic nasal replicas. Int. J. Pharm. 582:119341. doi:10.1016/j.ijpharm.2020.119341.
- Choi, S. H., Y. Wang, D. S. Conti, S. G. Raney, R. Delvadia, A. A. Leboeuf, and K. Witzmann. 2018. Generic drug device combination products: Regulatory and scientific considerations. Int. J. Pharm. 544 (2):443–54. doi:10.1016/j.ijpharm.2017.11.038.
- Corley, R. A., S. Kabilan, A. P. Kuprat, J. P. Carson, K. R. Minard, R. E. Jacob, C. Timchalk, R. Glenny, S. Pipavath, T. Cox, et al. 2012. Comparative computational modeling of airflows and vapor dosimetry in the respiratory tracts of rat, monkey, and human. Toxicol. Sci. 128 (2):500–16. doi:10.1093/toxsci/kfs168.
- Csaba, N., M. Garcia-Fuentes, and M. J. Alonso. 2009. Nanoparticles for nasal vaccination. Adv. Drug Deliv. Rev. 61 (2):140–57. doi:10.1016/j.addr.2008.09.005.
- Dayal, P., V. Pillay, R. J. Babu, and M. Singh. 2005. Box-Behnken experimental design in the development of a nasal drug delivery system of model drug hydroxyurea: Characterization of viscosity, in vitro drug release, droplet size, and dynamic surface tension. AAPS PharmSciTech. 6 (4):E573–E85. doi:10.1208/pt060472.
- Dayal, P., M. S. Shaik, and M. Singh. 2004. Evaluation of different parameters that affect droplet-size distribution from nasal sprays using the Malvern Spraytec®. J. Pharm. Sci. 93 (7):1725–42. doi:10.1002/jps.20090.
- Djupesland, P. G. 2013. Nasal drug delivery devices: Characteristics and performance in a clinical perspective-a review. Drug Deliv. Transl. Res. 3 (1):42–62. doi:10.1007/s13346-012-0108-9.
- Dykewicz, M. S., and D. L. Hamilos. 2010. Rhinitis and sinusitis. J. Allergy Clin. Immunol. 125 (2 Suppl 2):S103–S15. doi:10.1016/j.jaci.2009.12.989.
- Feng, Y., H. Hayati, A. J. Bates, K. Walter, L. Matthias, B. Odo, O. Ramiro, and K. Gerda. 2021. Clinical CFD applications 2. In Clinical and Biomedical Engineering in the Human Nose, 225–53. Singapore: Springer.
- Foo, M. Y., Y. S. Cheng, W. C. Su, and M. D. Donovan. 2007. The influence of spray properties on intranasal deposition. J. Aerosol Med. 20 (4):495–508. doi:10.1089/jam.2007.0638.
- Foo, M. Y., N. Sawant, E. Overholtzer, and M. D. Donovan. 2018. A simplified geometric model to predict nasal spray deposition in children and adults. AAPS PharmSciTech. 19 (7):2767–77. doi:10.1208/s12249-018-1031-2.
- Frank, D. O., J. S. Kimbell, S. Pawar, and J. S. Rhee. 2012. Effects of anatomy and particle size on nasal sprays and nebulizers. Otolaryngol. Head Neck Surg. 146 (2):313–9. doi:10.1177/0194599811427519.
- Fung, M. C., K. Inthavong, W. Yang, P. Lappas, and J. Tu. 2013. External characteristics of unsteady spray atomization from a nasal spray device. J. Pharm. Sci. 102 (3):1024–35. doi:10.1002/jps.23449.
- Fung, M. C., K. Inthavong, W. Yang, and J. Tu. 2012. CFD modeling of spray atomization for a nasal spray device. Aerosol Sci. Technol. 46 (11):1219–26. doi:10.1080/02786826.2012.704098.
- Gao, M., X. Shen, and S. Mao. 2020. Factors influencing drug deposition in the nasal cavity upon delivery via nasal sprays. J. Pharm. Investig. 50 (3):251–9. doi:10.1007/s40005-020-00482-z.
- Grmaš, J., K. Stare, D. Božič, R. Injac, and R. Dreu. 2017. Elucidation of formulation and delivery device-related effects on in vitro performance of nasal spray with implication to rational product specification identification. J. Aerosol Med. Pulm. Drug Deliv. 30 (4):230–46. doi:10.1089/jamp.2016.1328.
- Guo, Y., B. Laube, and R. Dalby. 2005. The effect of formulation variables and breathing patterns on the site of nasal deposition in an anatomically correct model. Pharm. Res. 22 (11):1871–8. doi:10.1007/s11095-005-7391-9.
- Guo, C., K. J. Stine, J. F. Kauffman, and W. H. Doub. 2008. Assessment of the influence factors on in vitro testing of nasal sprays using Box-Behnken experimental design. Eur. J. Pharm. Sci. 35 (5):417–26. doi:10.1016/j.ejps.2008.09.001.
- Hosseini, S., T. A. Schuman, R. Walenga, J. V. Wilkins, Jr., A. Babiskin, and L. Golshahi. 2020. Use of anatomically-accurate 3-dimensional nasal airway models of adult human subjects in a novel methodology to identify and evaluate the internal nasal valve. Comput. Biol. Med. 123:103896. doi:10.1016/j.compbiomed.2020.103896.
- Hosseini, S., X. Wei, J. V. Wilkins, Jr., C. P. Fergusson, R. Mohammadi, G. Vorona, and L. Golshahi. 2019. In vitro measurement of regional nasal drug delivery with Flonase,® Flonase® Sensimist,™ and MAD Nasal™ in anatomically correct nasal airway replicas of pediatric and adult human subjects. J. Aerosol Med. Pulm. Drug Deliv. 32 (6):374–85. doi:10.1089/jamp.2019.1523.
- Inthavong, K., M. C. Fung, X. Tong, W. Yang, and J. Tu. 2014. High resolution visualization and analysis of nasal spray drug delivery. Pharm. Res. 31 (8):1930–7. doi:10.1007/s11095-013-1294-y.
- Inthavong, K., M. C. Fung, W. Yang, and J. Tu. 2015. Measurements of droplet size distribution and analysis of nasal spray atomization from different actuation pressure. J. Aerosol Med. Pulm. Drug Deliv. 28 (1):59–67. doi:10.1089/jamp.2013.1093.
- Inthavong, K., Q. J. Ge, C. M. K. Se, W. Yang, and J. Y. Tu. 2011. Simulation of sprayed particle deposition in a human nasal cavity including a nasal spray device. J. Aerosol Sci. 42 (2):100–13. doi:10.1016/j.jaerosci.2010.11.008.
- Kannan, R. R., A. J. Przekwas, N. Singh, R. Delvadia, G. Tian, and R. Walenga. 2017. Pharmaceutical aerosols deposition patterns from a Dry Powder Inhaler: Euler Lagrangian prediction and validation. Med. Eng. Phys. 42:35–47. doi:10.1016/j.medengphy.2016.11.007.
- Kiaee, M., H. Wachtel, M. L. Noga, A. R. Martin, and W. H. Finlay. 2019. An idealized geometry that mimics average nasal spray deposition in adults: A computational study. Comput. Biol. Med. 107:206–17. doi:10.1016/j.compbiomed.2019.02.013.
- Kimbell, J. S., R. A. Segal, B. Asgharian, B. A. Wong, J. D. Schroeter, J. P. Southall, C. J. Dickens, G. Brace, and F. J. Miller. 2007. Characterization of deposition from nasal spray devices using a computational fluid dynamics model of the human nasal passages. J. Aerosol Med. 20 (1):59–74. doi:10.1089/jam.2006.0531.
- Kleinstreuer, C., Z. Zhang, and J. F. Donohue. 2008. Targeted drug-aerosol delivery in the human respiratory system. Annu. Rev. Biomed. Eng. 10:195–220. doi:10.1146/annurev.bioeng.10.061807.160544.
- Kolanjiyil, A. V., S. Hosseini, A. Alfaifi, M. Hindle, L. Golshahi, and P. W. Longest. 2021. Importance of cloud motion and two-way momentum coupling in the transport of pharmaceutical nasal sprays. J. Aerosol Sci. 156:105770. doi:10.1016/j.jaerosci.2021.105770.
- Kolanjiyil, A. V., S. Hosseini, M. D. Manniello, A. Alfaifi, D. R. Farkas, M. Hindle, L. Golshahi, and P. W. Longest. 2020. Effect of spray momentum on nasal spray droplet transport and deposition. Respiratory Drug Deliv. 3 (1):691–6.
- Koullapis, P., F. Stylianou, C.-L. Lin, S. Kassinos, and J. Sznitman. 2021. In silico methods to model dose deposition. In Inhaled Medicines, 167–95. Elsevier.
- Kundoor, V., and R. Dalby. 2011. Effect of formulation- and administration-related variables on deposition pattern of nasal spray pumps evaluated using a nasal cast. Pharm. Res. 28 (8):1895–904. doi:10.1007/s11095-011-0417-6.
- Kundoor, V., and R. N. Dalby. 2010. Assessment of nasal spray deposition pattern in a silicone human nose model using a color-based method. Pharm. Res. 27 (1):30–6. doi:10.1007/s11095-009-0002-4.
- Laube, B. L., G. Sharpless, A. R. Vikani, V. Harrand, S. J. Zinreich, K. Sedberry, D. Knaus, J. Barry, and M. Papania. 2015. Intranasal deposition of Accuspray™ aerosol in anatomically correct models of 2-, 5-, and 12-year-old children. J. Aerosol Med. Pulm. Drug Deliv. 28 (5):320–33. doi:10.1089/jamp.2014.1174.
- Le Guellec, S., S. Ehrmann, and L. Vecellio. 2021. In vitro–in vivo correlation of intranasal drug deposition. Adv. Drug Deliv. Rev. 170:340–52. doi:10.1016/j.addr.2020.09.002.
- Li, B. V., F. Jin, S. L. Lee, T. Bai, B. Chowdhury, H. T. Caramenico, and D. P. Conner. 2013. Bioequivalence for locally acting nasal spray and nasal aerosol products: Standard development and generic approval. AAPS J. 15 (3):875–83. doi:10.1208/s12248-013-9494-2.
- Liu, X., W. Doub, and C. Guo. 2011. Assessment of the influence factors on nasal spray droplet velocity using Phase-Doppler Anemometry (PDA). AAPS PharmSciTech. 12 (1):337–43. doi:10.1208/s12249-011-9594-1.
- Liu, X., W. H. Doub, and C. Guo. 2010. Evaluation of droplet velocity and size from nasal spray devices using phase Doppler anemometry (PDA). Int. J. Pharm. 388 (1–2):82–7. doi:10.1016/j.ijpharm.2009.12.041.
- Longest, P. W., K. Bass, R. Dutta, V. Rani, M. L. Thomas, A. El-Achwah, and M. Hindle. 2019. Use of computational fluid dynamics deposition modeling in respiratory drug delivery. Expert Opin. Drug Deliv. 16 (1):7–26. doi:10.1080/17425247.2019.1551875.
- Longest, W., D. Farkas, K. Bass, and M. Hindle. 2019. Use of computational fluid dynamics (CFD) dispersion parameters in the development of a new DPI actuated with low air volumes. Pharm. Res. 36 (8):110. doi:10.1007/s11095-019-2644-1.
- Longest, P. W., and M. Hindle. 2009. Evaluation of the Respimat Soft Mist inhaler using a concurrent CFD and in vitro approach. J. Aerosol Med. Pulm. Drug Deliv. 22 (2):99–112. doi:10.1089/jamp.2008.0708.
- Longest, P. W., and L. T. Holbrook. 2012. In silico models of aerosol delivery to the respiratory tract - Development and applications. Adv. Drug Deliv. Rev. 64 (4):296–311. doi:10.1016/j.addr.2011.05.009.
- Macias-Valle, L., and A. J. Psaltis. 2020. A scholarly review of the safety and efficacy of intranasal corticosteroids preparations in the treatment of chronic rhinosinusitis. Ear Nose Throat J. 100 (5):295–301.
- Manniello, M. D., S. Hosseini, A. Alfaifi, A. R. Esmaeili, A. V. Kolanjiyil, R. Walenga, A. Babiskin, D. Sandell, R. Mohammadi, T. Schuman, et al. 2021. In vitro evaluation of regional nasal drug delivery using multiple anatomical nasal replicas of adult human subjects and two nasal sprays. Int. J. Pharm. 593:120103. doi:10.1016/j.ijpharm.2020.120103.
- Marchisio, D. L., and R. O. Fox. 2013. Computational models for polydisperse particulate and multiphase systems. Cambridge, UK: Cambridge University Press.
- Newman, S. P., G. R. Pitcairn, and R. N. Dalby. 2004. Drug delivery to the nasal cavity: In vitro and in vivo assessment. Crit. Rev. Ther. Drug Carrier Syst. 21 (1):21–66.
- Pennington, J., P. Pandey, H. Tat, J. Willson, and B. Donovan. 2008. Spray pattern and droplet size analyses for high-shear viscosity determination of aqueous suspension corticosteroid nasal sprays. Drug Dev. Ind. Pharm. 34 (9):923–9. doi:10.1080/03639040802149046.
- Pu, Y., A. P. Goodey, X. Fang, and K. Jacob. 2014. A comparison of the deposition patterns of different nasal spray formulations using a nasal cast. Aerosol Sci. Technol. 48 (9):930–8. doi:10.1080/02786826.2014.931566.
- Rygg, A., M. Hindle, and P. Longest. 2016a. Linking suspension nasal spray drug deposition patterns to pharmacokinetic profiles: A proof-of-concept study using computational fluid dynamics. J. Pharm. Sci. 105 (6):1995–2004. doi:10.1016/j.xphs.2016.03.033.
- Rygg, A., M. Hindle, and P. W. Longest. 2016b. Absorption and clearance of pharmaceutical aerosols in the human nose: Effects of nasal spray suspension particle size and properties. Pharm. Res. 33 (4):909–21. doi:10.1007/s11095-015-1837-5.
- Rygg, A., and P. W. Longest. 2016. Absorption and clearance of pharmaceutical aerosols in the human nose: Development of a CFD model. J. Aerosol Med. Pulm. Drug Deliv. 29 (5):416–31. doi:10.1089/jamp.2015.1252.
- Sawant, N., and M. D. Donovan. 2018. In vitro assessment of spray deposition patterns in a pediatric (12 year-old) nasal cavity model. Pharm. Res. 35 (5):1–12. doi:10.1007/s11095-018-2385-6.
- Sosnowski, T. R., P. Rapiejko, J. Sova, and K. Dobrowolska. 2020. Impact of physicochemical properties of nasal spray products on drug deposition and transport in the pediatric nasal cavity model. Int. J. Pharm. 574:118911. doi:10.1016/j.ijpharm.2019.118911.
- Storey-Bishoff, J., M. Noga, and W. H. Finlay. 2008. Deposition of micrometer-sized aerosol particles in infant nasal airway replicas. Aerosol Sci. 39 (12):1055–65. doi:10.1016/j.jaerosci.2008.07.011.
- Suman, J. D., B. L. Laube, and R. Dalby. 2006. Validity of in vitro tests on aqueous spray pumps as surrogates for nasal deposition, absorption, and biologic response. J. Aerosol Med. 19 (4):510–21. doi:10.1089/jam.2006.19.510.
- Suman, J. D., B. L. Laube, T.‐c. Lin, G. Brouet, and R. Dalby. 2002. Validity of in vitro tests on aqueous spray pumps as surrogates for nasal deposition. Pharm. Res. 19 (1):1–6. doi:10.1023/A:1013643912335.
- Tong, X., J. Dong, Y. Shang, K. Inthavong, and J. Tu. 2016. Effects of nasal drug delivery device and its orientation on sprayed particle deposition in a realistic human nasal cavity. Comput. Biol. Med. 77:40–8. doi:10.1016/j.compbiomed.2016.08.002.
- U.S. FDA. 2003. Draft guidance for industry: Bioavailability and bioequivalence studies for nasal aerosols and nasal sprays for local action. Washington, DC: US Food and Drug Administration.
- Walenga, R. L., A. H. Babiskin, and L. Zhao. 2019. In silico methods for development of generic drug-device combination orally inhaled drug products. CPT Pharmacometrics Syst. Pharmacol. 8 (6):359–70. doi:10.1002/psp4.12413.
- Walenga, R. L., G. Tian, M. Hindle, J. Yelverton, K. Dodson, and P. W. Longest. 2014. Variability in nose-to-lung aerosol delivery. J. Aerosol Sci. 78:11–29. doi:10.1016/j.jaerosci.2014.08.003.
- Warnken, Z. N., H. D. Smyth, D. A. Davis, S. Weitman, J. G. Kuhn, R. O. Williams, and I. I. I. 2018. Personalized medicine in nasal delivery: The use of patient-specific administration parameters to improve nasal drug targeting using 3D-printed nasal replica casts. Mol. Pharm. 15 (4):1392–402. doi:10.1021/acs.molpharmaceut.7b00702.
- Wilkins, J. V., L. Golshahi, N. Rahman, and L. Li. 2021. Evaluation of intranasal vaccine delivery using anatomical replicas of infant nasal airways. Pharm. Res. 38 (1):141–53. doi:10.1007/s11095-020-02976-9.
- Xi, J., J. E. Yuan, Y. Zhang, D. Nevorski, Z. Wang, and Y. Zhou. 2016. Visualization and quantification of nasal and olfactory deposition in a sectional adult nasal airway cast. Pharm. Res. 33 (6):1527–41. doi:10.1007/s11095-016-1896-2.
- Yeoh, G. H., C. P. Cheung, and J. Tu. 2013. Multiphase flow analysis using population balance modeling: Bubbles, drops and particles. Amsterdam: Butterworth-Heinemann.
- Zhang, H., Z. Yang, J. Xiang, Z. Cui, J. Liu, and C. Liu. 2020. Intranasal administration of SARS-CoV-2 neutralizing human antibody prevents infection in mice. bioRxiv. doi:10.1101/2020.12.08.416677.