
 ?Mathematical formulae have been encoded as MathML and are displayed in this HTML version using MathJax in order to improve their display. Uncheck the box to turn MathJax off. This feature requires Javascript. Click on a formula to zoom.
Abstract
Localizing and measuring aerosol deposition is essential to improve our knowledge regarding contaminants and their transfer mechanisms, the cleanliness of people’s environments and, consequently, our health. However, examining aerosol deposition is challenging, as it is based on several different mechanisms linked to aerosols, surfaces and air flow properties. Many techniques exist to measure aerosol deposition, but only a few techniques directly measure aerosol deposition without modifying the deposition itself. In this article, we review and describe the existing measurement techniques, which directly measure a deposition flux of aerosol particles on indoor surfaces. They are classified according to whether they measure a mass or a number surface deposition concentration. Among mass concentration measurement techniques, a few are the most commonly used in the literature and are well-known, whereas micro-sensors have been recently developed and these continue to be improved upon in laboratory experiments. Experimenters need to know more about the theoretical and technical aspects involved in order to build and implement these micro-sensors. Micro-sensors generally feature the ability to carry out in situ and close to real-time measurement. Number concentration measurement techniques are mainly based on optical systems. Commercial devices apart, these techniques are adaptable, and their configurations depend on experimental constraints. They also require some theoretical consideration depending on which kind of aerosol deposition is observed. On the other hand, commercial devices are turnkey solutions and are developed for specific purposes, such as cleanroom deposition measurement, in order to provide user-friendly devices and facilitate attaining repeatability in the measurement protocol.
Copyright © 2021 American Association for Aerosol Research
EDITOR:
1. Introduction
Monitoring and measuring aerosol deposition on surfaces help further our knowledge about airborne contaminant transfers in various fields, such as outdoor pollution, indoor air quality, ventilation and industrial safety. Measurement techniques used for this purpose vary, insofar as regards particle size distribution, the properties of the surfaces studied and the environment in which the experiment is performed.
A great many experimental aerosol deposition studies aim to determine outdoor deposition on different surfaces, such as natural cover (e.g., Petroff et al. Citation2008 on vegetation cover, and Slinn and Slinn Citation1980; Hoppel Citation2002; Hsu et al. Citation2010 on sea) and artificial cover (e.g., Roed Citation1985; Maro et al. Citation2014 on buildings). The main focus is to study the transfer of aerosol particles, which depends on various atmospheric parameters. Wind is the most common one, since wind influences the nature of deposited particles that can be found in one place (Uematsu et al. Citation1983; Kindap et al. Citation2006; Kondo et al. Citation2010). Another parameter is rain, which can wash out a proportion of suspended particles (Chate and Pranesha Citation2004; Andronache Citation2003; Volken and Schumann Citation1993). Most of these studies are interested in field deposition measurements. Some of them focus on laboratory experiments and are specifically designed to reproduce outdoor conditions (Garland and Cox Citation1982; Roupsard et al. Citation2013). In all the studies regarding outdoor aerosol deposition, measurements are mostly carried out using indirect methods: the concentration of the deposited matter is not directly measured, but indirectly determined by other measured parameters, which are combined together in a model allowing the determination of a deposition value (generally deposition velocity).
Another field involving aerosol deposition looks at deposition in closed indoor rooms or environments. The objective of such studies is similar to that of outdoor research activities, i.e., to characterize particle transfer related to contamination, pollution and air quality. These studies examine different applications on air quality in cleanrooms (Menant et al. Citation2015; Tovena Pecault, Godefroy, and Escoubas Citation2017), car cabins (Gong, Xu, and Zhu Citation2009; Ding et al. Citation2016), classrooms (Shaughnessy and Vu Citation2012; Laiman et al. Citation2014), offices (Smolík et al. Citation2005; Nygren Citation2006) or in the home (Lai Citation2002). The measurement method most commonly used in indoor environments is determination of the deposition rate coefficient (Lieberman and Rosinski Citation1962; Jonas and Lindenthal Citation2000; Vette et al. Citation2001; Mosley et al. Citation2001), which is an indirect technique, but some recent optical developments for cleanrooms also use a direct method of surface concentration measurement.
Another major field of applications involving aerosol deposition measurement techniques is the field relating to ventilation systems in various industrial sectors and buildings. The focus is the same as for indoor applications: particle transfers need to be known and monitored. In nuclear safety for example, understanding radioactive particle deposition is essential for the characterization of the radioactive mass arriving at the last containment barrier before environmental release, i.e., High Efficiency Particulate Air filters (Burkett et al. Citation1984; Herranz et al. Citation2010). It is also important to determine where the radioactive deposit mainly occurs: the radioactive load can therefore be known for the protection of maintenance workers against radioactive contamination. In other industrial plants, or in public buildings, aerosol deposition in ventilation ducts is also a safety concern: contamination of the ventilation ducts in the food-processing industry (Ben Othmane et al. Citation2010; Da et al. Citation2015), contamination of indoor spaces in the electronics or pharmaceutical industries (Whyte and Eaton Citation2016; Litvak, Gadgil, and Fisk Citation2000; Farrance and Wilkinson Citation1990), as well as the recent concern relative to the COVID-19 pandemic, where SARS-CoV-2 aerosol loss rate by deposition is a topic of discussion in reducing the risk of infection (Miller et al. Citation2021). Beyond these safety considerations, air quality from HVAC systems is an important issue for human comfort and monitoring deposition enables us to define criteria to measure the cleanliness of ventilation ducts (Lavoie et al. Citation2010, Citation2011; Zuraimi Citation2010). In all these studies looking at aerosol deposition in laboratory ducts, local measurement techniques are preferentially used to characterize deposition using numerous direct techniques for measuring a mass or number aerosol concentration on an inner surface of the ventilation duct.
At a smaller scale compared to ventilation ducts, many studies have been carried out on particle deposition in aerosol sampling lines. These sampling lines are used to sample aerosol particles and convey particles to a size and/or concentration measurement device (Stenger and Bajura Citation1982). Deposition in sampling lines is historically one of the main applications of aerosol deposition studies. Many experimental and theoretical studies have been conducted in this field and have led to many correlations and modeling issues, as it is essential in aerosol metrology. The sampling tubes are generally small (diameter ranging from mm to cm), of circular cross-sections and with a minimum number of singularities to avoid deposition (Chen and Pui Citation1995; McFarland et al. Citation1997). Deposition in sampling lines is generally characterized by measuring aerosol penetration, using either direct (e.g., using fluorescence spectroscopy) or indirect measurement techniques (e.g., upstream and downstream bulk concentrations).
Another field in which aerosol deposition is a major concern today is deposition in the respiratory system, in both the upper airway and in the pulmonary alveolar region. Here, deposition increases the risk of diseases like respiratory infections, asthma and cardiovascular diseases (Newman et al. Citation1982; Falcon-Rodriguez et al. Citation2016). From another point of view, by knowing more about where and how particles deposit in airways, respiratory drug delivery and efficiency could be better controlled (Duan et al. Citation2020; Darquenne Citation2012; Heyder Citation2004). Experimental studies of deposition in the respiratory tract are very specific (Schlesinger Citation1985) and the few deposition measurement studies that do exist generally employ indirect techniques.
As we have seen, aerosol deposition is measured for many different applications and deposition is not a ready-to-measure parameter: a review of the actual methods and developments therefore appears necessary. The objective of this review is to describe the direct deposition measurement techniques existing for aerosol deposition characterization and used in the different fields of application mentioned above. These measurement methods are, for the most part, laboratory-based. In the first, theoretical, section, the aerosol deposition variables and the associated equations are briefly presented and classified under local and global measurements, leading to the selection of the measurement techniques specifically focusing on direct measurement of the deposition flux. The article is then organized in two parts: the first for the presentation of deposited mass concentration measurement techniques and the second for the deposited number concentration measurement techniques. These different techniques are then described in detail, focusing on their principles, their sensitivity, their dependence on environmental parameters and their level of development and applicability.
2. Theory
In order to qualify and monitor aerosol deposition measurement, the first question to be asked is whether the deposition is observed on a specific place or on the whole system. Two measurements are classified: a) the global deposition measurement integrates all the variations over a surface: regardless of any local variations, the measurement will give a “mean” value without providing information on the homogeneity of the deposition on the surface; b) the local deposition measurement enables us to measure deposition in specific places. The size of the surface does not govern whether we work with a local or a global technique. For example, in the nuclear field, a local measurement technique can be useful to find out the quantity of deposited radioactive particles, which is essential for detecting hotspots. In the food industry, global deposition measurement can help us to determine whether or not the system is unclean.
2.1. Global deposition measurement
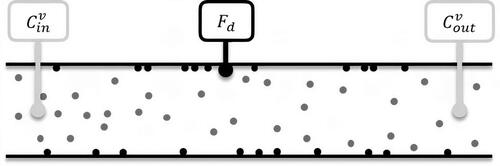
Global deposition measurement is intensively used for many different applications, such as sampling tubes (Pui, Romay-Novas, and Liu Citation1987) and chambers or rooms (Thatcher et al. Citation2002). There are two ways to qualify deposition using a global approach. This entails determining the deposited fraction or determining the particle concentration decay throughout a particle deposition rate
(s−1). and 2 illustrate these two relations. shows the deposited fraction including the deposited particles, regarding the initial concentration at an upstream sampling point and final concentration obtained at a downstream sampling point. Here, the measured volume concentration upstream and downstream of the channel enables us to determine the deposited fraction. In the case of a constant volume flow, the deposited fraction
is expressed as:
(1)
(1)
where
is the inlet (or initial or upstream) and
the outlet (or final or downstream) volume concentration (particles.m−3 or kg.m−3) for the entire surface contained between the two sampling points. In this case, the measurement of the inlet and outlet concentrations is representative of the concentration on the tube section if the aerosol concentration over the tube section is homogeneous, which is generally the case for sampling tubes, since the concentration profile has had time to fully develop. Measuring
does not provide a local deposition measurement, as deposition is integrated over the whole length of the tube between the two points.
Figure 1. Global deposition in a channel with flux conservation.
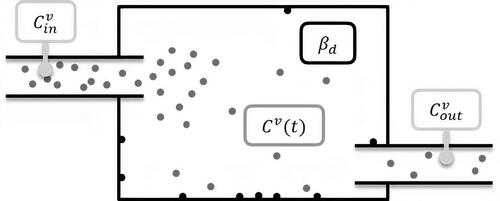
represents the second method for obtaining global deposition by determining the particle deposition decay rate (s−1) only considering aerosol deposition and ventilation as sink terms and constant source terms. The decrease in aerosol volume concentration over time (Lai, Byrne, and Goddard Citation2002; Xu et al. Citation1994) is:
(2)
(2)
where
is the volume concentration at time
represents all the possible source terms, such as aerosol injection, and
the particle decay rate (s−1) related to ventilation. The concentration in the volume studied (generally a room or a chamber) must be homogeneous to apply this relation, which is a first drawback of this technique. When solving this differential equation considering the concentration decrease (namely, no particle injection and no source term; with
the initial volume concentration), the concentration over time is:
(3)
(3)
with the second and main drawback of this technique being that the influence that the orientation of the surface has on deposition cannot, generally, be evaluated, although the effect of gravity is noticeable on larger particles given increasing deposition on floor surfaces, as opposed to ceiling surfaces. Some authors (Abadie, Limam, and Allard Citation2001) introduce a specific modeling, so that a decay rate for each surface (vertical, angled, horizontal, etc.) can be deduced. To conclude, the major drawback of deposition rate is the requirement for homogeneous concentration and steady flow, and the difficulty in determining the deposition on differently oriented surfaces.
Figure 2. Global deposition in a room with flux conservation.
These two methods for determining a deposited fraction or the deposition rate are based on volume concentration measurements, which can be performed using conventional aerosol concentration measurement techniques. As a result, the associated measurement techniques will not be described in detail in this article and the reader should refer to standard aerosol concentration measurement techniques, which are well described in some reviews (Soysal et al. Citation2017; Amaral et al. Citation2015; Wilson et al. Citation2002; Baron and Willeke Citation2001; Prévost Citation1997).
2.2. Local deposition measurement
Local deposition is characterized by the deposition flux on the surface (particles.m−2.s−1 or kg.m−2.s−1).
depends on many different mechanisms: sedimentation, turbulent and Brownian diffusion, inertia, interception, turbophoresis, electrophoresis and thermophoresis.
can be measured either by counting deposited particles or by measuring a mass on a surface
(4)
(4)
where
(particles.m−2 or kg.m−2) is the surface concentration,
is the number or the mass of particles on the surface and
is the time of exposure to the deposition (s).
The deposition flux can also be obtained by measuring concentration gradient. The concentration gradient measurement is generally used for outdoor quantification of aerosol deposition, as measuring concentration gradient is easily done in the atmospheric constant flux layer (Garland and Cox Citation1982; Phillips Citation2004; Matsuda et al. Citation2010). To compare, the atmospheric constant flux layer can reach several hundreds of meters, whereas in a ventilation duct, the boundary layer is only around a few millimeters (Ben Othmane Citation2011; Taheri, Khoshnevis, and Lakzian Citation2020). For atmospheric measurements, the flux in the boundary layer is usually expressed as (Phillips Citation2004; Matsuda et al. Citation2010):
(5)
(5)
where
as the flux is assumed constant.
and
are the Brownian and turbulent diffusion coefficient (m2.s−1) respectively,
is the mean volume concentration in the boundary layer (particles.m−3 or kg.m−3), and
is the height relative to the surface.
The deposition flux can also be expressed by eddy correlation, based on the covariance between the instantaneous aerosol volume concentration () and the instantaneous vertical velocity (
– m.s−1) (Roupsard Citation2013):
(6)
(6)
where is the sedimentation velocity (m/s). This method is also widely used in outdoor studies: to obtain a flux value, the vertical wind velocity and the concentration need to be measured. The devices used for these measurements must have a measurement frequency that is fast enough to capture all the variations. This implies that the devices do not have to disturb the flow. Many other assumptions are made in applying the formula Equation(6)
(6)
(6) , as described by Burba (Citation2013).
In this review, we will focus on techniques providing deposited particle mass or deposited particle number measurements, which will be presented in detail, in Sections 3 and 4, respectively. One drawback of local measurement is the representativeness of this measurement: if the aerosol deposition is not uniform over the whole surface studied, the extrapolation of a local deposition flux over the whole surface is questionable. For example, in large ventilation ducts with variation of curvature (bend) or section (reduction), several local deposition measurements need to be performed in order to extrapolate the results over the whole singularity.
2.3. Synthesis
summarizes the information regarding global and local parameters used to characterize aerosol deposition.
Table 1. Synthesis of deposition parameters.
As we can see from this table, most of the methods used to determine local or a global deposition are based on aerosol volume concentration. Many devices and techniques can be used to measure aerosol volume concentration, as described in the book by Baron and Willeke (Citation2001). The majority of these devices are necessarily used with aerosol sampling, which implies its own specific constraints (deposition in sampling lines, isokinetic sampling required for polydisperse aerosols, etc.).
Measurement of a decay rate also entails sampling considerations. It is a simple parameter, commonly used in indoor environments, but the homogeneity of the concentration inside the chamber needs to be checked and the deposition does not distinguish between the different surfaces of the chamber, except if some semi-empirical modeling is introduced to the mass balance equation.
The local deposition flux can be extrapolated over a whole surface if the flow conditions do not change and should be used carefully under specific flow with geometrical variations of the deposited surface. However, the local measurement of surface concentration is the only method which considers a direct measurement of the aerosol deposited over a surface. This method will therefore be explored in detail in this article, by focusing on two ways of determining the concentration collected on a surface:
mass of aerosol particles deposited on a surface (surface mass concentration, kg.m−2),
number of aerosol particles deposited on a surface (surface number concentration, particles.m−2).
These two variables can be measured using different techniques, which will be described in the following two sections.
3. Mass surface deposition measurement
In this section, we present the measurement techniques which provide a mass concentration of deposited aerosol particles over a surface by collecting these particles. As will be seen, different techniques can be found, all of them generally being laboratory-based and not “ready-to-use” techniques. A description of the principle of each technique is given below. To be able to interpret the measured deposited mass surface concentration, the aerosol size distribution should be monodisperse for all these techniques.
Other techniques require sampling particles in order to analyze deposited particles on a surface (Peillon et al. Citation2020; Lavoie et al. Citation2007; Holopainen et al. Citation2002), while others focus on estimating deposition by studying the darkening of a surface due to deposited particles (Landis et al. Citation1996; Schneider et al. Citation1996). The techniques requiring sampling particles and those studying surface darkening will not be described since the former modify the deposition (particles are sampled, not collected) and the latter only study surface darkening by the deposited particles and do not give a mass measurement.
3.1. Weighing
The most basic technique for measuring a mass concentration is to weigh the surface of deposition before and after aerosol deposition. The weighing technique is essentially used to weigh filters or material on which the deposition takes place (Lai et al. Citation2017; Licina and Nazaroff Citation2018).
Weighing samples requires that the deposited mass (i.e., the deposited concentration) is weighty enough, given that the most precise scales are precise to 0.1 µg. The most precise weighing scales are electronic scales. ISO 15767:2009 standard recommends certain practices in order to avoid bias and minimize measurement uncertainty, with regard to workplace atmospheres.
To conclude, the advantage of this technique is its user-friendliness. This technique is well known and widely used; however, it provides neither an in situ measurement (the sample containing collected deposited particles needs to be retrieved and brought to the weighing device) nor a real-time measurement, and is not suitable for low mass deposition. For example, to obtain a mass of 10 µg on a filter of 47 mm diameter, the deposited mass concentration must be at least 6 µg/cm2.
3.2. Fluorometry
Fluorometry, also called fluorescence spectroscopy, is used in many different applications, such as environmental particle deposition (Maro et al. Citation2014), in resuspension phenomenon (Wu, Davidson, and Russell Citation1992) or ventilation systems (Da et al. Citation2015). Fluorometry method requires a fluorescent tracer and a fluorescent spectrometer.
Fluorescence spectroscopy is based on excitation of fluorescent molecules, which consequently emit fluorescent light – corresponding to a specific wavelength – captured by a detector. By using a simplified version of the Beer-Lambert law, the tracer volume concentration (g.l−1) in a solution is linked to the fluorescence emission intensity
Different fluorescent particles are used in the scientific community depending on the experiment being conducted. All forms of fluorescent molecules are useable, including fluorescein solved in oil or aqueous solutions. For example, Okazaki and Willeke (Citation1987) use a uranine oleic acid solution to generate their fluorescent aerosol, whereas Sato, Chen, and Pui (Citation2002) use an aqueous solution of ammonium fluorescein. Different fluorescent molecules are used indiscriminately, such as ammonium fluorescein (Sippola and Nazaroff Citation2004; Lai and Nazaroff Citation2005) or sodium fluorescein, also called uranine (Da et al. Citation2015; Okazaki and Willeke Citation1987; Wu, Davidson, and Russell Citation1992; Sato, Chen, and Pui Citation2002; Maro et al. Citation2014; Sow, Leblois, and Gensdarmes Citation2019). Other researchers use vitamin E (Wilson et al. Citation2002) to conduct deposition measurements in a ninety-degree pipe bend; or vitamin B2 (riboflavin) (Cohen Hubal et al. Citation2005). Riboflavin is used to play the role of a pesticide, enabling quantification of residue and pesticide exposure.
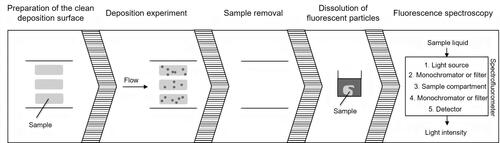
The different steps used to obtain the particle deposition concentration using fluorometry are presented chronologically in . The first step is to choose a deposition surface. Sometimes the sample is fixed to the wall and then removed after the deposition of aerosols on this sample (case presented in ), e.g., Wu and Young (Citation2012) coat their bend with transparent film to collect particles on the bend surfaces. In most experiments performed with the use of fluorometry, the surface is a filter (Sow, Leblois, and Gensdarmes Citation2019; Thatcher et al. Citation2002; Chen and Pui Citation1995). However, using a removable sample induces changes in the surface wall in a hydrodynamic sense (i.e., a change in the roughness, boundary layer, and flow), hence a change in the aerosol deposition. On the other hand, the deposition surface can be delimited by a sort of stencil installed after deposition then wiped, as used by Da et al. (Citation2015), or the surface itself can be removable (wall panel) and washed after the particles have been deposited (Sippola and Nazaroff Citation2004). In these cases (wiping or washing), no hydraulic boundary layer differences are induced. As in the third part of , the substratum, if removable (e.g., a filter), is put in a specific volume to dissolve all fluorescent particles. If the deposition surface is not removable, the same treatment is applied for wipes used for cleaning the delimited surface. Attention needs to be paid to the whole fluorescein dissolving process (Kasavan and Doherty Citation2000) and to the nature of the dissolving solution (for example, the use of uranine requires an alkaline solution). The deposited mass surface concentration can be simply obtained by multiplying by the dissolving volume, divided by the deposition collection surface.
Figure 3. Fluorescence spectroscopy – stages.
Fluorescence spectroscopy is not an in situ technique, as the deposited mass is not measured directly at the deposition location. It is highly accurate, as the minimum concentration measurements are low (Sow, Leblois, and Gensdarmes (Citation2019) present a detection limit for of
ng/l) but to our knowledge, no limits for the detection of deposited mass have been presented in studies in the literature. The impossibility of real-time measurement is restrictive and the technique is time-consuming (Lai Citation2002).
A similar technique, providing a volume concentration, is used for bioaerosol deposition measurement. The deposited particles traced with fluorescent molecules are treated in solution according to a specific protocol, generally to isolate bioaerosols from aerosols (Araya, Cazorla, and Reche Citation2019). The volume concentration is then measured by flow cytometry: particles pass one by one through a laser beam and are counted using light scattering (Brussaard Citation2004). Some experimenters use this technique to measure dry deposition of viruses and bacteria (Morales-Baquero and Pérez-Martínez Citation2016; Reche et al. Citation2018).
To conclude, fluorometry provides high levels of sensitivity and adaptability. This technique is well known and widely used. Fluorometry also enables a choice regarding the size of the deposition surface. Depending on the chosen protocol, the surface deposition is not necessarily modified by the deposition measurement protocol. However, this technique provides neither an in situ nor a real-time measurement.
3.3. Photovoltaic signal
Another laboratory-based technique for the determination of particle mass collected on a surface is based on a current intensity delivered by a photovoltaic cell, which plays the role of the deposition surface.
Rondeau (Citation2015) chooses to correlate the power produced by a photovoltaic cell to the deposited concentration, based on the principle that the power produced by the photovoltaic cell is sensitive to light obscuration due to particle deposition. Calibration is performed by building a graph with several known quantities of aerosol deposited on the photovoltaic cell according to the intensity crossing the solar cell. The solar cell is weighed with the deposition to measure the deposited mass. The surface concentration is therefore known beforehand. The corresponding fit curve is the calibration curve, which is then used during the experiment to deduce the surface concentration from a current intensity measurement.
Extinction with a photovoltaic cell provides an in situ measurement. This can be adapted to a “sequential” real-time measurement as soon as the deposited mass causes a significant variation in the light and before the cell is saturated. However, the technique is harder to set up on a large surface due to the difficulty of having homogeneous light flux over the whole surface. The measured concentration on the photovoltaic cell is the most precise when surface concentration is lower than 2 mg.cm−2 according to El-Shobokshy and Hussein (Citation1993), as photovoltaic cells are more sensitive to deposited mass variations when surface concentration is below this value. To our knowledge, no detection limit has been presented in the open literature. However, this limit depends on the capacity of the cell to detect a change in light due to deposited particles. In addition, to increase the sensitivity of the photovoltaic signal technique, experimenters need to verify whether particles are deposited in only one layer over the surface.
Although the measurement of a photovoltaic signal is not often used, there are many studies that focus on photovoltaic cell aging due to dust deposition (Jiang, Lu, and Sun Citation2011; Mani and Pillai Citation2010; Darwish et al. Citation2015; Saidan et al. Citation2016; Kazem et al. Citation2020) and we should see some new advances in aerosol deposition measurements in the future.
To conclude, photovoltaic signal measurement technique is not a technique that is commonly used to measure aerosol deposition. Its sensitivity depends on the quality of the photovoltaic cells. This technique provides an in situ measurement without modifying the deposition surface and a sequential real-time measurement.
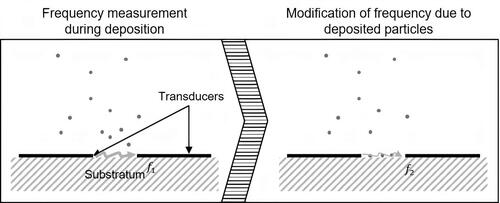
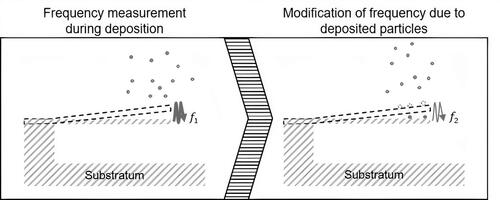
3.4. Acoustic wave mass sensors
Surface Acoustic Wave (SAW) sensors are miniaturized devices used in R&D studies, which means that they are not ready-to-use sensors: mass deposited on their surface can be correlated to a shift in frequency correlated to a mass load. All acoustic wave mass sensors are composed of a piezoelectric part that produces an acoustic wave. By studying the velocity and amplitude changes of the acoustic wave, deductions can be made regarding resonance frequency. Frequency is measured using a frequency counter. The precision of the counter depends on its timebase stability. Precision is also enhanced by measuring over a long time period. All acoustic wave mass sensors play the role of deposition surface.
SAW sensors are built with two transducers and the SAW propagates in between them, as shown in . Bowers, Chuan, and Duong (Citation1991) developed a SAW microbalance for mass measurement to collect monodisperse olive oil particles by impaction on the resonator and attained a 3 pg limit of detection. Hao et al. (Citation2014) provide the equations applicable to the mass measurement of a SAW focused on PM2.5 monitoring. The limit of detection of their sensor is estimated at 0.17 ng. A SAW sensor dedicated to particulate matter detection has been developed by Thomas et al. (Citation2016). They measure masses of less than 1 ng in experiments performed using five different types of particle for eight different diameters. It should be noted that SAW sensors are sensitive to ambient conditions, such as temperature and humidity (Liu et al. Citation2016).
Figure 4. Operation of a Surface Acoustic Wave (SAW) sensor.
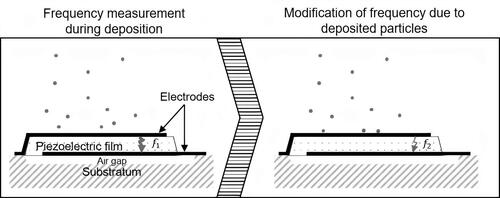
Another acoustic wave mass sensor is the Film Bulk Acoustic Resonator (FBAR). This resonator is built with two electrodes, a top and a bottom one, with a piezoelectric film in between (see ). The structure is suspended over an air gap that maximizes reflection of the propagated acoustic wave. Campanella et al. (Citation2006) present an FBAR for biomolecular applications. They obtain a minimum detectable mass change of 1 pg for deposition of a distributed loading (magnesium fluoride vapor deposition) and of 7 fg for a localized loading (amorphous compound containing carbon, platinum and gallium). Campanella et al. (Citation2008) also reveal an effect of loading location on the sensor response. FBAR are also used by Paprotny et al. (Citation2013), who collect particles using thermophoretic precipitation and measure particulate matter from diesel exhaust and tobacco smoke.
Figure 5. Operation of a Film Bulk Acoustic Resonator (FBAR).
To conclude on acoustic wave sensors, which include SAW sensors and FBAR, it can be said that they are very small sensors with high sensitivity. They entail a modification of the deposition surface since they are placed on the given surface. The thickness of the surface of these sensors is around 1 or 2 mm. These sensors provide an in situ measurement and a “sequential” real-time measurement: the real-time measurement is interrupted by saturation.
3.5. Resonant mass sensors
Micro-Electro-Mechanical Systems (MEMS) and Nano-Electro-Mechanical Systems (NEMS) are micro and nanoscale small detectors, respectively, used in many research fields, although they are still being developed and cannot be considered to be ready-to-use sensors. An extensive review of aerosol mass concentration measurements (Soysal et al. Citation2017) presents the development and progress made in recent years on these sensors. These systems have a vibrating structure, on which particles can be deposited, thereby modifying the vibration frequency, which is related to mass concentration. MEMS/NEMS work like mechanical damped harmonic oscillators. For example, a cantilever MEMS is presented in .
Figure 6. Operation of a cantilever Micro-Electro-Mechanical System (MEMS).
Hajjam, Wilson, and Pourkamali (Citation2011) define MEMS/NEMS resonance frequency (s−1) as:
(7)
(7)
where
is the effective spring constant (kg.s−2) and
(kg) is the effective mass of the resonator. The mass MEMS/NEMS limit of detection
is calculated by:
(8)
(8)
where
is the quality factor of the sensor and is defined as the ratio between the frequency and the resonance width. To perform very sensitive mass measurement, MEMS/NEMS should have high frequency and high
and be lightweight. For the moment, MEMS/NEMS mass sensors are mainly found in the R&D field and are not manufactured.
MEMS and NEMS are used to measure different kinds of aerosols. Bioaerosols are studied using MEMS resonators (Nugaeva et al. Citation2007; Gupta, Akin, and Bashir Citation2004). Zielinski et al. (Citation2016) measure particle mass on a piezoelectric bulk acoustic mode resonator with an impactor to collect aerosols.
NEMS have a lower limit of detection than MEMS due to their smaller size (around a few µm). Yang et al. (Citation2006) measure in situ and in real-time zeptogram-scale mass with adsorbed gaseous species. A mass resolution of 740 ag has been achieved from diffusion to inertial impaction on a nanomechanical resonant fiber (Schmid et al. Citation2013) to 31.6 fg with electrostatic precipitation of particles on a silicon nanowire NEMS resonator (Wasisto et al. Citation2013). Hajjam, Wilson, and Pourkamali (Citation2011) improve the level of frequency and -factor value by thermally actuating the MEMS. This allows a more uniform mass sensitivity than other actuation methods. However, as Davila et al. (Citation2007) highlight, long cantilevers are less sensitive than smaller ones due to the irregular sensitivity of MEMS sensors with cantilevers (Park et al. Citation2012). Dohn et al. (Citation2007) work on linking the position and the mass of deposited particles and their influence on sensor frequency. MEMS and NEMS are extremely sensitive to ambient conditions (pressure, temperature, relative humidity, etc.). Also, the active surface of these sensors is very small so it quickly becomes saturated. As a result,
decreases and the sensor effectiveness decreases too. Dry and wet cleaning procedures have been developed to fully remove particles from the surface. These procedures are efficient, but they generally require that the sensors be removed from the experiment to be cleaned, thus interrupting real-time measurement. New procedures need to be developed to provide a real-time regeneration process. Additionally, the response time of MEMS and NEMS is short, so it does seem possible to attain real-time measurement. These sensors also have the advantage of presenting relatively low production costs for the laboratory equipped with them, as the sensors are produced by a batch process, and their power consumption is also very low.
To conclude, MEMS and NEMS are macro and nanoscale sensors affording the lowest limit of detection of all the mass surface deposition measurement techniques. Due to their very small size, they are very sensitive to ambient conditions. These sensors imply a modification of the deposition surface. They do provide an in situ measurement and a “sequential” real-time measurement (interrupted by sensor saturation). MEMS and NEMS are laboratory techniques but are rapidly developing.
3.6. Soot sensors (conductive particles)
Some sensors have been developed in order to quantify soot deposition and, more generally, conductive particle deposition. In particular, they are used for on-board diagnosis in the car industry, for example, applications using Diesel Particulate Filters (DPF). There is, therefore, significant development of micro and nano-sensors, even though they as yet remain noncommercial products. Although all acoustic wave mass sensors can be adapted and/or used for soot deposition measurement, different kinds of sensors for soot measurement applications are developed: resistive sensors and capacitive sensors are presented below.
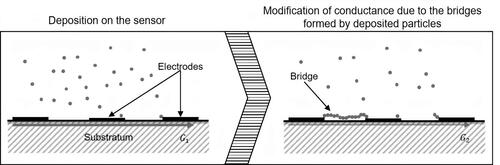
Resistive sensors are made of two electrodes on a substratum. The conductance measured between the two electrodes is equal to zero before deposition. When particles are deposited between the electrodes, bridges are created thanks to the conductive properties of soot particles (mostly carbon-based), as presented in . The measured conductance increases according to deposited mass. The speed with which conductance increases is linked to soot deposition concentrations, particle size and particle composition (Feulner et al. Citation2015). The sensor needs to be regenerated by burning soot particles after reaching saturation point, using a resistance that heats and burns the soot particles to about 600 °C (Grondin et al. Citation2016). The orientation of electrodes plays a role in the signal measurement (Hagen et al. Citation2014). The effect of particle size on percolation time (the time it takes for bridges to appear) is investigated by Reynaud et al. (Citation2019). They notice that small particles increase this percolation time. These sensors are sensitive to ambient conditions, such as relative humidity and the orientation of the sensors is also important (Kort et al. Citation2019, Citation2021).
Figure 7. Operation of a resistive sensor.
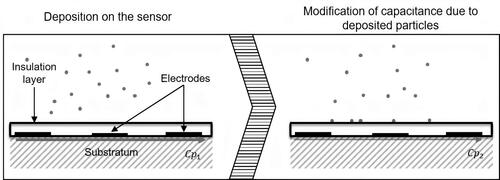
Among soot sensors, capacitive sensors are similar to resistive sensors but their electrodes are covered with an insulating material (see ). Capacitance measurement is performed, and
decreases with the mass loading. Kondo et al. (Citation2011) work on improving their capacitive sensor by using base metal electrodes, rather than noble metal ones, as commonly used (platinum, for example). Furthermore, sensor performance can be improved by enhancing the imposed voltage between the two electrodes. However, this voltage implies a modification of particle collection phenomenon: electrophoresis enhances soot deposition on the sensor. Hagen et al. (Citation2018) study the effect of different voltage values imposed between the electrodes. As the voltage is enhanced, soot temperature rises and causes thermophoresis to occur. Comparing capacitive sensors and resistive sensors, capacitive sensors are more complex, as measuring small capacitances with high resolution is more difficult than measuring current value (related to conductance).
Figure 8. Operation of a capacitive sensor.
To conclude, soot sensors include resistive and capacitive sensors. The size of these sensors (i.e., the size of the deposition surface) is linked to the number of electrodes chosen during the construction process. Soot sensors entail a modification of the deposition surface and are sensitive to ambient conditions. They provide an in situ measurement and a “sequential” real-time measurement, as measurement is interrupted by saturation.
3.7. Synthesis
The specific characteristics of the different methods found to determine mass concentration on a surface are summarized in .
Table 2. Measurement techniques of mass surface deposition.
Regarding real-time measurement, acoustic wave mass sensors, resonant mass sensors and soot sensors present similar characteristics. They do not perform real-time deposition measurement but a kind of sequential real-time measurement: even though the measurement frequency is high, saturation of the sensors interrupts measurement.
On the one hand, all the sensors are intrusive aerosol deposition measurement techniques. As deposition is directly measured on the surface of the sensors, these sensors need to be installed on the surface where deposition will take place, hence changing the nature of the deposition surface. On the other hand, all the sensors provide an in situ measurement, unlike the weighing technique and fluorometry, as experimenters can install the sensors on the surface of the experiment and measurement is performed where the deposition takes place.
Regarding the calibration process, the sensors are more difficult to manage than weighing scales: the sensors are not yet marketed (whereas weighing scales are easily found on the market) so experimenters need to develop them at their laboratory and then qualify the sensors. In general, these sensors also need to be calibrated almost every time an experiment is carried out due to the difficulty of controlling several parameters, such as ambient and intrinsic conditions.
Regarding the size of the deposition surface, weighing scales, photovoltaic signal and fluorometry techniques can provide a deposition measurement on larger surfaces than those studied using small sensors (SAW, MEMS, etc.) and photovoltaic signal technique (difficulties obtaining homogeneous light flux over large surfaces).
Regarding the intrusiveness of the techniques, fluorescence spectroscopy associated with wiping or washing the deposition surface is the only technique which provides an aerosol deposition measurement without modifying the deposition surface, as most of the other techniques require either a specific surface (like a transparent surface) or an additional surface which is generally the sensor itself.
Regarding the directly measured variable, weighing scales are the only way to directly get a value of deposition measurement; whereas with the other techniques, an initial variable is measured (for example, frequency), which must then be converted into deposited mass, entailing calibration processes.
Regarding the specificity of the techniques, fluorescence spectroscopy and soot sensors are both techniques that require a specific type of aerosol, a fluorescent aerosol (or an aerosol traced with fluorescent material) and a conductive aerosol, respectively. For the other techniques, any type of aerosol can be used.
4. Number surface deposition measurement
For all the techniques described in this section, the aerosols studied may have either a monodisperse or a polydisperse size distribution.
4.1. Optical counting on surfaces – laboratory-developed techniques
Optical counting is a method that provides deposited particle number concentration measurement. The technique is presented in . The deposition surface needs to be delimited first and is lit by a lighting system, which provides contrasting luminosity, thus helping to differentiate between particles, noises and substrate material. The delimited surface is placed facing an optical detector, such as a microscope or a macro-objective connected to a camera. In the past, particle counting was performed manually by the user, as by McCready (Citation1986), by performing particle deposition on a transparent plate and using a microscope. More recently, Wagner and Leith (Citation2001) and Boor, Siegel, and Novoselac (Citation2013) choose to study the deposition on a filter using a microscope equipped with a camera, whose pictures were post-processed using a morphometry program or image analysis software to perform particle counting. Image analysis has been extensively developed, enabling the use of open-source imaging software (Barth, Lecrivain, and Hampel Citation2013) or commercial software (Wagner and Leith Citation2001), by programming the imaging analysis (Boor, Siegel, and Novoselac Citation2013) or by using deep learning-based methods for size analysis (Frei and Kruis Citation2020).
Figure 9. Operation of microscope and camera counting.
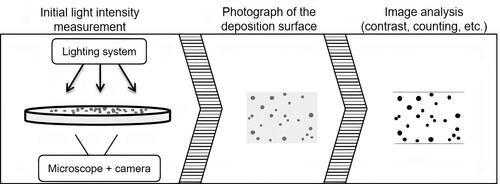
With this imaging technique, the lighting system is placed in front of the aerosol sample (a transparent surface is necessary here) facing the photodetector (a technique also called shadowgraphy). This technique is used by Barth, Lecrivain, and Hampel (Citation2013). In some studies, a lighting system is already integrated into the microscope (Wagner and Leith Citation2001; Boor, Siegel, and Novoselac Citation2013) and the observed surface can be a filter, for example.
To analyze the image given by the microscope, the magnification gives the enlarged size of the object of size
and is expressed as:
(9)
(9)
Regarding a digital microscope linked to a camera, the total magnification can be expressed as:
(10)
(10)
where
is the optics magnification, defined as the product of magnification of each optics instrument:
and
is the digital magnification, defined as the ratio between monitor screen size and camera sensor size on the sensor
If 4 pixels are considered the minimum to represent one particle in the image and the camera has a pixel size
of 7 µm and the magnification is 2, the minimum aerosol size
that can be observed is:
(11)
(11)
However, is limited by the existence of the Airy disk, due to the diffraction of light, in the case of reflection microscopy. Shadowgraphy can be used to avoid this limit, by observing the shadow of the particle thanks to the photodetector facing the lighting system.
As counting distinguishes the different diameters of particles, the aerosol size distribution can be polydisperse. Also, in most cases, optical counting methods are non-intrusive and therefore do not modify deposition. Optical counting is an in situ measurement technique, as the deposited particles are directly observed on the deposition surface; and the uncertainty depends on the optical devices used for the experiment. Barth, Lecrivain, and Hampel (Citation2013) estimate uncertainty around 20%, whereas Boor, Siegel, and Novoselac (Citation2013) presents a 5% uncertainty on particle counting.
Optical counting enables us to determine the exact number of deposited particles, related to the diameters of these deposited particles. The quality of this technique rests on the quality of a) the optical instruments (lens and camera) used, b) the lighting system and c) the accuracy of image processing. Also, working distance ( – m) is dependent on magnification
The following empirical formula provides a relationship between
and the focal length
(m) and
(12)
(12)
However, when is increased,
decreases, which is challenging as "standard” manufactured systems do not have great magnification combined with a working distance over 40 cm.
To conclude, the optical counting technique is a laboratory-developed technique. The experimental protocol can vary significantly from one experiment to another, as optical instruments and image processing are chosen by the experimenter. Consequently, the optical counting techniques are adaptable to different experiment configurations and to different particle diameters. Optical counting techniques entail a modification of the surface, except in the case of using shadowgraphy in an experiment made up entirely of transparent surfaces. The minimum size of particles that can be counted and the sensitivity of the optical counting technique also depends on the choice of instruments and processing. Further, the choice of instruments and processing must be made in relation to the possible working distance and the size of the particles studied in the experiment. Optical counting techniques provide an in situ measurement.
4.2. Counting techniques available on the market
These devices do not enable measurement of aerosol deposition on a given surface, but only on the specific surface for which they were designed. All their surfaces are transparent. In the section below, only the global measuring principle is described for each device and their technical characteristics are listed in .
Table 3. Measurement techniques of number surface deposition.
The Cleapart-100 (Bertin Instruments) measures particle deposition by counting and classifying particles by their size. The Cleapart-100 was developed initially by Winlight company to monitor air quality in cleanroom environments. The measuring system is an optical system placed beneath the surface, based on a microscope lens and a camera. According to Tovena Pecault, Godefroy, and Escoubas (Citation2017), the uncertainty is estimated at 1%.
The Particle Deposition Meter (PDM, SAC) is similar to the Cleapart-100. The PDM also contains an optical system, but the circular deposition surface can be examined after the deposition experiment, by placing the surface on the PDM device.
The Advanced Particle Deposition MONitor (APMON, Technology of Sense) is based on a holographic method: deposited particles generate interferences in laser beam waves, which are then analyzed using Fourier transformation method to enable particle counting. The device is composed of a cartridge containing glass plates placed at a 45° angle. Aerosols deposit on the glass plates and, thanks to the holographic method, the size distribution is provided.
The PFO 1000 MONITOR (XCAM) comprises four CMOS sensors associated with an algorithm, which analyzes deposited particles. Alarms can be programmed by the user to be notified when the detection surface is close to being completely obscured.
The Micro-sensor for cleanrooms (CNES) has been developed (Menant Citation2016) to provide a better resolution than the other devices presented for space applications As this micro-sensor can be used for cleanroom applications, the developers assumed that particles larger than 20 µm are removed by the airflow control system. The Micro-sensor for cleanrooms is based on optical detection (Menant et al. Citation2015). The deposition surface is transparent, and the scanning system is made of two parts, one on each side of the surface: a laser diode and a focusing assembly is placed on one side and the detection system is on the other side.
4.3. Synthesis
gives the principal features of number surface concentration measured using deposition measurement techniques. These techniques are divided into two groups: laboratory-developed techniques and commercially available counting techniques. All these techniques can be used to obtain high frequency measurement but do not provide real-time measurement, as the optical systems need to move to scan the whole surface. Any type of solid aerosol larger than 10 µm, can be used with these techniques. However, the deposition surface is an integral part of the devices: the device can only be used for scanning its own deposition surface.
Laboratory-developed techniques have the advantage of being more adaptable. Each experimenter can choose and decide on the equipment most fit for purpose. Also, the optical devices can be chosen according to the experimenter’s need: optical devices are not necessarily the same when it comes to counting small particles (around 4 µm, for example) and large particles (around 50 µm). The images can be treated using dedicated software or with an in-house developed code. For example, there are recent developments in image treatment using deep learning. Also, the experimenter can choose the size of their deposition measurement surface. Laboratory-developed optical counting techniques thus require some precise theoretical knowledge in order to be implemented: the monitoring system, the detection system and the image processing system need to be properly considered and set up.
On the other hand, commercial devices are all-in-one turnkey techniques. Software is provided to monitor deposition, so these devices are more user-friendly. Most of the devices available on the market have been developed and assessed in the framework of cleanrooms, but could be used for other applications, such as contaminant deposition in the home or in industry (for example in the food-processing industry). The measurements performed by these devices are all based on an optical system, which provides particle classification according to size, except for the PFO 1000 Monitor, which analyzes the obscuration of the deposition surface. Commercial devices are less adaptable than laboratory-developed techniques, especially as the former have their own deposition surface, meaning that surface size and type cannot be decided by the experimenter and, consequently, there will be surface modification for aerosol deposition and they are not directly applicable for applications in which the objective is to study deposition over a specific surface (such as deposition in ventilation ducts).
5. Conclusion
In this article, the theory behind global and local aerosol deposition measurement techniques has first been described in a general way. Local aerosol deposition measurement techniques were then chosen for more detailed analysis. Nine techniques are then presented in this article, each directly providing either a mass or a number concentration measurement in order to obtain a surface deposition flux. These nine techniques are observed in relation to five major criteria: limit of detection; aerosol size distribution; possibility of in situ measurement; possibility of real-time measurement and whether the technique entails a modification of the surface or not. The choice between all these techniques must be made judiciously to ensure precise measurements regarding the experiments conducted.
Small sensors (acoustic wave mass sensors, MEMS and NEMS) have been the subject of significant development in the last decade. Their limits of detection are the lowest of the nine techniques. They are still being developed in the laboratory and, as they have become smaller, measurement is quite dependent on atmospheric conditions. These sensors can be used for small and large solid aerosols. They must be placed on the surface of interest, thus modifying the hydraulic conditions near the surface. They can provide some “sequential” real-time measurements since they need to be cleaned regularly.
Optical techniques, on the other hand, often imply the use of bulky instruments. These have the advantage of being in situ and adaptable: each component parts can be chosen by the experimenter according to their characteristics. Considering a good accuracy, they are only suitable for very large solid aerosols (over 10 µm). Commercial devices for optical counting are generally not used to characterize deposition over a given surface, but are used to estimate deposition over a surface integrated in the device. They generally provide a measurement with a low frequency (around one minute).
For a specific use of particles traced with fluorescent material, fluorescence spectroscopy is the most widely used technique. Thanks to this technique, many different experiment protocols can be designed: fluorescence spectroscopy is adaptable to different setups. This technique does not provide real-time measurement but can be used on the real surface deposition. It is generally used for aerosols below 10 µm. However, this technique requires the use of a fluorescent traced aerosol of a monodisperse size distribution which restricts its use to very specific studies. The limit of detection of fluorometry can be very low for a standard quality fluorescent spectrometer, but spectrometer quality obviously influences the limit of detection.
The study of photovoltaic signals is also based on aerosol observation under light but requires a different observation technique: the darkening of the depositing surface is correlated to the number or mass of deposited particles. This technique cannot currently be considered as validated, but is very promising since a great deal of research is ongoing on dust deposition over photovoltaic surfaces, which may bring some new features for developing this technique and its associated calibration. Photovoltaic surfaces could then be used for solid aerosols of various sizes in a low concentration environment.
Soot sensors belong to a different family of sensors. They were specifically designed for the deposition quantification of conductive aerosols. They are not yet manufactured, as the calibration based on the correlation between the quantity of deposited particles and the measured value (in this case, capacitance or conductance) is challenging.
Most of the nine techniques are laboratory-developed techniques. Only a few are already manufactured and these were specifically designed to quantify aerosol deposition in cleanrooms. They have the advantage of being turnkey products, but are consequently less adaptable to different setups.
Regarding physical properties, the monodisperse aspect of the aerosol size distribution is essential for interpreting mass surface concentration.
Many improvements have been made to sensors in recent years, especially to miniaturized sensors and optical techniques. It is essential to consider all the issues related to deposition mechanisms, as this provides a) information regarding which techniques are the most suitable for one’s experiment and b) better and more precise interpretation and understanding of data. Investigations on aerosol deposition need to be conducted to provide more knowledge and data that can be used to improve our overall comprehension of air quality.
References
- Abadie, M., K. Limam, and F. Allard. 2001. Indoor particle pollution: Effect of wall textures on particle deposition. Build. Environ. 36 (7):821–7. doi:10.1016/S0360-1323(01)00007-5.
- Amaral, S., J. de Carvalho, M. Costa, and C. Pinheiro. 2015. An overview of particulate matter measurement instruments. Atmosphere 6 (9):1327–45. doi:10.3390/atmos6091327.
- Andronache, C. 2003. Estimated variability of below-cloud aerosol removal by rainfall for observed aerosol size distributions. Atmos. Chem. Phys. 3 (1):131–43. doi:10.5194/acp-3-131-2003.
- Araya, C., A. Cazorla, and I. Reche. 2019. Detachment procedure of bacteria from atmospheric particles for flow-cytometry counting. Bio-Protocol 9 (12):e3273. doi:10.21769/BioProtoc.3273.
- Baron, P. A., and K. Willeke. 2001. Aerosol measurement: Principles, techniques, and applications. 2nd ed. New York: Wiley Interscience.
- Barth, T., G. Lecrivain, and U. Hampel. 2013. Particle deposition study in a horizontal turbulent duct flow using optical microscopy and particle size spectrometry. J. Aerosol Sci. 60:47–54. doi:10.1016/j.jaerosci.2013.02.004.
- Ben Othmane, M. 2011. Compréhension Analyse et Maitrise des mécanismes d’encrassement dans les réseaux aérauliques des industries agroalimentaires. PhD diss., Ecole Nationale Vétérinaire Agroalimentaire et de l’Alimentation Nantes Atlantique (Oniris).
- Ben Othmane, M., M. Havet, E. Gehin, and C. Solliec. 2010. Mechanisms of particle deposition in ventilation ducts for a food factory. Aerosol Sci. Technol. 44 (9):775–84. doi:10.1080/02786826.2010.490799.
- Boor, B. E., J. A. Siegel, and A. Novoselac. 2013. Wind tunnel study on aerodynamic particle resuspension from monolayer and multilayer deposits on linoleum flooring and galvanized sheet metal. Aerosol Sci. Technol. 47 (8):848–57. doi:10.1080/02786826.2013.794929.
- Bowers, W. D., R. L. Chuan, and T. M. Duong. 1991. A 200 MHz surface acoustic wave resonator mass microbalance. Rev. Sci. Instrum. 62 (6):1624–9. doi:10.1063/1.1142442.
- Brussaard, C. P. D. 2004. Optimization of procedures for counting viruses by flow cytometry. Appl. Environ. Microbiol. 70 (3):1506–13. doi:10.1128/AEM.70.3.1506-1513.2004.
- Burba, G. 2013. Eddy covariance method for scientific, industrial, agricultural, and regulatory applications: A field book on measuring ecosystem gas exchange and areal emission rates. Lincoln: LI-COR Biosciences.
- Burkett, M. W., R. A. Martin, D. L. Fenton, and M. V. Gunaji. 1984. Fire simulation in nuclear facilities – the FIRAC code and supporting experiment. Paper presented at the 18th DOE Nuclear Airborne Waste Management and Air Cleaning Conference, Baltimore, MD.
- Campanella, H., A. Uranga, A. Romano-Rodríguez, J. Montserrat, G. Abadal, N. Barniol, and J. Esteve. 2008. Localized-mass detection based on thin-film bulk acoustic wave resonators (FBAR): Area and mass location aspects. Sens. Actuators, A 142 (1):322–8. doi:10.1016/j.sna.2007.05.004.
- Campanella, H., J. Esteve, J. Montserrat, A. Uranga, G. Abadal, N. Barniol, and A. Romano-Rodríguez. 2006. Localized and distributed mass detectors with high sensitivity based on thin-film bulk acoustic resonators. Appl. Phys. Lett. 89 (3):033507. doi:10.1063/1.2234305.
- Chate, D. M., and T. S. Pranesha. 2004. Field studies of scavenging of aerosols by rain events. J. Aerosol Sci. 35 (6):695–706. doi:10.1016/j.jaerosci.2003.09.007.
- Chen, D.-R., and D. Y. H. Pui. 1995. Numerical and experimental studies of particle deposition in a tube with a conical contraction—Laminar flow regime. J. Aerosol Sci. 26 (4):563–74. doi:10.1016/0021-8502(94)00127-K.
- Cohen Hubal, E. A., J. C. Suggs, M. G. Nishioka, and W. A. Ivancic. 2005. Characterizing residue transfer efficiencies using a fluorescent imaging technique. J. Expo. Anal. Environ. Epidemiol. 15 (3):261–70. doi:10.1038/sj.jea.7500400.
- Da, G., E. Géhin, M. Ben Othmane, M. Havet, C. Solliec, and C. Motzkus. 2015. An experimental approach to measure particle deposition in large circular ventilation ducts. Environ. Sci. Pollut. Res. Int. 22 (7):4873–80. doi:10.1007/s11356-014-2859-y.
- Darquenne, C. 2012. Aerosol deposition in health and disease. J. Aerosol Med. Pulm. Drug Deliv. 25 (3):140–7. doi:10.1089/jamp.2011.0916.
- Darwish, Z. A., H. A. Kazem, K. Sopian, M. A. Al-Goul, and H. Alawadhi. 2015. Effect of dust pollutant type on photovoltaic performance. Renewable Sustainable Energy Rev. 41:735–44. doi:10.1016/j.rser.2014.08.068.
- Davila, A. P., J. Jang, A. K. Gupta, T. Walter, A. Aronson, and R. Bashir. 2007. Microresonator mass sensors for detection of Bacillus anthracis Sterne spores in air and water. Biosens. Bioelectron. 22 (12):3028–35. doi:10.1016/j.bios.2007.01.012.
- Ding, H., Y. Zhang, H. Sun, and L. Feng. 2016. Analysis of PM2.5 distribution and transfer characteristics in a car cabin. Energy Build. 127:252–8. doi:10.1016/j.enbuild.2016.06.004.
- Dohn, S., W. Svendsen, A. Boisen, and O. Hansen. 2007. Mass and position determination of attached particles on cantilever based mass sensors. Rev. Sci. Instrum. 78 (10):103303 doi:10.1063/1.2804074.
- Duan, M., L. Liu, G. Da, E. Géhin, P. V. Nielsen, U. M. Weinreich, B. Lin, Y. Wang, T. Zhang, and W. Sun. 2020. Measuring the administered dose of particles on the facial mucosa of a realistic human model. Indoor Air. 30 (1):108–16. doi:10.1111/ina.12612.
- El-Shobokshy, M. S., and F. M. Hussein. 1993. Effect of dust with different physical properties on the performance of photovoltaic cells. Sol. Energy 51 (6):505–11. doi:10.1016/0038-092X(93)90135-B.
- Falcon-Rodriguez, C. I., A. R. Osornio-Vargas, I. Sada-Ovalle, and P. Segura-Medina. 2016. Aeroparticles, composition, and lung diseases. Front. Immunol. 7:3. doi:10.3389/fimmu.2016.00003.
- Farrance, K., and J. Wilkinson. 1990. Dusting down suspended particles. Build. Serv. 12 (12):45–6.
- Feulner, M., G. Hagen, A. Müller, A. Schott, C. Zöllner, D. Brüggemann, and R. Moos. 2015. Conductometric sensor for soot mass flow detection in exhausts of internal combustion engines. Sensors (Basel) 15 (11):28796–806. doi:10.3390/s151128796.
- Frei, M., and F. E. Kruis. 2020. Image-based size analysis of agglomerated and partially sintered particles via convolutional neural networks. Powder Technol. 360:324–36. doi:10.1016/j.powtec.2019.10.020.
- Garland, J. A., and L. C. Cox. 1982. Deposition of small particles to grass. Atmospheric Environment (1967) 16 (11):2699–702. doi:10.1016/0004-6981(82)90352-3.
- Gong, L., B. Xu, and Y. Zhu. 2009. Ultrafine particles deposition inside passenger vehicles. Aerosol Sci. Technol. 43 (6):544–53. doi:10.1080/02786820902791901.
- Grondin, D., A. Westermann, P. Breuil, J. P. Viricelle, and P. Vernoux. 2016. Influence of key parameters on the response of a resistive soot sensor. Sens. Actuators, B 236:1036–43. doi:10.1016/j.snb.2016.05.049.
- Gupta, A., D. Akin, and R. Bashir. 2004. Single virus particle mass detection using microresonators with nanoscale thickness. Appl. Phys. Lett. 84 (11):1976–8. doi:10.1063/1.1667011.
- Hagen, G., A. Müller, M. Feulner, A. Schott, C. Zöllner, D. Brüggemann, and R. Moos. 2014. Determination of the soot mass by conductometric soot sensors. Proc. Eng. 87:244–7. doi:10.1016/j.proeng.2014.11.646.
- Hagen, G., C. Spannbauer, M. Feulner, J. Kita, A. Müller, and R. Moos. 2018. Conductometric soot sensors: Internally caused thermophoresis as an important undesired side effect. Sensors 18 (10):3531. doi:10.3390/s18103531.
- Hagen, G., M. Feulner, R. Werner, M. Schubert, A. Müller, G. Rieß, D. Brüggemann, and R. Moos. 2016. Capacitive soot sensor for diesel exhausts. Sens. Actuators, B 236:1020–7. doi:10.1016/j.snb.2016.05.006.
- Hajjam, A., J. C. Wilson, and S. Pourkamali. 2011. Individual air-borne particle mass measurement using high-frequency micromechanical resonators. IEEE Sensors J. 11 (11):2883–90. doi:10.1109/JSEN.2011.2147301.
- Hao, W.-C., J.-L. Liu, M.-H. Liu, and S.-T. He. 2014. Development of a new surface acoustic wave based PM2.5 monitor. Paper presented at the 2014 Symposium on Piezoelectricity,Acoustic Waves, and Device Applications (SPAWDA), IEEE, Beijing, China. doi:10.1109/SPAWDA.2014.6998524.
- Herranz, L. E., J. Ball, A. Auvinen, D. Bottomley, A. Dehbi, C. Housiadas, P. Piluso, V. Layly, F. Parozzi, and M. Reeks. 2010. Progress in understanding key aerosol issues. Prog. Nucl. Energy 52 (1):120–7. doi:10.1016/j.pnucene.2009.09.013.
- Heyder, J. 2004. Deposition of inhaled particles in the human respiratory tract and consequences for regional targeting in respiratory drug delivery. Proc. Am. Thorac. Soc. 1 (4):315–20. doi:10.1513/pats.200409-046TA.
- Holopainen, R., V. Asikainen, P. Pasanen, and O. Seppänen. 2002. The field comparison of three measuring techniques for evaluation of the surface dust level in ventilation ducts: Evaluation of the surface dust level in ventilation ducts. Indoor Air 12 (1):47–54. doi:10.1034/j.1600-0668.2002.120106.x.
- Hoppel, W. A. 2002. Surface source function for sea-salt aerosol and aerosol dry deposition to the ocean surface. J. Geophys. Res. 107 (D19):AAC 7-1–17 doi:10.1029/2001JD002014.
- Hsu, S.-C., G. T. F. Wong, G.-C. Gong, F.-K. Shiah, Y.-T. Huang, S.-J. Kao, F. Tsai, S.-C. Candice Lung, F.-J. Lin, I.-I. Lin, et al. 2010. Sources, solubility, and dry deposition of aerosol trace elements over the East China Sea. Mar. Chem. 120 (1–4):116–27. doi:10.1016/j.marchem.2008.10.003.
- ISO 15767:2009. 2009. Workplace atmospheres — Controlling and characterizing uncertainty in weighing collected aerosols.
- Jiang, H., L. Lu, and K. Sun. 2011. Experimental investigation of the impact of airborne dust deposition on the performance of solar photovoltaic (PV) modules. Atmos. Environ. 45 (25):4299–304. doi:10.1016/j.atmosenv.2011.04.084.
- Jonas, R. F. W., and G. Lindenthal. 2000. Investigation of loss factors of aerosol particles in the sampling systems of a nuclear power plant. Nucl. Eng. Des. 201 (1):107–14. doi:10.1016/S0029-5493(00)00255-7.
- Kasavan, J., and R. W. Doherty. 2000. Use of fluorescein in aerosol studies. No. ADA384058. U.S. Army Edgewood Chemical Biological Center.
- Kazem, H. A., M. T. Chaichan, A. H. A. Al-Waeli, and K. Sopian. 2020. A review of dust accumulation and cleaning methods for solar photovoltaic systems. J. Cleaner Prod. 276:123187. doi:10.1016/j.jclepro.2020.123187.
- Kindap, T., A. Unal, S.-H. Chen, Y. Hu, M. T. Odman, and M. Karaca. 2006. Long-range aerosol transport from Europe to Istanbul, Turkey. Atmos. Environ. 40 (19):3536–47. doi:10.1016/j.atmosenv.2006.01.055.
- Kondo, Y., L. Sahu, N. Moteki, F. Khan, N. Takegawa, X. Liu, M. Koike, and T. Miyakawa. 2011. Consistency and traceability of black carbon measurements made by laser-induced incandescence, thermal-optical transmittance, and filter-based photo-absorption techniques. Aerosol Sci. Technol. 45 (2):295–312. doi:10.1080/02786826.2010.533215.
- Kondo, Y., N. Takegawa, H. Matsui, T. Miyakawa, M. Koike, Y. Miyazaki, Y. Kanaya, M. Mochida, M. Kuwata, Y. Morino, et al. 2010. Formation and transport of aerosols in Tokyo in relation to their physical and chemical properties: A review. Journal of the Meteorological Society of Japan 88 (4):597–624. doi:10.2151/jmsj.2010-401.
- Kort, A., F.-X. Ouf, T. Gelain, J. Malet, R. Lakhmi, P. Breuil, and J.-P. Viricelle. 2021. Quantification of soot deposit on a resistive sensor: Proposal of an experimental calibration protocol. J. Aerosol Sci. 156:105783. doi:10.1016/j.jaerosci.2021.105783.
- Kort, A., F.-X. Ouf, T. Gelain, J. Malet, R. Lakhmi, P. Breuil, and J.-P. Viricelle. 2019. A resistive soot sensor for mass quantification through a correlation between conductance and soot mass loading. Paper pesented at the EAC 2019, Gothenburg, Sweden.
- Lai, A. C. K. 2002. Particle deposition indoors: A review. Indoor Air. 12 (4):211–4. doi:10.1046/j.0905-6947.2002.1r159a.x.
- Lai, A. C. K., and W. W. Nazaroff. 2005. Supermicron particle deposition from turbulent chamber flow onto smooth and rough vertical surfaces. Atmos. Environ. 39 (27):4893–900. doi:10.1016/j.atmosenv.2005.04.036.
- Lai, A. C. K., M. A. Byrne, and A. J. H. Goddard. 2002. Experimental studies of the effect of rough surfaces and air speed on aerosol deposition in a test chamber. Aerosol Sci. Technol. 36 (10):973–82. doi:10.1080/02786820290092249.
- Lai, A. C. K., Y. Tian, J. Y. L. Tsoi, and A. R. Ferro. 2017. Experimental study of the effect of shoes on particle resuspension from indoor flooring materials. Build. Environ. 118:251–8. doi:10.1016/j.buildenv.2017.02.024.
- Laiman, R., C. He, M. Mazaheri, S. Clifford, F. Salimi, L. R. Crilley, M. A. Megat Mokhtar, and L. Morawska. 2014. Characteristics of ultrafine particle sources and deposition rates in primary school classrooms. Atmos. Environ. 94:28–35. doi:10.1016/j.atmosenv.2014.05.013.
- Landis, G. A., P. Jenkins, J. Flatico, L. Oberle, M. Krasowski, and S. Stevenson. 1996. Development of a Mars dust characterization instrument. Planet. Space Sci. 44 (11):1425–33. doi:10.1016/S0032-0633(96)00042-6.
- Lavoie, J., G. Marchand, Y. Cloutier, and J. Lavoué. 2011. Validation of the criteria for initiating the cleaning of heating, ventilation, and air-conditioning (HVAC) ductwork under real conditions. J. Occup. Environ. Hyg. 8 (8):467–72. doi:10.1080/15459624.2011.590740.
- Lavoie, J., G. Marchand, Y. Cloutier, Y. Beaudet, and J. Lavoué. 2010. Studies and research projects: Validation of system cleaning initiation criteria under real conditions. Report. IRSST, Communication Division, Montréal.
- Lavoie, J., R. Gravel, Y. Cloutier, and A. Bahloul. 2007. Critères de déclenchement du nettoyage des systèmes de chauffage, de ventilation et de conditionnement d’air d’édifices non industriels. Études et recherches No. R-525, Substances chimiques et agents biologiques. Institut de recherche Robert-Sauvé en santé et en sécurité du travail (IRSST), Montréal.
- Licina, D., and W. W. Nazaroff. 2018. Clothing as a transport vector for airborne particles: Chamber study. Indoor Air. 28 (3):404–14. doi:10.1111/ina.12452.
- Lieberman, A., and J. Rosinski. 1962. Behavior of an aerosol cloud in a plastic chamber. J. Colloid Sci. 17 (9):814–22. doi:10.1016/0095-8522(62)90061-2.
- Litvak, A., A. J. Gadgil, and W. J. Fisk. 2000. Hygroscopic fine mode particle deposition on electronic circuits and resulting degradation of circuit performance: an experimental study: Hygroscopic fine mode particle deposition on electronic circuits and resulting degradation of circuit performance. Indoor Air. 10 (1):47–56. doi:10.1034/j.1600-0668.2000.010001047.x.
- Liu, B., X. Chen, H. Cai, M. Mohammad Ali, X. Tian, L. Tao, Y. Yang, and T. Ren. 2016. Surface acoustic wave devices for sensor applications. J. Semicond. 37 (2):021001. doi:10.1088/1674-4926/37/2/021001.
- Mani, M., and R. Pillai. 2010. Impact of dust on solar photovoltaic (PV) performance: Research status, challenges and recommendations. Renewable Sustainable Energy Rev. 14 (9):3124–31. doi:10.1016/j.rser.2010.07.065.
- Maro, D., O. Connan, J. P. Flori, D. Hébert, P. Mestayer, F. Olive, J. M. Rosant, M. Rozet, J. F. Sini, and L. Solier. 2014. Aerosol dry deposition in the urban environment: Assessment of deposition velocity on building facades. J. Aerosol Sci. 69:113–31. doi:10.1016/j.jaerosci.2013.12.001.
- Matsuda, K., Y. Fujimura, K. Hayashi, A. Takahashi, and K. Nakaya. 2010. Deposition velocity of PM2.5 sulfate in the summer above a deciduous forest in central Japan. Atmos. Environ. 44 (36):4582–7. doi:10.1016/j.atmosenv.2010.08.015.
- McCready, D. I. 1986. Wind tunnel modeling of small particle deposition. Aerosol Sci. Technol. 5 (3):301–12. doi:10.1080/02786828608959095.
- McFarland, A. R., H. Gong, A. Muyshondt, W. B. Wente, and N. K. Anand. 1997. Aerosol deposition in bends with turbulent flow. Environ. Sci. Technol. 31 (12):3371–7. doi:10.1021/es960975c.
- Menant, N. 2016. Etude des mécanismes de contamination particulaire et des moyens de détection: Proposition et evaluation de solutions innovantes pour la détection en temps-réel de la sédimentation des particules sur les surfaces critiques. PhD diss., Université de Montpellier.
- Menant, N., D. Faye, F. Bourcier, P. Nouet, L. Latorre, X. Lafontan, and D. Lellouchi. 2015. New development for particle deposition monitoring during space instrument integration in cleanroom. Paper presented at the ISMSE 2015, Pau.
- Miller, S. L., W. W. Nazaroff, J. L. Jimenez, A. Boerstra, G. Buonanno, S. J. Dancer, J. Kurnitski, L. C. Marr, L. Morawska, and C. Noakes. 2021. Transmission of SARS‐CoV‐2 by inhalation of respiratory aerosol in the Skagit Valley Chorale superspreading event. Indoor Air 31 (2):314–23. doi:10.1111/ina.12751.
- Morales-Baquero, R., and C. Pérez-Martínez. 2016. Saharan versus local influence on atmospheric aerosol deposition in the southern Iberian Peninsula: Significance for N and P inputs: Saharan Versus Local Aerosol Deposition. Global Biogeochem. Cycles 30 (3):501–13. doi:10.1002/2015GB005254.
- Mosley, R. B., D. J. Greenwell, L. E. Sparks, Z. Guo, W. G. Tucker, R. Fortmann, and C. Whitfield. 2001. Penetration of ambient fine particles into the indoor environment. Aerosol Sci. Technol. 34 (1):127–36. doi:10.1080/02786820117449.
- Newman, S. P., J. E. Agnew, D. Pavia, and S. W. Clarke. 1982. Inhaled aerosols: Lung deposition and clinical applications. Clin. Phys. Physiol. Meas. 3 (1):1–20. doi:10.1088/0143-0815/3/1/001.
- Nugaeva, N., K. Y. Gfeller, N. Backmann, M. Düggelin, H. P. Lang, H.-J. Güntherodt, and M. Hegner. 2007. An antibody-sensitized microfabricated cantilever for the growth detection of Aspergillus niger spores. Microsc. Microanal. 13 (1):13–7. doi:10.1017/S1431927607070067.
- Nygren, O. 2006. Wipe sampling as a tool for monitoring aerosol deposition in workplaces. J. Environ. Monit. 8 (1):49–52. doi:10.1039/B511509B.
- Okazaki, K., and K. Willeke. 1987. Transmission and deposition behavior of aerosols in sampling inlets. Aerosol Sci. Technol. 7 (3):275–83. doi:10.1080/02786828708959164.
- Paprotny, I., F. Doering, P. A. Solomon, R. M. White, and L. A. Gundel. 2013. Microfabricated air-microfluidic sensor for personal monitoring of airborne particulate matter: Design, fabrication, and experimental results. Sens. Actuators, A. 201:506–16. doi:10.1016/j.sna.2012.12.026.
- Park, K., N. Kim, D. T. Morisette, N. R. Aluru, and R. Bashir. 2012. Resonant MEMS mass sensors for measurement of microdroplet evaporation. J. Microelectromech. Syst. 21 (3):702–11. doi:10.1109/JMEMS.2012.2189359.
- Peillon, S., G. Dougniaux, M. Payet, E. Bernard, G. Pieters, S. Feuillastre, S. Garcia-Argote, F. Gensdarmes, C. Arnas, F. Miserque, et al. 2020. Dust sampling in WEST and tritium retention in tokamak-relevant tungsten particles. Nuclear Materials and Energy 24:100781. doi:10.1016/j.nme.2020.100781.
- Petroff, A., A. Mailliat, M. Amielh, and F. Anselmet. 2008. Aerosol dry deposition on vegetative canopies. Part I: Review of present knowledge. Atmos. Environ. 42 (16):3625–53. doi:10.1016/j.atmosenv.2007.09.043.
- Phillips, S. 2004. Ammonia flux and dry deposition velocity from near-surface concentration gradient measurements over a grass surface in North Carolina. Atmos. Environ. 38 (21):3469–80. doi:10.1016/j.atmosenv.2004.02.054.
- Prévost, C. 1997. Etude d’un dispositif de comptage en continu d’un aérosol fluorescent. Master. thesis., No. CEA-R-5763). CEA.
- Pui, D. Y. H., F. Romay-Novas, and B. Y. H. Liu. 1987. Experimental study of particle deposition in bends of circular cross section. Aerosol Sci. Technol. 7 (3):301–15. doi:10.1080/02786828708959166.
- Reche, I., G. D’Orta, N. Mladenov, D. M. Winget, and C. A. Suttle. 2018. Deposition rates of viruses and bacteria above the atmospheric boundary layer. Isme J. 12 (4):1154–62. doi:10.1038/s41396-017-0042-4.
- Reynaud, A., M. Leblanc, S. Zinola, P. Breuil, and J.-P. Viricelle. 2019. Responses of a resistive soot sensor to different mono-disperse soot aerosols. Sensors 19 (3):705. doi:10.3390/s19030705.
- Roed, J. 1985. Dry deposition on urban surfaces. No. 87-550-1069–5. Risø National Laboratory, Denmark.
- Rondeau, A. 2015. Study of the aeraulic particle resuspension applied to the dust issue in the future ITER tokamak. PhD diss., Université Paris-Saclay.
- Roupsard, P. 2013. Etude phénoménologique du dépôt sec d’aérosols en milieu urbain: Influence des propriétés des surfaces, de la turbulence et des conditions météorologiques. PhD diss., INSA de Rouen.
- Roupsard, P., M. Amielh, D. Maro, A. Coppalle, H. Branger, O. Connan, P. Laguionie, D. Hébert, and M. Talbaut. 2013. Measurement in a wind tunnel of dry deposition velocities of submicron aerosol with associated turbulence onto rough and smooth urban surfaces. J. Aerosol Sci. 55:12–24. doi:10.1016/j.jaerosci.2012.07.006.
- SAC. 2018. PDM. Accessed July 28, 2020. http://particle-deposition.com/.
- Saidan, M., A. G. Albaali, E. Alasis, and J. K. Kaldellis. 2016. Experimental study on the effect of dust deposition on solar photovoltaic panels in desert environment. Renewable Energy 92:499–505. doi:10.1016/j.renene.2016.02.031.
- Sato, S., D.-R. Chen, and D. Y. H. Pui. 2002. Particle transport at low pressure: Particle deposition in a tube with an abrupt contraction. J. Aerosol Sci. 33 (4):659–71. doi:10.1016/S0021-8502(01)00198-7.
- Schlesinger, R. B. 1985. Comparative deposition of inhaled aerosols in experimental animals and humans: A review. J. Toxicol. Environ. Health 15 (2):197–214. doi:10.1080/15287398509530647.
- Schmid, S., M. Kurek, J. Q. Adolphsen, and A. Boisen. 2013. Real-time single airborne nanoparticle detection with nanomechanical resonant filter-fiber. Sci. Rep. 3 (1):1288 doi:10.1038/srep01288.
- Schneider, T., O. H. Petersen, J. Kildeso, N. P. Kloch, and T. Lobner. 1996. Design and calibration of a simple instrument for measuring dust on surfaces in the indoor environment. Indoor Air 6 (3):204–10. doi:10.1111/j.1600-0668.1996.t01-1-00007.x.
- Shaughnessy, R., and H. Vu. 2012. Particle loadings and resuspension related to floor coverings in chamber and in occupied school environments. Atmos. Environ. 55:515–24. doi:10.1016/j.atmosenv.2012.04.008.
- Sippola, M. R., and W. W. Nazaroff. 2004. Experiments measuring particle deposition from fully developed turbulent flow in ventilation ducts. Aerosol Sci. Technol. 38 (9):914–25. doi:10.1080/027868290507213.
- Slinn, S. A., and W. G. N. Slinn. 1980. Predictions for particle deposition on natural waters. Atmospheric Environment (1967) 14 (9):1013–6. doi:10.1016/0004-6981(80)90032-3.
- Smolík, J., M. Lazaridis, P. Moravec, J. Schwarz, S. K. Zaripov, and V. Ždímal. 2005. Indoor Aerosol Particle Deposition in an Empty Office. Water. Air. Soil Pollut. 165 (1–4):301–12. doi:10.1007/s11270-005-7146-6.
- Sow, M., Y. Leblois, and F. Gensdarmes. 2019. Experimental study of aerosol release following liquid leaks of fission products concentrates simulants. Nucl. Eng. Des. 341:46–55. doi:10.1016/j.nucengdes.2018.09.034.
- Soysal, U., E. Géhin, E. Algré, B. Berthelot, G. Da, and E. Robine. 2017. Aerosol mass concentration measurements: Recent advancements of real-time nano/micro systems. J. Aerosol Sci. 114:42–54. doi:10.1016/j.jaerosci.2017.09.008.
- Stenger, J. B., and R. A. Bajura. 1982. Deposition in sampling tubes. Technical Report No. DOE/MC/11284-T12). Department of Mechanical and Aerospace Engineering, West Virginia University, Morgantown, WV.
- Taheri, A., A. B. Khoshnevis, and E. Lakzian. 2020. The effects of wall curvature and adverse pressure gradient on air ducts in HVAC systems using turbulent entropy generation analysis. Int. J. Refrig. 113:21–30. doi:10.1016/j.ijrefrig.2020.01.014.
- Technology of Sense. 2018. APMON. Accessed July 28, 2020. https://www.technologyofsense.com/products/apmon/.
- Thatcher, T. L., A. C. K. Lai, R. Moreno-Jackson, R. G. Sextro, and W. W. Nazaroff. 2002. Effects of room furnishings and air speed on particle deposition rates indoors. Atmos. Environ. 36 (11):1811–9. doi:10.1016/S1352-2310(02)00157-7.
- Thomas, S., M. Cole, F. H. Villa-López, and J. W. Gardner. 2016. High frequency surface acoustic wave resonator-based sensor for particulate matter detection. Sens. Actuators, A 244:138–45. doi:10.1016/j.sna.2016.04.003.
- Tovena Pecault, I., P. Godefroy, and L. Escoubas. 2017. Qualification testing of an innovative system for monitoring particle contamination fallout. Sens. Actuators, A. 253:181–7. doi:10.1016/j.sna.2016.12.002.
- Uematsu, M., R. A. Duce, J. M. Prospero, L. Chen, J. T. Merrill, and R. L. McDonald. 1983. Transport of mineral aerosol from Asia over the North Pacific Ocean. J. Geophys. Res. 88 (C9):5343–52. doi:10.1029/JC088iC09p05343.
- Vette, A. F., A. W. Rea, P. A. Lawless, C. E. Rodes, G. Evans, V. R. Highsmith, and L. Sheldon. 2001. Characterization of Indoor-Outdoor Aerosol Concentration Relationships during the Fresno PM Exposure Studies. Aerosol Sci. Technol. 34 (1):118–26. doi:10.1080/02786820117903.
- Volken, M., and T. Schumann. 1993. A Critical review of below-cloud aerosol scavenging results on Mt. Rigi. Water. Air. Soil Pollut. 68 (1–2):15–28. doi:10.1007/BF00479390.
- Wagner, J., and D. Leith. 2001. Passive aerosol sampler. Part II: Wind tunnel experiments. Aerosol Sci. Technol. 34 (2):193–201. doi:10.1080/027868201300034826.
- Wasisto, H. S., S. Merzsch, A. Stranz, A. Waag, E. Uhde, T. Salthammer, and E. Peiner. 2013. Silicon resonant nanopillar sensors for airborne titanium dioxide engineered nanoparticle mass detection. Sens. Actuators, B 189:146–56. doi:10.1016/j.snb.2013.02.053.
- Whyte, W., and T. Eaton. 2016. Deposition velocities of airborne microbe- carrying particles. Eur. J. Parenteral Pharm. Sci. 21 (2):45–9.
- Wilson, W. E., J. C. Chow, C. Claiborn, W. Fusheng, J. Engelbrecht, and J. G. Watson. 2002. Monitoring of particulate matter outdoors. Chemosphere 49 (9):1009–43. doi:10.1016/S0045-6535(02)00270-9.
- Wu, Y.-L., C. I. Davidson, and A. G. Russell. 1992. Controlled wind tunnel experiments for particle bounceoff and resuspension. Aerosol Sci. Technol. 17 (4):245–62. doi:10.1080/02786829208959574.
- Wu, Z., and J. B. Young. 2012. The deposition of small particles from a turbulent air flow in a curved duct. Int. J. Multiphase Flow 44:34–47. doi:10.1016/j.ijmultiphaseflow.2012.03.011.
- XCAM. 2016. PFO 1000 MONITOR. Accessed July 28, 2020. http://www.xcam.co.uk/pfo-1000-particle-fall-out-monitor.
- Xu, M., M. Nematollahi, R. G. Sextro, A. J. Gadgil, and W. W. Nazaroff. 1994. Deposition of tobacco smoke particles in a low ventilation room. Aerosol Sci. Technol. 20 (2):194–206. doi:10.1080/02786829408959676.
- Yang, Y. T., C. Callegari, X. L. Feng, K. L. Ekinci, and M. L. Roukes. 2006. Zeptogram-scale nanomechanical mass sensing. Nano Lett. 6 (4):583–6. doi:10.1021/nl052134m.
- Zielinski, A. T., M. Kalberer, R. L. Jones, A. Prasad, and A. A. Seshia. 2016. Particulate mass sensing with piezoelectric bulk acoustic mode resonators. Paper presented at the 2016 IEEE International Frequency Control Symposium (IFCS), IEEE, New Orleans, LA. doi:10.1109/FCS.2016.7563576.
- Zuraimi, M. S. 2010. Is ventilation duct cleaning useful? A review of the scientific evidence: Ventilation duct cleaning review. Indoor Air. 20 (6):445–57. doi:10.1111/j.1600-0668.2010.00672.x.