
 ?Mathematical formulae have been encoded as MathML and are displayed in this HTML version using MathJax in order to improve their display. Uncheck the box to turn MathJax off. This feature requires Javascript. Click on a formula to zoom.
Abstract
The Eulerian–Lagrangian computational approach is employed for the particles motion simulation within the cyclone separator. The 3 D Reynolds-averaged Navier–Stokes equations are utilized to calculate the flow field. CFD simulations are verified first with the available numerical and experimental data in the literature, then they are verified with the particle-laden flow experimental measurements carried out in a cyclone separator. The Reynolds Averaged Navier-Stokes equations (RANS) implying the realized k–ε turbulence model is used in the simulation of the gas phase, whereas the simulation of the particulate phase is performed utilizing 3-D particle tracking technique. The numerical model accounts for particle sphericity by applying three separate equations for the drag coefficient. The tangential velocity in the cyclone is obtained numerically for different particle sizes, sphericity and particle mass loadings. Verification of the numerical findings is performed by means of experiments, in which, the tangential velocity is measured using a five-hole probe. The experimental measurements show a considerable agreement with the available numerical data simulating particle laden flow for non-spherical particles in a cyclone.
Copyright © 2021 American Association for Aerosol Research
EDITOR:
1. Introduction
Cyclones are probably the most common devices utilized for dust collection. They are relatively inexpensive and simple in design, operate with accepted losses in pressure, and an extended, trouble free service is expected if they were used properly.
There are many layouts for the cyclone, the one comprising of a cone-under-cylinder with tangential gas inlet will be focused on, , based on Cortes and Gil (2017), since this is often the type mostly used for gas cleaning in industry. In this design, the particulate phase is radially accelerated as a result of inducing a spiral rotation to the carrier phase, either gas or liquid. There are two outlets for the cyclone, one is located at the bottom of the cyclone, namely, the underflow outlet, and the other one is an inner tube that descends from the top as an overflow outlet, known as the vortex finder. The forced vortex region is pronounced for the cyclone central zone flow whereas the flow close to the cyclone walls is considered as the region of the free vortex. This gives the features of Rankine vortex to the cyclone swirling turbulent flow, which is important for the separation of the particles. A strong centrifugal force is produced by the central swirl in the cyclone which enables the gas phase to carry the particles due to the effect of viscous drag. On the contrary, the centrifugal force produced near the wall due to free vortex is relatively weaker and hence, not sufficient for the particles to be carried by the gas phase. The high inertia of the larger particles inhibits them from being carried with the gas. This is why they slip downward on the surface of the walls and will be finally separated.
Figure 1. The principle of operation and flow patterns in a cyclone.
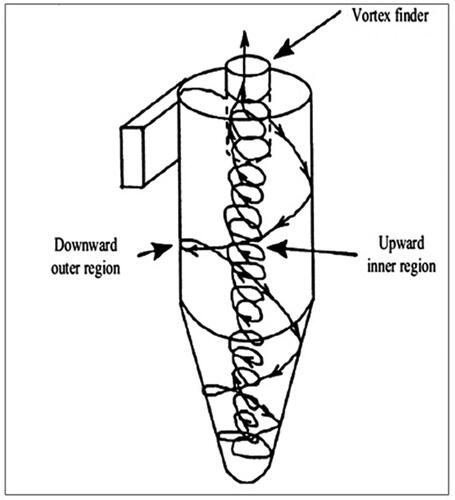
The solid particles always have a higher density than that of the carrier phase. When the cleaned gas reaches the central core, it moves up toward the gas exit duct of the cyclone. Dust particles take another way to the dust exit along the cyclone walls due to the downward movement of gas, this is why gravity plays an important role in vertical cyclones.
In evaluating cyclone performance, two parameters must be considered, namely the separation efficiency and the pressure drop. The separation efficiency of the cyclone is given by the ratio between the mass of the collected solids and the corresponding mass flow of inlet solids for a certain period of time. Cyclone pressure drop is defined as the difference between the cyclone inlet static pressure and the corresponding pressure the finder outlet.
Tangential velocity is considered as the crucial gas flow parameter in the cyclones since it is responsible for the centrifugal force required for particle separation. The importance of the tangential velocity comes, as well, from its effects on both the cyclone collection efficiency as well as the pressure drop. In the inner region, as the tangential velocity increases, the centrifugal force will increase resulting in a higher cyclone collection efficiency, Chu et al. (Citation2011). The total pressure inside the cyclone will be the static pressure plus the kinetic energy of the vortex, The pressure losses in cyclones are dominated by the viscous dissipation of the quantity
in the vortex finder. Such a dissipation is roughly proportional to the absolute magnitude of
in other words, any influence that tends to increase the strength of the vortex results in increasing the losses and vice versa, El Ashry, Abdelrazek, and Elshorbagy (Citation2018).
Having these substantial effects on the pressure drop and separation efficiency in cyclones, tangential velocity can be considered as a main economic parameter in cyclones in industry, since the pressure drop if increased, will increase energy loss. The same with separation efficiency, if decreased, that means more losses. Therefore, the current study aims to focus on the distribution of tangential velocity in cyclones.
Computational fluid dynamics (CFD) can, to a great extent, replace the traditional models used for the time-averaged flow, c.f. Elshorbagy (Citation1980). Numerical techniques are utilized to guarantee optimum design and accounts for operating conditions as well as the. Turbulence models, namely, the realizable are used in the simulation of highly anisotropic turbulent field for unsteady swirling flow in cyclone separators.
The effects of the various parameters on the cyclone’s performance were studied by many researchers (Chhabra, Agarwal, and Sinha Citation1999; Lim et al. Citation2020). Xiang and Lee (Citation2008) showed that if the vortex finder diameter is reduced, then the tangential velocity increases as a result, which in turns, increases particle separation efficiency. On the contrary, if the vortex finder diameter is increased, the pressure drop decreases as a consequence. The flow inside a cyclone was numerically analyzed by Kepa (Citation2010) with an additional internal tube located inside the cyclone vortex finder as an inner vortex finder. The effects of inserting a stick in a cyclone, the effects of various cyclone body designs such as the vertical groove body, the conventional smooth surface body, and the spiral guide body were studied by Wang, Wang, and Liu (Citation2005), Farahani et al. (Citation2011) and Kim, Lee, and Kuhlman (Citation2001).
Zhu et al. (Citation2001), Xiang and Lee (Citation2001) and Lim, Kim, and Lee (Citation2004) proposed and investigated the double cyclone design, and concluded a decrease in the pressure drop when compared with the high efficiency Stairmand cyclone.
Regarding the dynamic effects of particle shape, Chhabra, Agarwal, and Sinha (Citation1999) used correlations to estimate the drag coefficient of non-spherical particles for the cases of incompressible viscous fluids. A model was derived by Rosendahl et al. (Citation2003) to track non-spherical particles for a wide range of flow velocities and includes both translation and rotation aspects. The drag of non-spherical particles was investigated by Loth (Citation2008) for regular and irregular particle shapes as well as variable particle Reynolds numbers (Rep). Mando and Rosendahl (2010) reviewed the available approaches for tracking non-spherical particles. The Eulerian–Lagrangian scheme was used for the modeling of the particle motion for highly turbulent dispersed flows. Different shapes of particles were classified and a universal shape parameter was found. The substantial secondary motion associated with nonspherical particles were also clarified. Extra inlets were mounted on the conical section of a tangential cyclone separator's by Lim et al. (Citation2020). By comparing the performance of the developed cyclone with that of a typical reference cyclone, it was found that more flow rates could be achieved by the developed cyclone.
The effect of particle shape, size, and mass loading on cyclone pressure drop was thoroughly investigated by El Ashry, Abdelrazek, and Elshorbagy (Citation2018).
In the present work, the tangential velocity was simulated numerically for the case of particle-laden flow in a cyclone separator and experimental verification was then carried out for the results. The tangential velocity is a significant parameter that affects cyclone performance. Numerical simulation for the gas phase was done by employing the standard k–ε and the realizable k–ε turbulence models. The model is based on Reynolds Averaged Navier–Stokes equations (RANS). 3-D particle tracking technique was utilized to model the solid phase. Lift and drag forces are included in the model. The model also accounts for the dispersion of particles by effect of turbulence, particle rotation effect, and particle sphericity. The drag force for the non-spherical particles is modeled by applying three different equations for the drag coefficient that account for particle shape. The experimental work, including the measurements of tangential velocity, was performed using a cyclone separator of the same dimensions as the one used for the numerical model to facilitate validation of numerical results. The parameters affecting cyclone performance such as the sphericity, the diameter and the mass loading of the particles were investigated.
2. Numerical modeling
2.1. Modeling the fluid flow in a cyclone
The Reynolds-averaged Navier–Stokes equations (RANS), for the steady and incompressible fluid flow in cyclones, Zhao, Su, and Zhang (Citation2006). can be written as
(1)
(1)
(2)
(2)
where the superscripts
represent the components in the Cartesian coordinate system
The Reynolds stress tensor is defined as,
(3)
(3)
Among the known turbulence models utilized in the flow simulation in a cyclone separator, the model (KEM) was selected for the numerical simulation. The following equations solve the turbulent kinetic energy k and the turbulent dissipation rate ɛ, respectively:
(4)
(4)
(5)
(5)
The constants can be assigned as: and
S. Shukla, Shukla, and Ghosh (Citation2011).
where is the Stress Production
is the Buoyancy Production
is the Turbulent Mach Number
2.2. Modeling the particle dynamics
Particle tracking technique is applied to simulate particulate flow in the cyclone. In this method, each particle is considered as an isolated particle. Particle separation efficiency is attained by tracing the routes of the solid particles inside the cyclone. Referring to the Eulerian–Lagrangian approach, Zhao, Su, and Zhang (Citation2006), the particle motion equation can be written as:
(6)
(6)
(7)
(7)
where, the term
represents the drag force per unit mass of particle:
The drag force is given by
(8)
(8)
and particle Reynolds number reads
(9)
(9)
The drag coefficient can be expressed according to Kasper (Citation1982), as:
(10)
(10)
(11)
(11)
2.2.1. Non-spherical particle modelling
Particles are normally supposed spherical in most of particle-laden flow simulations. In practice, most of the particles used in particulate flows in various industrial applications have non-spherical shape. Some features come to the spot when dealing with particles as non-spherical particles such as significant secondary motion, lift generated by shape, and orientation related lift as well as drag forces. That necessitates the improvement of the normal procedure for more precise representation of the mentioned phenomena. This includes clarification for the lift and drag force caused by particle orientation according to the shape of the particle, and tracking of the particle rotation and orientation. In order to estimate how much deviated the shape of the non-spherical particle from the spherical shape, two parameters are needed to be figured out, which are the equivalent diameter and sometimes, the shape factor. An equivalent diameter for a non-spherical particle can be defined in two ways, the first one is the volume equivalent diameter, expressed as “the diameter of a hypothetical sphere having the exact volume of the real particle”, while the second is the area equivalent diameter, known as “the diameter of a hypothetical sphere that has just the exact surface area of the real particle”.
There is only a single way to represent the irregularity of the particle shape, which is to define shape factors, which indeed, might be utilized with regularly shaped particles also, Loth (Citation2008). Of the known shape factors, sphericity, is the most famous one, it can be expressed as the ratio between the surface area of a hypothetical sphere having exactly the same volume of the real particle and the surface area of the particle.
Wadell (Citation1934) proposed that the degree of sphericity be defined as
(12)
(12)
where is the surface of a sphere having the same volume as the particle, and A is the actual surface area of the particle.
According to Haider and Levenspiel (Citation1989), the sphericity values for different shapes of non-spherical particles are: cube octahedrons, ( =0.906), octahedrons, (
= 0.846), cubes (
=0.806), tetrahedrons (
=0.67) and disks (
< 0.67).
2.2.1.1. Drag coefficient for non-spherical particles
The drag coefficient for spherical particles tumbling at their terminal velocities, is obtained in the literature by means of many equations, c.f. Haider (1989), Chien (Citation1994), and (Swamee, and Ojha Citation1991). Haider and Levenspiel (Citation1989) suggested using the following expression to calculate the drag coefficient for the case of incompressible flow, which was employed by Loth (Citation2008).
(13)
(13)
It is worth mentioning that the drag coefficient equation proposed by Haider and Levenspiel yielded poor predictions for disk shapes, Chhabra, Agarwal, and Sinha (Citation1999).
Similarly, the data in the literature obtained from the petroleum engineering and processing was treated by Chien (Citation1994), and the subsequent drag coefficient equation was suggested:
(14)
(14)
to be applied in the range 0.2 ≤
≤ 1 and Re < 5000
Swamee, and Ojha (Citation1991) suggested the following drag coefficient correlation, to be applied in the range 0.3 < β < 1 and 1< Re < 10,000
(15)
(15)
Where
(16)
(16)
And
are the lengths of the three principal axes of the particle.
2.2.1.2. Modeling approach
In the present work, modification was done for the module dedicated for the calculation of the drag force included in STAR-CCM+ 9.06.009 (2013). That was done by replacing the equation of drag coefficient in the main module by the above mentioned equations. The results were then compared with the corresponding results for spherical particles.
2.3. Solution algorithm
For the gas phase, pressure-velocity coupling is attained by reconfiguring the continuity equation in order to develop an extra pressure condition. The pressure-based solver solves the flow problem either in a coupled or a segregated approach. The coupled scheme for steady state flows displays higher performance than the segregated schemes. The Coupled Flow model uses a pseudo-time-marching methodology to solve the equations for mass, energy, and momentum conservation simultaneously. The continuous distribution discretization selected was second order upwind scheme.
For the discrete particle phase, the particle tracking methodology is applied. The Lagrangian approach is utilized for the calculation of the discrete phase trajectory. This approach includes the gravity force, hydrodynamic drag, and the inertia of the discrete phase for the cases of steady and unsteady flows. As soon as a particle touches either the bottom or the side wall of the cyclone, the computation is considered ended for this particle and the particle is then collected. If a particle collides with another cyclone wall, the computation resumes as soon as the particle rebounds from the wall. At the end, the particle either escapes from the cyclone top outlet or is gathered at the cyclone side wall.
2.4. Grid system
The cyclone geometry selected for the experiments is illustrated in . The selected cyclone design is similar to the Lapple geometry created by Wang et al. (Citation2006) except for reducing the size of the vortex finder to increase the separation efficiency as will be clarified. In connection with , the cyclone dimensions are collected in .
Figure 2. (a) Cyclone geometry. (b) Generated grid.
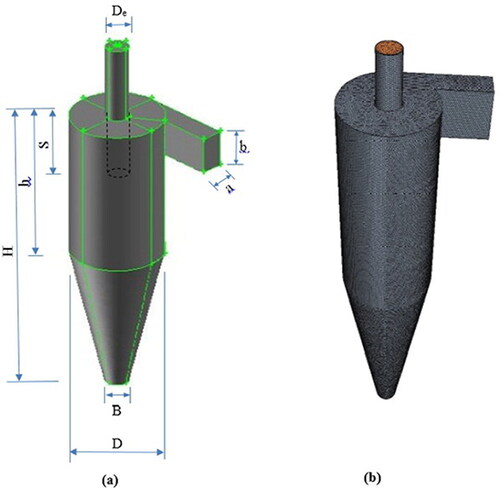
Table 1. Geometrical dimensions of the cyclone considered (D = 0.2 m).
The cyclone is meshed by polyhedral grids. A number of 225,152 grid cells was selected, in order to check mesh independence. The total grid number was increased to 364,164 cells by reducing cell size, then increased again to 460,578 cells and finally 676,482 cells. The results experienced almost no change when the number of cells exceeded 364,164 cells. Accordingly, the selected number of grid cells in the model was 364,164, .
Geometrical dimensions of the cyclone considered (D = 0.2 m)
2.5. Boundary and convergence conditions
2.5.1. Boundary condition at cyclone inlet
Dependent variables are distributed uniformly at cyclone inlet
(17)
(17)
2.5.2. Boundary condition at the outlet
Pressure outlet boundary condition is assumed at cyclone outlet, which is atmospheric pressure under this condition.
(18)
(18)
2.6. Convergence condition
In the present study, convergence is assumed when all residuals representing velocity components (), continuity equation, turbulence dissipation rate, and turbulence kinetic energy for the gas phase decrease to less than 1 × 10⁻⁶.
3. Experimental work
demonstrates the experimental setup. It comprises of a circular Perspex pipe of 0.066 m inner diameter and 3 m long. Next to the pipe, there exist a rectangular Perspex duct, 4 m long and 0.1 × 0.05 m cross section. The circular pipe is connected to the rectangular duct by means of a sectional adapter. The section dimensions and the circular pipe have the same hydraulic diameter. At 2 m distance from the beginning end of the pipe, a standard orifice meter is located. At the end of the rectangular duct, the inlet of the cyclone separator, made also of Perspex, is connected. The bottom end of the cyclone separator is connected via a flexible connector to a closed collecting drum. The vortex finder, which represents the upper terminal of the cyclone separator, discharges to the atmosphere. A screw feeder is responsible for supplying solid particles to the system. The solid particles are enclosed in a hopper connected to the beginning terminal of the screw feeder. A venturi contraction is placed in the circular pipe at 0.5 m distance from the orifice meter, the throat of which is connected to the end of the screw feeder. A variable speed motor is used to drive the screw feeder. The solids accumulated in the collecting drum at the bottom of the cyclone separator are weighed using a digital weighing scale placed underneath the solids accumulating drum.
Figure 3. Experimental test rig.
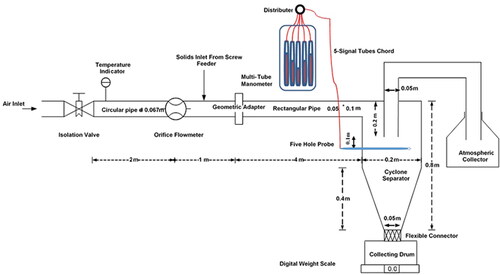
The measurements involved the discharge rate of air flow (Qa), the mass flow rate of solids (ms°) and the tangential velocity in the cyclone cylindrical section. A standard orifice plate, whose upstream and downstream ends are connected to a mercury u-tube manometer, is used to measure the air flow discharge. The ends of the manometer are connected to the upstream and the downstream of the orifice plate. A digital weight scale is placed under the solids collecting drum, and is used, together with a stop watch, to measure the mass flow rate of the solid particles. The solids mass flow rate is obtained by determining the period of time required for a certain mass of solids to be collected in the collecting drum. Measuring the tangential velocity in the cyclone is made using a five-hole probe which is placed tangentially facing the swirling flow in the cyclone. The five pressure signals of the five-hole probe are connected to the top ends a water multi-tube manometer. The tangential velocity is computed from the observed readings of the manometer. Air flows through a flow control valve to the circular pipe. A Flow velocity range from 10 to 20 m/s can be produced by the system.
4. Results and discussions
In this section, numerical data and experimental results for the cyclone tangential velocity for the case of Cement dispersed particles are investigated. The cement particles are separated from flowing air-solid suspension using cyclone separators on a wide range of applications in industry.
A polydispersed particle size distribution is considered in the current study, and the Rosin – Rammler diameter distribution is applied, STAR-CCM+ 9.06.009 (2013).
The Rosin–Rammler distribution function is based on the assumption that an exponential relationshipexists between the particle diameter, d, and the mass fraction of particles with diameter greater than d, Yd.
(19)
(19)
where
is the characteristic diameter and
is the distribution parameter, both are input to the model prior to numerical run.
In order to visualize the detailed shape and size of the Cement powder, a Jewel scanning electronic microscope, model GSM-5300 was utilized. Specifications and properties of the used Cement particles are summarized in . Particle shape and size are shown in . Cement particles can be considered as splinters according to the shape and dimensions illustrated, and the particles were fed at a rate of 0.01 kg/s in the experiment.
Figure 4. Cement particles shape and size.
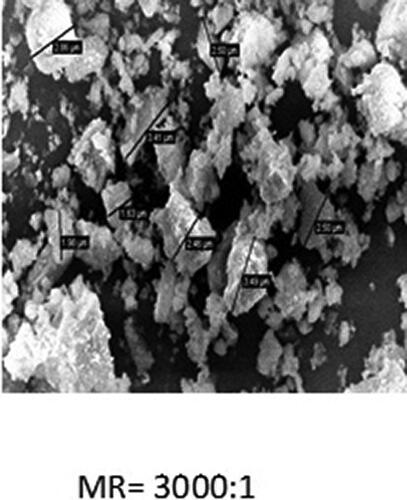
Table 2. Cement particles specifications and properties.
4.1. Validation of the numerical model
Two different techniques were utilized in order to validate the results of the utilized numerical model. First, modeling was done using the geometry and the input data obtained by Wang et al. (Citation2006) and results were compared with the experimental measurements and the numerical data obtained by Wang et al. Second, the numerical modeling was done for the study case geometry and the results were verified with the present experimental results obtained using the five-hole probe.
4.1.1. Validation for the model with results of Wang et al. (Citation2006)
The numerical model results for cement particles, assuming they have a spherical shape, were compared with the measurements and the corresponding numerical data obtained by Wang et al. (Citation2006) at different radial position R as shown in .
Figure 5. Present numerical tangential velocity results vs wang et al. numerical and experimental results.
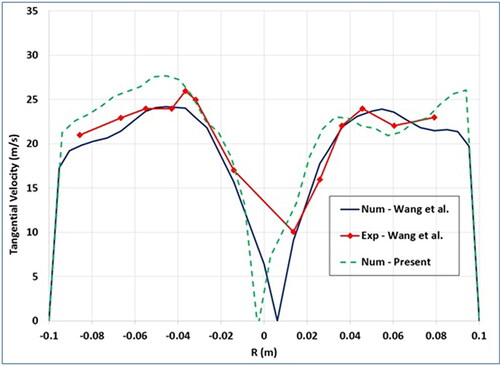
The measurements and the predictions were obtained at the cylindrical section of the cyclone at 0.5 m distance from the bottom of the conical part of the cyclone separator and 0.1 m lower than the bottom end of the vortex finder, for an inlet velocity of 20 m/s. Looking at the figure, one can observe that the simulation results are in good agreement with the measurements as well as the predictions obtained by Wang.
According to Zhao, Su, and Zhang (Citation2006), the tangential velocity increases as the radius is increased in the central section of the cyclone. The tangential velocity grasps a maximum in the outer zone then decreases to reach zero at the wall, such a phenomenon is called ‘Rankine’ type vortex. The central part of the Rankine vortex is considered a quasi-forced vortex, whereas the outer part is considered a quasi-free vortex. The location of the maximum value for the tangential velocity is normally expected at radius 33–40% from the cyclone centerline. Referring to , the simulation results show a better agreement in the forced Rankine vortex zone compared with the free Rankine vortex area. It can be seen from the figure as well that the axis of the forced vortex does not coincide with the axis of the cyclone geometry since the cyclone has a single inlet, which also agrees with Wang et al. (Citation2006) results.
4.1.2. Validation for the model with experimental measurements
The results of measurements obtained by the present experimental setup for the cyclone geometry in were compared with the numerical data obtained for spherical and nonspherical cement particles considering the model proposed by Swamee and Ojha for the drag coefficient calculation, assumed sphericity of 0.75 as shown in . An air inlet velocity of 10 m/s was applied in the measurements as well as in simulation. The predictions and the measurements of the tangential velocity were carried out in the cylindrical section of the cyclone at an elevation of 0.5 m from the bottom.
Figure 6. Measured and predicted tangential velocity (spherical and nonspherical).
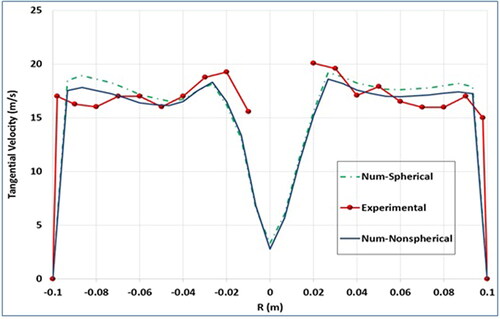
It can be seen from the figure that there exist marked accepted agreements between the measurements and the predictions for both spherical and nonspherical cases. The numerical data for the case of nonspherical particle assumption shows better agreement with the measurements than the spherical one. One can notice in the figure that experimental findings are missing in the region (R > −0.01 m to R < 0.01 m). This was in fact due to that no measurements could be performed using the five-hole probe in the forced Rankine vortex region underneath the vortex finder, the main flow direction is directed upwards to the exit.
From the above validations it can be concluded that the model shows confident results compared with the results obtained either by Wang et al. (Citation2006) or the present experimental measurements.
4.2. Investigating various nonspherical particle models
presents a comparison between the measured and the predicted cyclone tangential velocity for the case of cement particle laden flow. Predictions were obtained by models (I), (II) and (III) representing the non-spherical drag coefficient equations of Haider (1989), Chien (Citation1994), and Swamee, and Ojha (Citation1991), respectively, other than the predictions obtained by the spherical particle model. The measurements and the predictions were carried out for an air inlet velocity of 10 m/s (Re = 43,750) and cement particle mass loading ratio, Xs, of 0.233.
Figure 7. Predicted tangential velocity (spherical and non-spherical particles), and measured tangential velocity with cement particles.
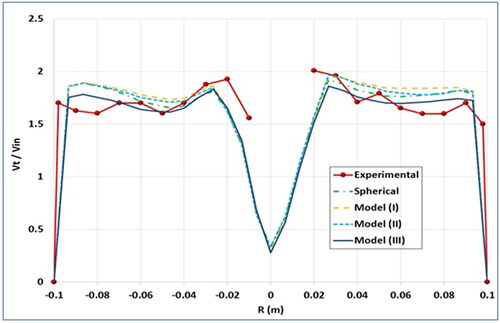
It can be noticed from the figure that the model representing the equation for drag coefficient obtained by Swamee and Ojha, model (III), coincided the best when compared to the measured data. It will be thus utilized in the next sections of the study. Moreover, it can be observed that the numerical prediction results for the spherical particle and the 3-nonspherical particle models are almost identical in the forced Rankine vortex zone.
4.3. Simulation results
4.3.1. Effect of air inlet velocity
The inlet velocity for the air was varied numerically from 8 m/s to 14 m/s, 0.003 mm diameter cement particles of sphericity 0.75 is selected with mass loading ratio fixed at 0.233 throughout the calculations. The resulted cyclone tangential velocities are plotted in a non-dimensional form (Vt/Vin) in .
Figure 8. Predicted tangential velocity with cement particles for different inlet air velocity, Xs = 0.233.
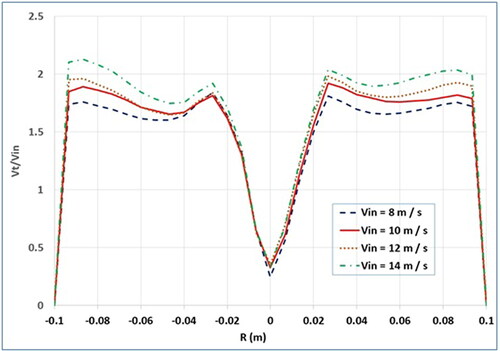
From the figure, it can be noted that as the inlet air velocity increased, the corresponding tangential velocity increases, a result which was stated by Fassani, and Goldstein (Citation2000), the higher inlet velocity results in a higher tangential velocity. Looking thoroughly to the figure, it can be easily observed that for all values of air inlet velocities, the maximum value of the tangential velocity obtained is in the range of (1.5–2) times the air inlet velocity, this agrees with Li et al. (Citation2016), who mentioned that the tangential velocity is accelerated to (1.5 − 2) times the cyclone inlet velocity. Looking again at the figure, one can notice that the value of the maximum (Vt/Vin) ratio attained increases by increasing the inlet velocity. Furthermore, it can be seen that on increasing the inlet velocity, the radial location of the maximum tangential velocity moves slightly away from near the vortex finder in (R.H.S.) part of the figure and moves toward the wall in the (L.H.S) part of the figure. This may be attributed to what is mentioned by Cortes, and Gil (Citation2007) that the displacement of the vortex core from the cyclone center of geometry presses the flow to the wall and obliges it to move through a narrow area and the tangential velocity is increased as a consequence. Moreover, it is clear in the figure that while the velocity ratios (Vt/Vin) have almost the same values in the Rankine forced vortex zone, considerable discrepancies can be noticed in the free Rankine vortex zone.
4.3.2. Effect of particle size
Regarding the impact of the size and mass loading of the particles on the cyclone tangential velocity, it must be known first that turbulence and swirl are the two opposing phenomena in the separation process as stated by Derksen, Sundaresan, and Sundaresan (Citation2006). The swirl affects the solids phase by a centrifugal force resulting in the formation of the driving force behind separation; whereas turbulence enhances the dispersion of solid particles and facilitates escaping of particles in the exit stream. Both phenomena are attributed to particle size effect and the flow conditions in the cyclone.
The cyclone tangential velocity was numerically predicted for various sizes of cement particles of 0.75 sphericity and mass loading ratio of 0.233 injected to air flow at 10 m/s inlet velocity. shows the dimensionless tangential velocity for Cement particle sizes dp ranging from 10 to 40 (microns).
Figure 9. Predicted tangential velocity for different cement particle size, Vin = 10 m/s.
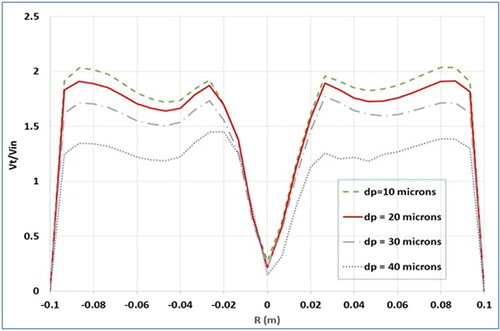
Looking at the figure, it can be observed that increasing the size of the cement particle resulted in a decrease in the corresponding cyclone tangential velocity. The findings from the figure agree with Wan et al. (Citation2008) who mentioned that the effect of injecting solids on the gas flow field can be investigated in two ways. First, the contribution of the momentum of the injected particles to the tangential momentum of the gas stream. Second, the slip velocity occurrence between gas and particles. The former factor is prevailing for smaller particle diameters, whereas the latter factor is dominant for larger particle diameters. It can also be observed that the curves for the four particle sizes lay on each other in the forced vortex zone, whereas the case is different in the free Rankine vortex zone. This indicates that that the effect of the particle size on the swirl appears more clearly in the free Rankine vortex zone. This might, however, be a confirmation of what is stated by Derksen, Sundaresan, and Sundaresan (Citation2006) that swirl is particularly reduced in the free-vortex section of the swirl profile, that was attributed to the high particle concentrations compared to those in the core. The higher the solids loading, the lesser is the swirl strength.
It can also be noticed in the figure that the curve representing the 40 microns cement particle size experiences some distortions compared with the other three curves. It is also seen that tangential velocity was significantly reduced for this case specifically. That could be explained by the reducing effect of particle inertia when increased, due to the relatively large particle size, on the tangential velocity. This agrees with Comas et al. (Citation1991), who reported that the inertia of the particle has an equalizing effect on the momentum of the adjacent layers of the gas stream and hence reducing the tangential velocity.
4.3.3. Effect of particle mass loading ratio
The mass loading ratio, Xs is the ratio between the solid particles mass flow rate in (kg/s) and the air mass flow rate in (kg/s). In this part, the mass loading ratio for the (cement/air) was varied from 0.233 to 0.467 with 10 m/s air inlet velocity. Cement particle diameter of 0.003 mm with particle sphericity of 0.75 were selected throughout the calculations, and the corresponding predicted radial variation of the dimensionless tangential velocity was plotted as shown in .
Figure 10. Predicted tangential velocity for different cement particle mass loading ratios at 10 (m/s) inlet velocity.
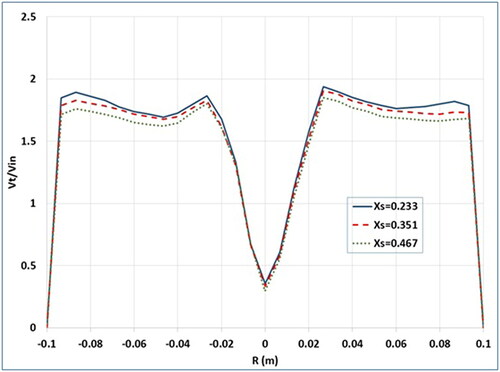
Looking at the figure, one can notice that increasing the mass loading ratio of solids resulted in a decrease in the dimensionless tangential velocity. This agrees with Derksen, Sundaresan, and Sundaresan (Citation2006) that as the solids loading is increased, then the swirl decreases and hence the tangential velocity. The same finding was mentioned by Chu et al. (Citation2011). Qian et al. (Citation2007) stated that injecting particles into the gas field, results in the weakening of the gas flow field, and hence, a reduction in the vortex energy which finally decreases the cyclone tangential velocity. Looking more closely at the figure, it can be observed that the reduction in the tangential velocity is more significant in the free vortex region than in the forced vortex area. This completely agrees with Derksen, Sundaresan, and Sundaresan (Citation2006) who reported that the swirl typically decreases in the area of the free-vortex, and he referred that to the high concentrations of the particles in this area compared to those in the core.
4.3.4. Effect of particle sphericity
On studying the effect of particle sphericity, the particle sphericity values of 0.7, 0.75, and 0.85 are considered for cement particle diameter of 0.003 mm with mass loading ratio of 0.233 throughout the calculations, in addition to the spherical particle case in the model. The results of cyclone tangential velocities were plotted in .
Figure 11. Predicted tangential velocity for different cement particle sphericity for 10 (m/s) inlet velocity.
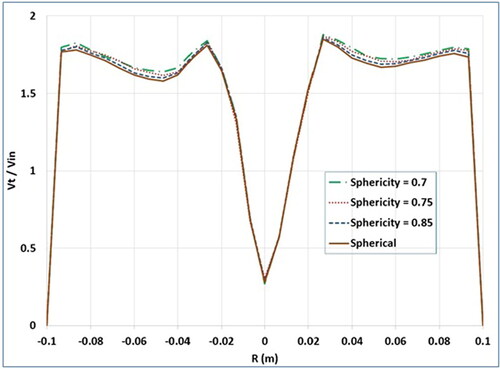
Looking at the figure, it can be observed that as the sphericity was decreased from 1 to 0.7, the tangential velocity increased. This could be explained as follows; First, according to Klett (Citation1995), the turbulence of the carrier phase reduces as a result of injecting non-spherical particles. This reduction is attributed to the extraction of turbulent kinetic energy from the carrier phase as a secondary motion for non-spherical particles. Second, as the carrier phase turbulence decreases, the corresponding tangential velocity increases as a consequence, since the turbulence if increased, will reduce the tangential velocity, a phenomenon described by Rietema, and Krajenbrink (Citation1959), that turbulence has the effect of reducing separation by scattering the particles already separated (eddy diffusion) while both turbulence and wall friction have the effect of decreasing the tangential velocities of the vortex motion which, in turns, define the centrifugal forces required for the separation. In a vortex motion, considering the law of conservation of angular momentum, the rotating fluid increases its tangential velocity hyperbolically when flowing to the center. However, turbulence results in increasing the internal friction of the fluid, and hence, the hyperbolic velocity profiles changes, a phenomenon known as turbulent viscosity.
Looking thoroughly at the figure, one can notice that the particle sphericity seems to have no notable effect on the tangential velocity in the Rankine forced vortex zone and the noted effect occurs only in the free Rankine vortex zone.
5. Conclusions
Gas-solid cyclone separator tangential velocity is investigated numerically and experimentally in this study. Polydispersed particle size distribution for non-spherical particles is adopted. Cyclone particle laden flow is simulated using three equations for the drag coefficient, accounting for particle sphericity with Reynolds Averaged Navier-Stokes equation (RANS). Cement is employed as non-spherical injected particles in both experimental and numerical studies. The following conclusions are drawn:
Increasing the air inlet velocity, results in increased cyclone tangential velocity.
The cyclone tangential velocity decreases as large size particles are injected in the air flow compared to injecting small size particles.
Increasing the mass loading of solids results in decreasing the cyclone tangential velocity.
The effect of increasing particles sphericity was found to decrease cyclone tangential velocity.
| Nomenclature | ||
| = | Inlet section height of cyclone, m | |
| A | = | The actual surface area of the particle, m2. |
| = | The surface of a sphere having the same volume as the particle , m2 | |
| = | Inlet section width, m | |
| = | Discharge duct diameter, m | |
| = | Drag coefficient | |
| = | Generic particle diameter, m | |
| = | Diameter of cylindrical section of cyclone, m | |
| = | Vortex finder diameter, m | |
| = | Acceleration of gravity, m s−2 | |
| = | Turbulence kinetic energy generated due to buoyancy | |
| = | Total cyclone height, m | |
| = | Height of cylindrical section of cyclone, m | |
| = | Turbulent kinetic energy, m2s−2 | |
| = | Turbulent mach number | |
| MR | = | Magnification Ratio of electronic microscope |
| = | Static Pressure, Pa | |
| = | Turbulence kinetic energy generated by mean velocity gradients | |
| = | Radial Position, m | |
| = | Reynolds number | |
| = | Height of the vortex finder, m | |
| = | Time, s | |
| = | Mean components of velocity, m s−1 | |
| = | Fluctuating components of velocity, m s−1 | |
| = | Cyclone air inlet velocity, m s−1 | |
| = | Tangential gas velocity, m s−1 | |
| = | Particle size in cyclones, m | |
| x | = | Coordinate system |
| Xs | = | Mass loading ratio (Solids mass flow rate / Air mass flow rate) |
| = | Mass fraction of particles with diameter greater than d | |
| Greek symbols | ||
| = | Particle volume fraction | |
| = | Particle shape factor | |
| = | Turbulent dissipation rate, m2 s−3 | |
| = | Dynamic viscosity, Pa s | |
| = | Gas dynamic viscosity, Pa s | |
| = | Density, kg m−3 | |
| = | Bulk density, kg m−3 | |
| = | Gas density, kg m−3 | |
| = | Solids density, kg m−3 | |
| = | Particle sphericity | |
| = | Reynolds stress tensor | |
| Subscripts | ||
| i, j, k | = | 1, 2, 3 |
| p | = | Particle |
| c | = | Cyclone |
| e | = | Vortex finder |
| g | = | Gas |
| i | = | Inlet |
| r | = | Radial component |
| s | = | Solids |
| t | = | Tangential component |
| w | = | Wall |
| z | = | Axial component |
Acknowledgments
The authors acknowledge the sympathetic and technical assistance provided by Prof. Sadek Kassab of Alexandria University and Prof. Radwan Abdel Hameed of Zakazic University. Thanks are also due to the fluid mechanics laboratory staff in the Faculty of Engineering, Alexandria University for the effort done in the experimental part of this work.
References
- Chhabra, R. P., L. Agarwal, and N. K. Sinha. 1999. Drag on non-spherical particles: an evaluation of available methods. Powder Technol. 101 (3):288–95. doi:10.1016/S0032-5910(98)00178-8.
- Chien, S. F. 1994. Settling velocity of irregularly shaped particles. SPE Drill, Complet 9 (04):281–9. doi:10.2118/26121-PA.
- Chu, K. W., B. Wang, D. L. Xu, Y. X. Chen, and A. B. Yu. 2011. CFD-DEM simulation of the gas-solid flow in a cyclone separator. Chem. Eng. Sci. 66 (5):834–47. doi:10.1016/j.ces.2010.11.026.
- Comas, M., J. Comas, C. Chetrit, and J. Casal. 1991. Cyclone pressure drop and efficiency with and without an inlet vane. Powder Technol. 66 (2):143–8. doi:10.1016/0032-5910(91)80095-Z.
- Cortes, C., and A. Gil. 2007. Modeling the gas and particle flow inside cyclone separators. Prog. Energy Combust. Sci. 33 (5):409–52. doi:10.1016/j.pecs.2007.02.001.
- Derksen, J. J., S. Sundaresan, and H. E. A. Sundaresan. 2006. Simulation of mass-loading effects in gas–solid cyclone separators. Powder Technol. 163 (1-2):59–68. doi:10.1016/j.powtec.2006.01.006.
- El Ashry, Y., A. M. Abdelrazek, and K. A. Elshorbagy. 2018. Numerical and experimental study on the effect of solid particle sphericity on cyclone pressure drop. Sep. Sci. Technol. 53 (15):2500–16. doi:10.1080/01496395.2018.1458878.
- Elshorbagy, K. A. 1980. Inertial separation of a polydisperse powder in a non-equilibrium gas-solid flow. I. Chem. Eng. Symp. Ser. No 59 5 (5):1–12.
- Farahani, S., M. Noode, V. Tahmasbi, and H. Safikhani. 2011. Effects of using ribs on flow pattern and performance of cyclone separators. Eng. Appl. Comput. Fluid Mech. 5 (2):180–7. doi:10.1080/19942060.2011.11015362.
- Fassani, F. L., and L. Goldstein. 2000. A study of the effect of high inlet solids loading on a cyclone separator pressure drop and collection efficiency. Powder Technol. 107 (1-2):60–5. doi:10.1016/S0032-5910(99)00091-1.
- Haider, A., and O. Levenspiel. 1989. Drag coefficients and terminal velocity of spherical and nonspherical particles. Powder Technol. 58 (1):63–70. doi:10.1016/0032-5910(89)80008-7.
- Kasper, G. 1982. Dynamics and measurement of smokes, I Size characterization of nonspherical particles. Aerosol Sci. Technol. 1 (2):187–99. doi:10.1080/02786828208958587.
- Kepa, A. 2010. Division of outlet flow in a cyclone vortex finder-the CFD calculations. Sep. Purif. Technol. 75:127–31.
- Kim, H. T., K. W. Lee, and M. R. Kuhlman. 2001. Exploratory design modifications for enhancing cyclone performance. J. Aerosol Sci. 32 (10):1135–46. doi:10.1016/S0021-8502(01)00040-4.
- Klett, J. D. 1995. Orientation model for particles in turbulence. J. Atmos. Sci. 52 (12):2276–85. doi: 10.1175/1520-0469(1995)052<2276:OMFPIT>2.0.CO;2.
- Li, X., J. Song, G. Sun, M. Jia, C. Yan, Z. Yang, and Y. Wei. 2016. Experimental study on natural vortex length in a cyclone separator. Can. J. Chem. Eng. 94 (12):2373–9. doi:10.1002/cjce.22598.
- Lim, J. H., S. I. Park, H. J. Lee, M. Z. Zahir, and S. J. Yook. 2020. Performance evaluation of a tangential cyclone separator with additional inlets on the cone section. Powder Technol. 359:118–25. doi:10.1016/j.powtec.2019.09.056.
- Lim, K. S., H. S. Kim, and K. W. Lee. 2004. Comparative performances of conventional cyclones and a double cyclone with and without an electric field. J. Aerosol Sci. 35 (1):103–16. doi:10.1016/j.jaerosci.2003.07.001.
- Loth, E. 2008. Drag of non-spherical solid particles of regular and irregular shape. Powder Technol. 182 (3):342–53. doi:10.1016/j.powtec.2007.06.001.
- Mandø, M., and L. Rosendahl. 2010. On the motion of non-spherical particles at high Reynolds number. Powder Technol. 202 (1-3):1–13. doi:10.1016/j.powtec.2010.05.001.
- Qian, F., Z. Huang, G. Chen, and M. Zhang. 2007. Numerical study of the separation characteristics in a cyclone of different inlet particle concentrations. Comput. Chem. Eng. 31 (9):1111–22. doi:10.1016/j.compchemeng.2006.09.012.
- Rietema, K., and H. J. Krajenbrink. 1959. Theoretical derivation of tangential velocity profiles in a flat vortex chamber-influence of turbulence and wall friction. Appl. sci. Res. 8 (1):177–97. doi:10.1007/BF00411748.
- Rosendahl, L., C. K. Yin, K. Soren, and H. Sorensen. 2003. Modelling the motion of cylindrical particles in a non-uniform flow. Chem. Eng. Sci. 58 (15):3489–98. doi:10.1016/S0009-2509(03)00214-8.
- Shukla, S. K., P. Shukla, and P. Ghosh. 2011. Evaluation of Numerical schemes for dispersed phase modeling of cyclone separators. Eng. Appl. Comput. Fluid Mech. 5 (2):235–46. doi:10.1080/19942060.2011.11015367.
- STAR-CCM+ 9.06 Document Help 2013.
- Swamee, P. K., and C. P. Ojha. 1991. Drag coefficients and fall velocity of nonspherical particles. J. Hydraul. Eng 117 (5):660–7. [Database] doi:10.1061/(ASCE)0733-9429(1991)117:5(660).
- Wadell, H. 1934. The coefficient of resistance as a function of Reynolds number for solids of various shapes. J. Franklin Inst 217 (4):459–90. doi:10.1016/S0016-0032(34)90508-1.
- Wan, G., G. Sun, X. Xue, and M. Shi. 2008. Solids concentration simulation of different size particles in a cyclone separator. Powder Technol. 183 (1):94–104. doi:10.1016/j.powtec.2007.11.019.
- Wang, B., D. L. Xu, K. W. Chu, and A. B. Yu. 2006. Numerical study of gas solid flow in a cyclone separator. Appl. Math. Model. 30 (11):1326–42. doi:10.1016/j.apm.2006.03.011.
- Wang, J. J., L. Z. Wang, and C. W. Liu. 2005. Effect of a stick on the gas turbulence structure in a cyclone separator. Aeros. Sci. Technol. 39 (8):713–21. doi:10.1080/02786820500182404.
- Xiang, R. B., and K. W. Lee. 2001. Exploratory study on cyclones of modified designs. Part. Sci. Technol. 19 (4):327–38. doi:10.1080/02726350290057868.
- Xiang, R. B., and K. W. Lee. 2008. Effects of exit tube diameter on the flow field in cyclones. Part. Sci. Technol. 26 (5):467–81. doi:10.1080/02726350802367829.
- Zhao, B., Y. Su, and J. Zhang. 2006. Simulation of Gas Flow Pattern and Separation Efficiency in Cyclone with Conventional Single and Spiral Double Inlet Configuration. Chem. Eng. Res. Des. 84 (12):1158–65. doi:10.1205/cherd06040.
- Zhu, Y., M. C. Kim, K. W. Lee, Y. O. Park, and M. R. Kuhlman. 2001. Design and performance evaluation of a novel double cyclone. Aeros. Sci. Technol. 34 (4):373–80. doi:10.1080/02786820120723.