
 ?Mathematical formulae have been encoded as MathML and are displayed in this HTML version using MathJax in order to improve their display. Uncheck the box to turn MathJax off. This feature requires Javascript. Click on a formula to zoom.
Abstract
The performance of a needle tungsten corona-discharge charger (NTCC) as a neutralizer in an electrospray aerosol generator (EAG) is compared to that of a surface-discharge micro-plasma aerosol charger (SMAC). We demonstrate the performance of an EAG with a reduction chamber that consists of a neutralizer. The ion produced by the neutralizer is characterized by measuring its ion properties utilizing an ion counter, a Faraday cup electrometer, and a mini-cyDMA. Both the SMAC and NTCC have balanced bipolar ions with ion concentration ratios of 0.95 and 1.07, respectively. While the diffusivity of the positive ions produced by the NTCC is more significant than that of the SMAC, it is the opposite for negative ions. The EAG system is evaluated by optimizing the EAG orifice diameter and carrier airflow rate. It was found that a maximum singly charged electrosprayed particle could be achieved at an orifice diameter and a carrier airflow rate of 10 mm and 1 L min−1, respectively. The performance of charge reduction is determined by a multiply to singly charged ratio. The NTCC neutralizer dramatically reduced the highly charged electrosprayed particle to below 10 elementary charges. In brief, the result shows that the NTCC performs better than the SMAC in reducing multiply charged particles.
Copyright © 2021 American Association for Aerosol Research
EDITOR:
1. Introduction
The electrospray technique uses electrical force to overcome liquid or a solution’s surface tensions for generating particles (Okuyama and Lenggoro Citation2003). It has been applied to diverse applications such as micro- or nanostructure synthesis (He and Jokerst Citation2020), drug delivery, sizing of colloidal nanoparticles (Lenggoro et al. Citation2002), and clinical applications (Steipel et al. Citation2019; Kavadiya and Biswas Citation2018; Barron and He Citation2017). In the aerosol field, electrospray has been applied in the analysis of metal-organic ligand complexes (Keith-Roach Citation2010), electrospray ionization-ion mobility mass spectrometry (Kohoutek and Harrington Citation2021; Özenci and Strålin Citation2019; Chen, Yao, et al. Citation2019), bionanoparticles’ differential mobility analysis (You et al. Citation2014; Guha et al. Citation2012; Bacher et al. Citation2001), and generating particles for filter test performance (Ku Citation2010). In addition, electrospray has also been used for generating gold nanoparticles for noninvasive aerosol delivery (Raliya et al. Citation2017) and manufacturing biological nano aerosols (Morozov Citation2011).
Despite the various applications of electrospray, an electrosprayed particle is highly charged due to the high voltage induced, resulting in easy wall deposition (Fu et al. Citation2011; Suh et al. Citation2005). Therefore, it is inconvenient for aerosol applications. For these reasons, a neutralizer is required to reduce the charged particle to keep it airborne. Moreover, in combination with a mobility classifier, such as a differential mobility analyzer (DMA), the electrospray aerosol generator (EAG) should avoid producing multiply charged electrosprayed particles. Particles carrying multiple charges result in the mis-sizing of DMA-classified particles. It remains challenging to produce only singly charged sample particles (Chen, Jiang, and Chen Citation2019).
Most neutralizers utilize radioactive ionizers to produce bipolar ions. However, radioactive sources have always met legal restrictions (Mustika et al. Citation2021; Saputra et al. Citation2021; Qi and Kulkarni Citation2013; Kwon et al. Citation2005). A neutralizer based on a corona discharge can solve this problem. Corona discharge is a plasma that occurs as a relatively low-power electrical discharge at or near atmospheric pressure (Romay, Liu, and Pui Citation1994; Whitby and Peterson Citation1965). Corona discharge has been proposed to reduce the charges of electrosprayed particles (Laschober et al. Citation2006; Lu and Koropchak Citation2004; Ijsebaert et al. Citation2001; Ebeling et al. Citation2000; Meesters et al. Citation1992). However, there is little literature investigating the charge reduction performance of neutralizers in the EAG system. Laschober et al. (Citation2006) reported that for nanosized particles, a unipolar corona charger could be used as a neutralizer in a commercial EAG. Unipolar corona discharge acquires a charge distribution that significantly depends on ion properties and abundance, flow/residence time variation, the preexisting charge on particles, and particle properties (Qi and Kulkarni Citation2013). Thus, more work is needed to minimize multiply charged particles (Laschober et al. Citation2006). Therefore, a bipolar charger is required for creating a bipolar environment in the charge reduction process. The bipolar charger can reduce multiple charges (Qi and Kulkarni Citation2013).
The present study compares two different bipolar corona dischargers as neutralizers in reducing multiply charged electrosprayed particles. Orifice diameter and carrier airflow rate optimization for maximizing singly charged electrosprayed particles are also discussed. For this purpose, we performed a quantitative analysis of the ion mobility distribution and charge reduction performance of those neutralizers. In order to observe multiple charges, the electrosprayed particles were generated from a polystyrene latex (PSL) solution, the diameter of which was determined by scanning electron microscope (SEM) imaging. Multiple charges were identified by comparing the number concentration measured by the condensation particle counter and the Faraday cup electrometer.
2. Methods
2.1. Design of the electrospray aerosol generator (EAG)
The schematic diagram of an EAG system integrating a corona discharge (referred to as a neutralizer) is depicted in It is well known that there are two types of corona discharges, namely, surface discharged (SD) and volume discharged (VD) (Gibalov and Pietsch Citation2000). This article compares two neutralizers with different types, namely, a surface-discharge microplasma aerosol charger (SMAC) and a needle tungsten corona-discharge charger (NTCC) with SD and VD types, respectively.
Figure 1. The structure of the (a) EAG system, (b) SMAC, and (c) NTCC.
The EAG was designed to have two main parts, that is, a spray chamber and charge-reduction chamber. These chambers were developed by Mustika et al. (Citation2021), and the neutralizer used in the reduction chamber has been proven to increase transmission efficiency. The spray chamber was made of cylindrical hard nylon with an inner diameter of 61 mm and a length of 12 mm. A point-to-hollow plate configuration was applied in this EAG system by employing a single needle-orifice plate. The distance between the needle and grounded-orifice plate was kept constant at 6 mm. This study optimized the orifice diameter and carrier airflow rate to produce as many electrosprayed particles as possible.
A single needle employed a commercial syringe with an inner diameter of 0.19 mm and outer diameter of 0.40 mm (Model NN2713R 27Gx½”, Terumo, Corp., Philippines) (Burckbuchler et al. Citation2010). A positive high voltage source (Model CAAI 2140, Center of Aerosol and Analytical Instrumentation, Department of Physics, ITB, Indonesia) was connected to the needle, and the orifice plate and charge reduction chamber were grounded. A circle channel rounded the needle and was applied to set up a sheath flow of carrier air, where the carrier air was used to help transport the generated electrosprayed particles into the charge reduction chamber. A replaceable orifice plate was made of stainless steel as a disk with a thickness of 1 mm and positioned on the metal holder. The charge reduction chamber was made of aluminum with an open channel facing the spray chamber. A cone-liked shape of 6 mm was constructed as the outlet of the generated electrosprayed particles.
2.2. Description of the SMAC and NTCC
Kwon et al. (Citation2005) previously developed the surface-discharge micro-plasma aerosol charger (SMAC). This article uses SMAC as a comparison because it has been shown to have a performance comparable to a commercial 241Am neutralizer. A design electrode (serrated electrode) is used to build a SMAC. The configuration of SMAC is depicted in . SMAC, in the dual configuration, is attached to a charge reduction chamber’s top and bottom lid as neutralizers. Negative and positive high voltage (HV) DC pulses are used to produce negative (SMAC–) and positive (SMAC+) ions. This configuration results in stable bipolar ions generation.
illustrates a designed needle tungsten corona-discharge charger (NTCC) positioned on a rigid nylon holder. The NTCC consists of an active electrode and a grounded electrode, separated by a Teflon isolator. The NTCC applies the ozone generator module (OGM) power supply as the high voltage source. The same OGM power supply was also used by Mustika et al. (Citation2021). The OGM power supply, fully described in Mustika et al. (Citation2021), employs DC input voltage and is controlled by a DC buck converter. The original OGM output is high voltage in the AC waveform. The AC output voltage is rectified by the diode, which uses forward and reverse bias for producing positive and negative high voltage.
Figure 2. (a) Airflow supply for measuring (b) ion concentration and (c) ion mobility distribution produced by the neutralizer in the reduction chamber.
As a neutralizer in the EAG system, the NTCC employs dual configuration with one labeled NTCC + and the other NTCC–. A sharp-tip tungsten needle was applied as an active electrode. Cylindrical stainless steel with an inner diameter of 8 mm was used as a grounded electrode. Needle tungsten was connected to high-voltage sources, in which positive and negative high voltage for NTCC+ (as a positive ion source) and NTCC– (as a negative ion source), respectively. A strong electrical field was produced between needle tungsten and cylindrical stainless steel due to voltage differences. Then, the air molecules were dissociated, resulting in ionized air molecules.
The NTCC is optimized to obtain the optimum voltage for the positive and negative high voltage source, generating high ion concentration, avoiding spark current and tungsten-particle generation. However, even though the ion concentration is correlated to a high voltage value, enough voltage could produce a spark current due to the breakdown of the surrounding air molecules. In addition, this condition tends to generate new tungsten particles due to the sputtering mechanism on materials (Islamov and Krishtafovich Citation2013; Alonso, Martin, and Alguacil Citation2006). Therefore, the operational voltage applied to the NTCC must be determined.
The NTCC’s operational voltage was evaluated in 1 L min−1 of stable, clean, and dry air supplied to the EAG system. First, the corona current was measured using a digital multimeter (Model 8808 A, Fluke Corp., USA) on the varied applied voltage to the NTCC electrode. Then, the ion concentration generated from the NTCC was observed using an ion counter apparatus (Model CAAI 2120, Center of Aerosol and Analytical Instrumentation, Department of Physics, ITB, Indonesia) as shown in . The ions inside the ion counter would be deflected by the electric field and induced electric current (I). The total of the induced current represented the ions concentration (n) with the following relation:
(1)
(1)
where e, Io, and Q are the elementary charge of the electron, offset current measured, and airflow rate (Suhendi et al. Citation2013; Kwon et al. Citation2005).
2.3. Test particle
We used a known particle size to evaluate the performance of charge reduction by a given neutralizer. In this study, we used a PSL aerosol as it is well known to have monodispersed-sized and spherical particles. PSL aerosol particles were generated by using the EAG system operated in cone-jet mode. The PSL suspension was prepared in a solvent mixture (distilled water [DW] and isopropyl alcohol [IPA] in 50 wt.%). The DW-IPA mixture is typically used for diluting the PSL suspension due to the low surface tension of IPA and high evaporation degree. Thus, the DW-IPA mixture can generate particles in the electrospray process (Akterian Citation2020; Liu and Chen Citation2014; Ku Citation2010). The PSL suspension was synthesized using the liquid-phased method in a batch-process reactor system. The detailed instruction has been fully described elsewhere (Sandi et al. Citation2018). The particle size of the synthesized PSL was observed using a scanning electron microscope (SEM) (Model SU3500, Hitachi High-Tech Corp., Japan). In this study, PSL suspensions with particle sizes of 144, 214, 256, and 318 nm were used as test particles (see Figure S1).
2.4. Identifying multiply- and singly charged particles
The presence of multiply and singly charged particles, resulting in mobility size with multi-mode distribution, can be identified by comparing the measurement from a condensation particles counter (CPC) (Model 3025 A, TSI Inc., USA) and Faraday cup electrometer (FCE). As depicted in Figure S2, the dotted red line shows the measurement using an FCE. Its measured particle concentration is based on the current from the charged particles. Like the ion counter, the concentration measured by an FCE is determined by EquationEquation (1)(1)
(1) , which assumes that each particle carries only one charge. Therefore, for multiply charged particles, the concentration retrieved from EquationEquation (1)
(1)
(1) is higher than the CPC reading. Therefore, the mode correlating with the actual PSL size is that of the singly charged particles.
2.5. Ion concentration and mobility distribution
shows the airflow supply system consisting of a compressor, pressure regulator, dryer, high efficiency particulate air (HEPA) filter, and rotameter. This airflow supply system produces dry and clean air for the ion concentration and ion mobility distribution measurement. The ion concentration measurement utilizes an ion counter and electrometer as shown in . EquationEquation (1)(1)
(1) determines the measured concentration. The same experiment setup for measuring ion concentration was done by Mustika et al. (Citation2021), Saputra et al. (Citation2021), and Yun, Otani, and Emi (Citation1997). To observe the property of ions produced by the SMAC and NTCC, the ion mobility distribution measurement in was attempted. The experiment setup incorporated a mini-cyDMA and an FCE. The mini-cyDMA used was developed by Saputra et al. (Citation2021), which has the same design as the previous one developed by Cai et al. (Citation2017).
2.6. EAG optimization and charge reduction performance
The experiment setup in was used to optimize electrosprayed particles produced by the EAG system and evaluate the neutralizer’s performance to reduce the charge state. The setup consists of airflow control, an EAG system, and a scanning mobility particle sizer (SMPS). The airflow control supplied dry, clean, and stable air into the EAG system.
Figure 3. Experiment setup for optimizing the EAG system and evaluating the charge reduction performance.
The electrosprayed particle was generated by the EAG system, utilizing PSL suspension as the precursor. The PSL solution was fed into the commercial syringe (Model NN2713R 27Gx½”, Terumo, Corp., Philippines) with a constant liquid flow rate of 1 µL min−1 controlled by a syringe pump (Model NE-500, New Era Pump Systems, Inc., USA). The syringe needle was connected to a high voltage source for generating an electrical field in the spray chamber (Model CAAI 2140, Center of Aerosol and Analytical Instrumentation, Department of Physics, ITB, Indonesia). The electrospray was operated in cone-jet mode and monitored using a charge-coupled device (CCD) camera (Model YW 3.2, Shenzhen Hayear Electronics, Co. Ltd., People Republic of China).
The SMPS was used to measure the size distribution of the electrosprayed particles. The SMPS system consists of a charger, a long differential mobility analyzer (LDMA), a condensation particles counter (CPC) (Model 3025 A, TSI Inc., USA), and FCE. In this study, the LDMA used was developed by Song et al. (Citation2006). The charger used was a SMAC previously developed by Kwon et al. (Citation2005). The LDMA sheath flow (Qs) was 13 L min−1, while the CPC and FCE inlet flow were 0.3 and 1.0 L min−1, respectively. The FCE inlet flow was drawn by a vacuum pump with a flow rate measured and regulated by a flowmeter (Model AWM5101VN, Honeywell International, Inc., USA) and rotameter.
The airflow control consists of a pump, buffer, pressure regulator, dryer, HEPA filter, and mass flow controller (MFC) (Model SEC 500 and 400, Horiba Stec Corp., Japan). There were two flows: carrier air (Qc) and dilute air (Qd). Carrier and dilute air were used to transport electrosprayed particles and dilute particle concentration. Dilute air is required to prevent the concentration exceeding the maximum counting of the CPC. The rest of the aerosol flow was exhausted (Qe) to keep the experiment at atmospheric pressure. Both carrier and dilute air were controlled utilizing an MFC.
First, the EAG system was evaluated in two parameters, that is, orifice diameter and carrier airflow rate. Both the orifice diameter and carrier airflow rate could affect the generation of electrosprayed particles. The orifice with diameter sizes (Do) of 4, 6, 8, 10, and 12 mm was evaluated under a constant carrier airflow rate of 3 L min−1. Also, the carrier airflow rate of 1, 2, 3, 4, 5 L min−1 was investigated by applying an orifice with a diameter of 10 mm. The primary purpose of the setup in was to maximize the concentration of singly charged electrosprayed particles. The fluid inlet used was a 214 nm PSL suspension with constant diluted air, Qd = 1.5 L min−1. The electrosprayed particle distribution was measured using the SMPS system. We established the relative penetration ratio of electrosprayed particles generated by the EAG system by the following procedure: the mobility diameter distribution of electrosprayed particles was determined from an LDMA scan, and the signal was recorded as Ncpc(V). Then, the measured concentration of p-charged electrosprayed particles was proportional to the summation of scanned signals as follows:
(2)
(2)
where index p indicates a selected charge number and the summation limits Vmin,p, and Vmax,p describe the minimum and maximum LDMA voltages corresponding to the extraction of p-charged particles from the LDMA. Representing particle concentration based on the summation of scanned signals from the LDMA downstream was also performed by Yang, Dhaniyala, and He (Citation2018). The p-charged concentration, Np, is a function of Qc and Do. Therefore, the relative penetration of singly charged electrosprayed particles can be calculated as follows:
(3)
(3)
where Qc,Ref, and Do,Ref refer to the carrier airflow rate reference and orifice diameter reference, respectively.
Finally, with the optimized orifice diameter and carrier airflow rate, several attempts were made to investigate the performance of charge reduction by the neutralizer used. Both the SMAC and NTCC were applied as neutralizers sequentially, under varied PSL particle sizes. A charger in the SMPS system was set to the OFF condition to obtain the original particle mobility diameter distribution of electrosprayed particles generated by the EAG system with the NTCC as a neutralizer. The result was then compared to that of the charger set to the ON condition. The SMPS system’s charger was taken on as a recharging device; it is required in a common particle mobility sizer to reassure that the measured particle has a single charge. However, in this case, the preexisting charge of particles depends on the neutralizer’s performance. It is well-known that a preexisting charge affects charging efficiency (Yang, Dhaniyala, and He Citation2018; Qi and Kulkarni Citation2013; Fuchs Citation1963). Therefore, this article determined the neutralizer performance by the concentration ratio of multiply to singly charged electrosprayed particles.
3. Result and discussion
3.1. Property of ions produced by the SMAC and NTCC
The concentration and mobility distribution of ions produced by the SMAC and NTCC was investigated. It was found that the concentration of ions produced by the SMAC was 2.15 × 10⁶ and 2.27 × 106 cm−3 for positive and negative ions, respectively. SMAC-produced ions can be regulated by adjusting the control resistance of the HV source. However, here we do not change the control resistance. As for the NTCC, we investigated the dependence of the applied voltage on ion production; the results are shown in .
Figure 4. The generated (a) corona discharge current and (b) ion concentration in unipolar mode by NTCC + and NTCC–.
shows the current-voltage characteristic in the charging zone of the NTCC. The corona onset for inducing corona discharge was found to be approximately 1.0 kV for both NTCC + and NTCC–. In general, the measured currents for negative ions were higher than those for positive ions. The ion concentration in the charging zone has a nonlinear correlation to the corona discharge current. The ion concentration is determined in EquationEquation (1)(1)
(1) .
During the corona discharge process, the reduction chamber’s air was ionized, resulting in positive ions in the formed hydrate cluster of (H3O+)(H2O)n. Meanwhile, the negative ions were generated in the form of (O2–)(H2O)n, (CO4–)(H2O)n, and (NO4–)(H2O)n (Han et al. Citation2003; Reischl et al. Citation1996; Hoppel and Frick Citation1990). A minimum amount of energy is required to dissociate air molecules. As in , the measured ion concentration begins to be significant at a voltage above 2.5 and 1.75 kV for NTCC + and NTCC–, respectively. High ion concentration is desirable for high electrosprayed particle penetration. Also, a balanced concentration for both positive and negative ions is expected in the neutralizer application. Thus, the high voltage source applied was 2.78 and 2.5 kV for NTCC + and NTCC–, respectively. In bipolar mode (both NTCC + and NTCC– were in the ON condition), the NTCC produced 1.82 × 10⁶ and 1.70 × 106 cm−3 for positive and negative ions, respectively.
shows the mobility distribution of ions generated by the SMAC and NTTC. Measurement of ion mobility distribution was carried out using a mini-cyDMA as shown in . It was found that the ion mobility of both the SMAC and NTCC was in the range of 0.55–2.5 cm2 V−1 s−1 and 0.6–4.0 cm2 V−1 s−1 for positive and negative ions, respectively. This result is in line with previously measured air mobility. Ungethüm (Citation1974) used a fast ion spectrometer and observed the ion mobility of air ions ranging from 0.26–11.2 and 0.73–11.9 cm2 V−1 s−1 for positive and negative ions, respectively. Using a high-resolution Vienna-type differential mobility analyzer, de Juan and de la Mora (Citation1998) found that the mobility of air ions ranged from 0.93–1.18 and 1.40–1.96 cm2 V−1 s−1 for positive and negative ions, respectively. These recent studies found that air ion mobility has different distributions for different ionizer devices.
Figure 5. Mobility distribution of ions produced by the SMAC and NTCC.
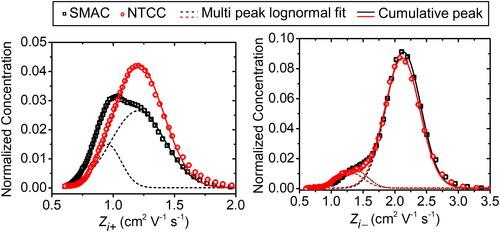
We attempt a multi-peak lognormal fit to identify peaks in the measured ion mobility distribution in . Each peak is determined by its geometric mean. The ion mobility produced by the SMAC obtained two peaks: 0.953 and 1.203 cm2 V−1 s−1 for positive ions; and 1.367 and 2.135 cm2 V−1 s−1 for negative ions. This result is comparable with the measured ion mobility produced by the SMAC that was carried out by Kwon et al. (Citation2005). However, using a high-resolution differential mobility analyzer (HR-DMA), Kwon et al. (Citation2005) showed up to five peaks in the obtained ion mobility distribution. We also observed the ion mobility produced by the NTCC. The result shows that the NTCC has one peak for positive ions (1.206 cm2 V−1 s−1) and two peaks for negative ions (1.332 and 2.221 cm2 V−1 s−1). The results are listed in .
Table 1. Properties of air ions produced by the NTCC and SMAC.
Both the SMAC and NTCC have relatively balanced ion production with positive to negative ion concentration ratios of 0.95 and 1.07, respectively. Due to Coulomb interaction, the diffusivity of ions could strongly depend on its electrical mobility. The diffusion coefficient (Dion) was determined by EquationEquation (4)(4)
(4) provided by Adachi, Kousaka, and Okuyama (Citation1985):
(4)
(4)
where k, e, T, and Zi are Boltzmann’s constant, elementary charge of the electron, temperature, and mean ion mobility, respectively. Positive and negative signs indicate positive and negative ions, respectively. The diffusion coefficient represents the diffusivity of ions, which affects attachment to the particles (Fuchs Citation1963). Ion conductivity (λ) was calculated as Gunn (Citation1955) defined: λ = ni Zi, where ni and Zi are ion concentration and mean ion mobility, respectively.
3.2. Optimization of orifice and carrier airflow rate
Particle throughput has been proven to significantly depend on the orifice diameter (Fu et al. Citation2011). Mustika et al. (Citation2021) and Fu et al. (Citation2011) measured the transmission efficiency based on the mass fraction of penetrating particles. For the record, the transmission efficiency of the electrospray chamber that we used had been investigated by Mustika et al. (Citation2021). The conventional method, which is based on the mass fraction of particles that penetrate, could be used to examine the throughput of an electrospray aerosol generator. However, the conventional method cannot assess the relative penetration of individual p-charged particles, although it is possible to measure charged or neutral fractions. Moreover, using the conventional method required sensitive balance and periodic sampling.
Therefore, we figure out throughput performance as relative penetration of singly charged electrosprayed particles rather than particle transmission. With this method, rapid optimization can be archived where the measurement is done inline. The proposed method could be well used to exam the throughput of an electrospray aerosol generator in relative form. Furthermore, the proposed method could assess the relative penetration of p-charged electrosprayed particles. Indeed, the proposed method has limitations where the measurement results are arbitrary and only suitable for comparative studies. The relative penetration of singly charged electrosprayed particles was calculated based on the particle penetration measured by the utilized SMPS system that follows EquationEquation (3)(3)
(3) .
The penetration of electrosprayed particles from the spray to the charge reduction chamber depends on orifice configuration and carrier airflow (Liu and Chen Citation2014; Fu et al. Citation2011). A strong electrical field between the needle tip and orifice surface results in a highly charged particle with the same polarity as the applied DC high-voltage. Both electrical field and flow resulted in electrosprayed particle movement attracted to the edge of the orifice and drowned to the charge reduction chamber, respectively. Fu et al. (Citation2011) have shown that increasing the orifice can increase throughput. On the contrary, as Liu and Chen (Citation2014) found, an orifice with a diameter of 0.25 inches has better throughput than 1.25 inches. Increasing orifice diameter tends to decrease the gradient of the electrical field, resulting in the flow of dominantly drowned particles passing through the orifice and entering into the charge reduction chamber (Fu et al. Citation2011).
After passing through the orifice, the electrosprayed particles inside the charge reduction chamber interact with the bipolar environment produced by the neutralizer. The charge reduction performance correlates with the n.t value (Yang, Dhaniyala, and He Citation2018), where n and t represent ion concentration and retention time, respectively. So, the throughput of electrosprayed particles depends on their retention time associated with carrier airflow, Qc. Under a well-mixed flow condition, the retention time could be represented by Veff/Qc, where Veff is the effective volume of the charge reduction chamber (Saputra et al. Citation2021; Kwon et al. Citation2006; Adachi et al. Citation1980). Increased flow provides a short retention time, resulting in low performance of the charge reduction. Poor charge reduction affects the electrosprayed particle in a highly charged state, making it easier to deposit and resulting in low throughput.
There should be an optimum orifice diameter and carrier air flowrate that produce higher throughput. For this reason, each orifice diameter must have an optimal flow rate to achieve a better throughput (Mustika et al. Citation2021; Liu and Chen Citation2014). In this study, we assume that both orifice diameter and carrier airflow rate are independent. Therefore, to obtain the best performance, we find the optimum orifice diameter at a specific carrier air flowrate first and then find the optimum carrier air flowrate at optimum orifice diameter as found previously.
We vary the orifice diameter at 4–12 mm at a carrier airflow rate of 3 L min−1. It was found that, at an orifice diameter of 4 mm, the summation of scanning signals from the LDMA downstream had an average and standard deviation of 4.33 × 10⁴ and 0.53 × 104 cm−3, respectively. The summation of scanning signals was retrieved with p = 1 proportional to the concentration of singly charged electrosprayed particles. Then, the relative penetration of the singly charged electrosprayed particles (R1) depicted in was calculated in EquationEquation (3)(3)
(3) with Qc,Ref = 3 L min−1 and Do,Ref = 10 mm. The result shows that the orifice diameter of 10 mm has the highest relative penetration. Mustika et al. (Citation2021) also utilized an orifice with a diameter of 10 mm for their EAG. This result does not indicate that 10 mm is the optimum orifice diameter for all carrier airflow rates. Therefore, we find that the optimum carrier airflow rate showing the best throughput has an orifice diameter of 10 mm.
Figure 6. Relative penetration of electrospray particle sizing of 214 nm with (a) diameter orifice at a carrier airflow rate of 3 L min−1 and (b) carrier airflow rate at orifice diameter of 10 mm.
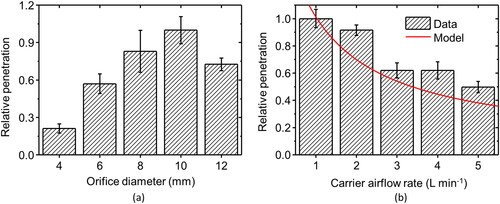
We have varied carrier airflow rates at the optimum orifice diameter, 10 mm, with the result depicted in . It was found that, at a carrier airflow rate of 1 L min−1, the summation of scanning signals from the LDMA downstream, retrieved with p = 1, had an average and standard deviation of 3.83 × 10⁵ and 1.28 × 104 cm−3, respectively. As before, the relative penetration of the singly charged electrosprayed particles (R1) depicted in was calculated in EquationEquation (3)(3)
(3) with Qc,Ref = 1 L min−1 and Do,Ref = 10 mm. The result shows that the relative penetration decreases as the carrier airflow rate increases. The decreasing relative penetration can be explained well by assuming that the EAG system has a constant electrosprayed particle generation rate, which met the dilution concept as follows:
(5)
(5)
where R1E, Qc, and Qd are estimated relative penetration, carrier airflow rate, and dilution airflow rate.
However, the dilution approach in EquationEquation (5)(5)
(5) seems to be underestimated as shown by the red line in . As the carrier airflow rate increases, the retention time particle inside the electrospray chamber will decrease. The effect of retention time on particle deposition must be considered (Fu et al. Citation2011). Therefore, maybe due to decreasing retention time, relative penetration shows more than the predicted values. The result shows that the optimum (indicated by the highest relative penetration) carrier airflow rate was 1 L min−1.
3.3. Charge reduction performance
We have investigated charge reduction performance by using the experimental setup in . First, electrosprayed particles generated by the EAG system were observed. The result is depicted in . The electrosprayed particle distribution was measured in two conditions: charger ON (with recharging) and charger OFF (without recharging). The EAG system equipped without a neutralizer could produce highly charged electrosprayed particles, resulting in insignificant throughput of low-charged electrosprayed particles (see Figure S3). Without a neutralizer, Suh et al. (Citation2005) used particles in a size range between 4–25 nm and found that the number of elementary charges was approximately proportional to the square of the particle size. Mustika et al. (Citation2021) extrapolated Suh et al. (Citation2005) result and found that for a size range between 100 and 250 nm, electrosprayed particles could contain thousands of elementary charges.
Figure 7. (a) NTCC charger performance in reducing multiply charged particles of PSL 144 nm, (b) effect of the charger in the SMPS system on multiply to singly charged ratios and (c) p-charged to the singly charged ratio when charger is in OFF and (d) ON conditions.
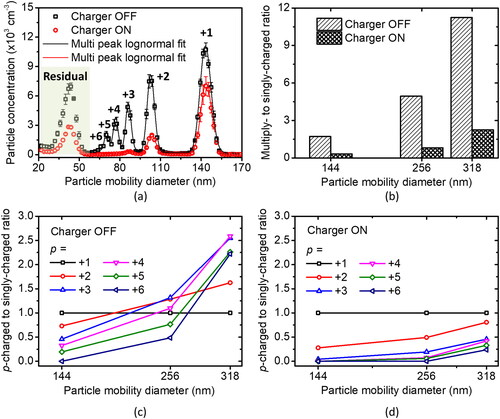
We found that the EAG system equipped with an NTCC as the neutralizer successfully reduced the number of elementary charges indicated by a lower multiply charged particle concentration (see ). However, multiply charged particles (p = +2, +3, +4, +5, and +6) remain observable and need to be considered even after being recharged by the charger. The original electrosprayed particle distribution, in which the particle charge was reduced by a neutralizer, can be found in (charger in the OFF condition). It shows that the EAG system equipped with an NTCC as the neutralizer has significantly reduced elementary charges to below 10. In addition, the charger in the SMPS system could greatly re-reduce the ratio of multiply to singly charged particles during the operation (charger in the ON condition).
shows the multiply to singly charged ratio without and with recharging. The multiply to singly charged ratio was determined by comparing the concentration of multiply charged particles (summation of the peak concentration of mode for p = +2 to +6) to the singly charged particle concentration (peak concentration of mode for p = +1). The result shows that recharging (charger set to ON) could significantly “re-reduce” multiply charged particles. A similar result was found in a previous study; the multiply to singly charged ratio increased per increased particle mobility diameter (Gupta and McMurry Citation1989).
As an individual charge, it was also found that the ratio of p-charged to singly charged particle while the charger is ON is higher than when it is in the OFF condition. The number of elementary charges depends on particle size. Larger particles could attach more elementary charges. The ratio of p-charged to singly charged particle increases as the particle size increases as shown in . The ratio of p-charged to singly charged was calculated based on the peak concentration of the mode of p-charged relative to singly charged. The peak concentration for each mode, except the residual, was estimated by multi-peak lognormal fit. Due to impurities, the residual mode was found (Ichihara et al. Citation2020; Lim et al. Citation2002).
3.4. Comparison of charge reduction performance by the NTCC and SMAC
We compared charge reduction performance by using the experimental setup in . The result is depicted in . The concentration of ions produced by the SMAC is slightly higher than that of the NTCC. However, the peak number concentration of singly charged electrosprayed particles produced by the EAG system with the NTCC was relatively superior to that of the EAG system with the SMAC as a neutralizer. Surprisingly, the NTCC produces a lower multiply to singly charged ratio than the SMAC, which means the NTCC could reduce multiple charges more significantly than the SMAC.
Figure 8. (a) Singly charged peak mode concentration and (b) multiply to singly charged ratio of electrospray particles produced by the EAG system with the SMAC or NTCC as neutralizers.
Due to the diffusivity of positive ions produced by the NTCC being higher than that of the SMAC (see ), the positive ions produced by the NTCC could more easily be attached to electrosprayed particles than those of the SMAC. Besides, the SMAC produced negative ions with higher diffusivity than those of the NTCC. For the same reason, the SMAC could outperform the NTCC in reducing negatively charged particles more than positively charged particles. Moreover, the NTCC’s ion conductivity ratio is higher than that of the SMAC, which could directly affect the multiply to singly charged ratio (Gunn Citation1955). The ion conductivity ratio is defined as the ratio between positive to negative ion conductivity. However, the negative charge was not investigated in this work. Therefore, the NTCC’s performance was superior to that of the SMAC in reducing positive multiply charged particles.
Besides, in the EAG system, a corona discharge as a neutralizer is also used to reduce multiple charges in electrospray mass spectrometry (EMS). A corona discharger was implemented to reduce the multiple charges in electrosprayed particles (Ebeling et al. Citation2000). The corona discharge voltage was varied to get the best result in mass spectrometry. There are predominantly singly charged ions in the EMS spectrum at the appropriate corona discharge voltage, preventing multi-peak spectrum in the small mass-to-mobility ratio window. Our NTCC may have potential applications in EMS. As demonstrated in , the NTCC successfully reduced multiply charged electrosprayed particles.
4. Conclusions
An EAG employing a neutralizer for charge reduction has been developed. Two neutralizers, the SMAC and NTCC, were evaluated for charge reduction performance. The EAG system orifice diameter and carrier airflow rate were optimized to produce a high concentration of singly charged electrosprayed particles. It was found that the EAG system had an optimum performance with an orifice diameter and carrier airflow rate at 10 mm and 1 L min−1, respectively. Positive ion concentrations produced by SMAC and NTCC were 2.15 × 10⁶ and 1.82 × 106 cm−3, respectively.
In comparison, negative ion concentrations produced by SMAC and NTCC were 2.27 × 10⁶ and 1.70 × 106 cm−3, respectively. Both the SMAC and NTCC had relatively balanced ions. The diffusivity of positive ions produced by the NTCC is higher than that of the SMAC, while produced negative ions of the NTCC have lower diffusivity than that of the SMAC. Both the SMAC and NTCC successfully reduced multiply charged electrosprayed particles. The NTCC produced a more significant concentration of singly charged particles than the SMAC. Further, the multiply to singly charged ratio of electrosprayed particles generated by the NTCC neutralizer was below 1 for particle diameters of 144 nm and 256 nm, which means the electrosprayed particle is dominantly singly charged. After all, the NTCC neutralizer substantially reduced multiply charged particles compared to the SMAC neutralizer in the current configuration, leaving predominantly singly charged electrosprayed particles.
Supplemental Material
Download MS Word (1.3 MB)Acknowledgments
CS gratefully acknowledges the Minister of Education, Culture, Research, and Technology Indonesia to provide a master leading to doctoral scholarship (PMDSU). The authors thank Prof. Kikuo Okuyama and Prof. Takafumi Seto for providing LDMA and SMAC apparatus.
Additional information
Funding
References
- Adachi, M., Y. Kousaka, and K. Okuyama. 1985. Unipolar and bipolar diffusion charging of ultrafine aerosol particles. J. Aerosol Sci. 16 (2):109–23. doi:10.1016/0021-8502(85)90079-5.
- Adachi, M., K. Okuyama, Y. Kousaka, and T. Takahashi. 1980. Electrical charging of uncharged aerosol particles under at bipolar ion concentrations. J. Chem. Eng. Japan./JCEJ. 13 (1):55–60. doi:10.1252/jcej.13.55.
- Akterian, S. 2020. Evaluating the vapour evaporation from the surface of pure organic solvents and their mixtures. FSAB. 3 (1):77–84. doi:10.30721/fsab2020.v3.i1.76.
- Alonso, M., M. I. Martin, and F. J. Alguacil. 2006. The measurement of charging efficiencies and losses of aerosol nanoparticles in a corona charger. J. Electrost. 64 (3-4):203–14. doi:10.1016/j.elstat.2005.05.008.
- Bacher, G., W. W. Szymanski, S. L. Kaufman, P. Zöllner, D. Blaas, and G. Allmaier. 2001. Charge-reduced nano electrospray ionization combined with differential mobility analysis of peptides, proteins, glycoproteins, noncovalent protein complexes and J. Mass Spectrom. 36 (9):1038–52.
- Barron, C., and J.-Q. He. 2017. Alginate-based microcapsules generated with the coaxial electrospray method for clinical application. J. Biomater. Sci. Polym. Ed. 28 (13):1245–55. doi:10.1080/09205063.2017.1318030.
- Burckbuchler, V., G. Mekhloufi, A. P. Giteau, J. L. Grossiord, S. Huille, and F. Agnely. 2010. Rheological and syringeability properties of highly concentrated human polyclonal immunoglobulin solutions European Journal of Pharmaceutics and Biopharmaceutics Rheological and syringeability properties of highly concentrated human polyclonal immunoglobu. Eur. J. Pharm. Biopharm. 76 (3):351–6.
- Cai, R., D.-R. Chen, J. Hao, and J. Jiang. 2017. A miniature cylindrical differential mobility analyzer for sub-3 nm particle sizing. J. Aerosol Sci. 106:111–9. doi:10.1016/j.jaerosci.2017.01.004.
- Chen, T., Q. Yao, R. R. Nasaruddin, and J. Xie. 2019. Electrospray Ionization Mass Spectrometry: A Powerful Platform for Noble-Metal Nanocluster Analysis. Angew. Chem. Int. Ed. Engl. 58 (35):11967–77. doi:10.1002/anie.201901970.
- Chen, X., J. Jiang, and D. R. Chen. 2019. Maximizing the singly charged fraction of sub-micrometer particles using a unipolar charger. Aerosol Sci. Technol. 53 (9):990–7.
- de Juan, L., and J. F. de la Mora. 1998. High resolution size analysis ff nanoparticles and ions: running a vienna DMA of near optimal length at reynolds numbers up to 5000. J. Aerosol Sci. 29 (5-6):617–26. doi:10.1016/S0021-8502(97)10028-3.
- Ebeling, D. D., M. S. Westphall, M. Scalf, L. M. Smith, S. Mark, M. S. Westphall, and L. M. Smith. 2000. Corona discharge in charge reduction electrospray mass spectrometry. Anal. Chem. 72 (21):5158–61.
- Fu, H., A. C. Patel, M. J. Holtzman, and D.-R. Chen. 2011. A new electrospray aerosol generator with high particle transmission efficiency. Aerosol Sci. Technol. 45 (10):1176–83.
- Fuchs, N. A. 1963. On the stationary charge distribution on aerosol particles in a bipolar ionic atmosphere. Geofis. Pura E Appl. 56 (1):185–93. doi:10.1007/BF01993343.
- Gibalov, V. I., and G. J. Pietsch. 2000. The development of dielectric barrier discharges in gas gaps and on surfaces. J. Phys. D: Appl. Phys. 33 (20):2618–36. doi:10.1088/0022-3727/33/20/315.
- Guha, S., M. Li, M. J. Tarlov, and M. R. Zachariah. 2012. Electrospray–differential mobility analysis of bionanoparticles. Trends Biotechnol. 30 (5):291–300.
- Gunn, R. 1955. The statistical electrification of aerosols by ionic diffusion. J. Colloid Sci. 10 (1):107–19. doi:10.1016/0095-8522(55)90081-7.
- Gupta, A., and P. H. McMurry. 1989. A device for generating singly charged particles in the 0.1-1.0-μm diameter range. Aerosol Sci. Technol. 10 (3):451–62. doi:10.1080/02786828908959285.
- Han, B., I. W. Lenggoro, M. Choi, and K. Okuyama. 2003. Measurement of cluster ions and residue nanoparticles from water samples with an electrospray/differential mobility analyzer. Anal. Sci. 19 (6):843–51. doi:10.2116/analsci.19.843.
- He, T., and J. V. Jokerst. 2020. Structured micro/nano materials synthesized via electrospray: a review. Biomater. Sci. 8 (20):5555–73.
- Hoppel, W. A., and G. M. Frick. 1990. The Nonequilibrium Character of the Aerosol Charge Distributions Produced by Neutralizes. Aerosol Sci. Technol 12 (3):471–96. doi:10.1080/02786829008959363.
- Ichihara, F., K. Lee, M. Sakamoto, H. Higashi, and T. Seto. 2020. Aerosolization of colloidal nanoparticles by a residual-free atomizer. Aerosol Sci. Technol. 54 (10):1223–30. doi:10.1080/02786826.2020.1770197.
- Ijsebaert, J. C., K. B. Geerse, J. C. M. Marijnissen, J. J. Lammers, and P. Zanen. 2001. Electro-hydrodynamic atomization of drug solutions for inhalation purposes. J. Appl. Physiol. (1985). 91 (6):2735–41.
- Islamov, R. S., and Y. A. Krishtafovich. 2013. Erosion and lifetime of tungsten, gold, and nichrome wire anodes in an ultracorona in Air. IEEE Trans. Plasma Sci. 41 (7):1787–93. doi:10.1109/TPS.2013.2263513.
- Kavadiya, S., and P. Biswas. 2018. Electrospray deposition of biomolecules: applications, challenges, and recommendations. J. Aerosol Sci. 125:182–207. doi:10.1016/j.jaerosci.2018.04.009.
- Keith-Roach, M. J. 2010. A review of recent trends in electrospray ionisation–mass spectrometry for the analysis of metal–organic ligand complexes. Anal. Chim. Acta. 678 (2):140–8.
- Kohoutek, K. M., and B. de. P. Harrington. 2021. Electrospray ionization ion mobility mass spectrometry. Crit. Rev. Anal. Chem. doi:10.1080/10408347.2021.1964938
- Ku, B. K. 2010. Determination of the ratio of diffusion charging-based surface area to geometric surface area for spherical particles in the size range of 100 – 900 nm. J. Aerosol Sci. 41 (9):835–47. doi:10.1016/j.jaerosci.2010.05.008.
- Kwon, S. B., T. Fujimoto, Y. Kuga, H. Sakurai, and T. Seto. 2005. Characteristics of aerosol charge distribution by surface-discharge microplasma aerosol charger (SMAC). Aerosol Sci. Technol. 39 (10):987–1001. doi:10.1080/02786820500380263.
- Kwon, S. B., H. Sakurai, T. Seto, and Y. J. Kim. 2006. Charge neutralization of submicron aerosols using surface-discharge microplasma. J. Aerosol Sci. 37 (4):483–99. doi:10.1016/j.jaerosci.2005.05.007.
- Laschober, C., S. L. Kaufman, G. Reischl, G. Allmaier, and W. W. Szymanski. 2006. Comparison between an unipolar corona charger and a polonium-based bipolar neutralizer for the analysis of nanosized particles and biopolymers. J. Nanosci. Nanotechnol. 6 (5):1474–81. doi:10.1166/jnn.2006.308.
- Lenggoro, I. W., B. Xia, K. Okuyama, and J. F. de la Mora. 2002. Sizing of Colloidal Nanoparticles by Electrospray and Differential Mobility Analyzer Methods. Langmuir 18 (12):4584–91. doi:10.1021/la015667t.
- Lim, K. S., S. B. Kwon, K. W. Lee, and M. C. Kim. 2002. Simultaneous use of polystyrene latex particles of different sizes to evaluate performance of a cyclone and impactor. Aerosol Sci. Technol. 36 (10):1003–11. doi:10.1080/02786820290092285.
- Liu, Q., and D. R. Chen. 2014. An electrospray aerosol generator with x-ray photoionizer for particle charge reduction. J. Aerosol Sci. 76:148–62. doi:10.1016/j.jaerosci.2014.06.003.
- Lu, Q., and J. A. Koropchak. 2004. Corona discharge neutralizer for electrospray aerosols used with condensation nucleation light-scattering detection. Anal. Chem. 76 (18):5539–46.
- Meesters, G. M. H., P. H. W. Vercoulen, J. C. M. Marijnissen, and B. Scarlett. 1992. Generation of micron-sized droplets from the Taylor cone. J. Aerosol Sci. 23 (1):37–49. doi:10.1016/0021-8502(92)90316-N.
- Morozov, V. N. 2011. Generation of biologically active nano-aerosol by an electrospray-neutralization method. J. Aerosol Sci. 42 (5):341–54. doi:10.1016/j.jaerosci.2011.02.008.
- Mustika, W. S., D. A. Hapidin, C. Saputra, and M. M. Munir. 2021. Dual needle corona discharge to generate stable bipolar ion for neutralizing electrosprayed nanoparticles. Adv. Powder Technol. 32 (1):166–74. doi:10.1016/j.apt.2020.11.026.
- Okuyama, K., and I. W. Lenggoro. 2003. Preparation of nanoparticles via spray route. Chem. Eng. Sci. 58 (3-6):537–47. doi:10.1016/S0009-2509(02)00578-X.
- Özenci, V., and K. Strålin. 2019. Clinical implementation of molecular methods in detection of microorganisms from blood with a special focus on PCR electrospray ionization mass spectrometry. Exp. Rev. Mol. Diagn. 19 (5):389–95. doi:10.1080/14737159.2019.1607728.
- Qi, C., and P. Kulkarni. 2013. Miniature dual-corona ionizer for bipolar charging of aerosol. Aerosol Sci. Technol. 47 (1):81–92.
- Raliya, R., D. Saha, T. S. Chadha, B. Raman, and P. Biswas. 2017. Non-invasive aerosol delivery and transport of gold nanoparticles to the brain. Sci. Rep. 7 (1):1–8.
- Reischl, G. P., J. M. Mäkelä, R. Karch, and J. Necid. 1996. Bipolar charging of ultrafine particles in the size range below 10 nm. J. Aerosol Sci. 27 (6):931–49. doi:10.1016/0021-8502(96)00026-2.
- Romay, F. J., B. Y. H. Liu, and D. Y. H. Pui. 1994. A Sonic Jet Corona Ionizer for Electrostatic Discharge and Aerosol Neutralization. Aerosol Sci. Technol. 20 (1):31–41. doi:10.1080/02786829408959661.
- Sandi, A., A. Sawitri, A. Rajak, A. Zulfi, D. Edikresnha, M. M. Munir, and K. Khairurrijal. 2018. Fabrication and characterization of monodisperse polystyrene latex (PSL) with various diameters. IOP Iop Conf. Ser: Mater. Sci. Eng. 367:012015. doi:10.1088/1757-899X/367/1/012015.
- Saputra, C., A. I. Kamil, M. M. Munir, and A. Waris, and Novitrian 2021. The performance of an electrical ionizer as a bipolar aerosol charger for charging ultrafine particles. Aerosol Sci. Technol. 1–17. doi:10.1080/02786826.2021.1976719.
- Song, D. K., H. M. Lee, H. Chang, S. S. Kim, M. Shimada, and K. Okuyama. 2006. Performance evaluation of long differential mobility analyzer (LDMA) in measurements of nanoparticles. J. Aerosol Sci. 37 (5):598–615. doi:10.1016/j.jaerosci.2005.06.003.
- Steipel, R. T., M. D. Gallovic, C. J. Batty, E. M. Bachelder, and K. M. Ainslie. 2019. Electrospray for generation of drug delivery and vaccine particles applied in vitro and in vivo. Mater. Sci. Eng. C 105:110070. doi:10.1016/j.msec.2019.110070.
- Suh, J., B. Han, K. Okuyama, and M. Choi. 2005. Highly charging of nanoparticles through electrospray of nanoparticle suspension. J. Colloid Interface Sci. 287 (1):135–40.
- Suhendi, A., M. M. Munir, A. B. Suryamas, A. B. D. Nandiyanto, T. Ogi, and K. Okuyama. 2013. Control of cone-jet geometry during electrospray by an electric current. Adv. Powder Technol. 24 (2):532–6. doi:10.1016/j.apt.2012.10.009.
- Ungethüm, E. 1974. The mobilities of small ions in the atmosphere and their relationship. J. Aerosol Sci. 5 (1):25–37. doi:10.1016/0021-8502(74)90004-4.
- Whitby, K. T., and C. M. Peterson. 1965. Electrical neutralization and particle size measurement of dye aerosol. I&EC. Ind. Eng. Chem. Fund. 4 (1):66–72. doi:10.1021/i160013a011.
- Yang, H., S. Dhaniyala, and M. He. 2018. Performance of bipolar diffusion chargers: experiments with particles in the size range of 100 to 900 nm. Aerosol Sci. Technol. 52 (2):182–91. doi:10.1080/02786826.2017.1387641.
- You, R., M. Li, S. Guha, G. W. Mulholland, and M. R. Zachariah. 2014. Bionanoparticles as candidate reference materials for mobility analysis of nanoparticles. Anal. Chem. 86 (14):6836–42.
- Yun, C.-M., Y. Otani, and H. Emi. 1997. Development of unipolar ion generator—separation of ions in axial direction of flow. Aerosol Sci. Technol. 26 (5):389–97. doi:10.1080/02786829708965439.