
Abstract
Lithium-ion (Li-ion) batteries that are becoming ubiquitous in various applications may be susceptible to thermal runaway when subjected to certain abuse factors. Fire ensuing from such a thermal runaway event results in significant release of gaseous and particle emissions that pose a critical safety risk to human health. This program was focused on performing detailed characterization of particle emissions from Li-ion battery systems that experience thermal runaway. Four identical lithium iron phosphate (LFP) modules and one nickel manganese cobalt oxide (NMC) module were each subjected to thermal runaway. Two LFP modules and the NMC module were triggered into runaway via nail-penetration, while the remaining two LFP modules were triggered into runaway via over-charging. Particle emissions were characterized in terms of particulate matter mass (PM2.5), real-time total (solid + volatile) and solid PN/size (5.6–560 nm), real-time black carbon, organic/elemental carbon partitioning and volatile fraction of PM2.5. Gaseous emissions were measured using a real-time Fourier Transform Infrared spectrometer. Results suggest that battery fires can result in significant particle and gaseous emissions that may be a function of initiation mechanism, battery chemistry, and cell arrangement within a module among other variables. LFP modules subjected to nail penetration yielded relatively less emissions as propagation was not observed. Over-charging LFP modules resulted in significant emissions that showed a continuous increase till peak levels were reached followed by a gradual decrease. PM2.5 emissions ∼380 g/h and total PN emissions ∼1.5E + 17 particles/h (or 1.3E07 part./cm3) were observed. Nail-penetration of the NMC module resulted in several distinct peaks due to propagation of runaway from cell-to-cell. This module resulted in the highest emission rates of 551 g/h of PM2.5 and 2.1E + 17 particles/h (or 1.9E07 part./cm3) of total PN.
Copyright © 2022 American Association for Aerosol Research
Editor:
1. Introduction
In the recent past, there has been a significant increase in the adoption of electric batteries for a wide array of applications, ranging from portable electronic devices to automotive vehicles, defense and aerospace applications. Battery usage is expected to grow dramatically in upcoming years, with the automotive sector leading the charge. Electrified powertrains offer numerous benefits, among which, the critical ones include improved fuel economy (hybrid vehicles) and reduced tailpipe emissions (zero for fully electric vehicles). One of the most commonly used energy storage technologies in the aforementioned applications is Lithium-ion (Li-ion) batteries due to their high energy densities and specific energy capacities. While these characteristics are desirable, it also makes this battery technology a potential safety hazard. The presence of more reactive material makes them less stable. These batteries are known to be susceptible to thermal runaway events when subjected to certain abuse factors that can lead to fire and smoke emissions. The ensuing heat and emissions pose a serious safety risk, especially in enclosed spaces such as aircraft, ships, spacecraft, surface vehicles, submarines, and buildings (such as garages) with limited ventilation.
Battery failure can be categorized into four failure stages. The first stage is when batteries are subjected to an abuse factor such as thermal (over-heating), electrical (over-charging) or mechanical (Lamb et al. Citation2015; Larsson and Mellander Citation2014; Ohsaki et al. Citation2005). Typically, electrolytes used in Li-ion batteries are composed of a Li salt such as lithium hexafluorophosphate (LiPF6) and a solvent. Commonly used solvents include ethylene carbonate (EC), diethyl carbonate (DEC), dimethyl carbonate (DMC), and ethyl methyl carbonate (EMC). These solvents are traditionally stable chemicals, however, the presence of lithium salt catalyzes their breakdown to volatile species in the presence of abuse factors that enhance thermal exposure (Larsson et al. Citation2017; Zinigrad et al. Citation2005). As electrical or thermal abuse continues, liquid electrolyte starts transforming to gas. Gases that include solvent vapors, carbon dioxide (CO2), carbon monoxide (CO), water vapor, hydroflouric acid (HF), lithium fluoride (LiF) among others eventually vent from the cell. This is referred to as Stage 2 of failure where the escaping gases may be susceptible to ignition. At this stage, early detection of leakage gases from electrolyte could help prevent thermal runaway if certain measures are implemented to stop abuse from continuing (Cai et al. Citation2020, Citation2021; Cai, Stefanopoulou, and Siegel Citation2019; Essl et al. Citation2021). If the battery cell continues to get subjected to the abuse factor, gas generation will continue to the point where pressure generated from these gases will eventually result in breaching the separator. This is classified as Stage 3 of failure and there is onset of smoke generation, and thermal runaway is imminent. The significant release of energy that follows separator breakdown results in a fire, and often, explosion (Stage 4). This results in the emissions of various species that include electrolyte solvent vapors, hydrogen, carbon monoxide (CO), volatile organic compounds (such as alkanes), water vapor, carbon dioxide, elemental carbon compounds, in addition to fluorine compounds stemming from electrolyte and electrode materials such as hydrogen fluoride, phosphorus pentafluoride, phosphoryl fluoride among others (Golubkov et al. Citation2014; Larsson et al. Citation2014; Larsson, Andersson, and Mellander Citation2016; Larsson and Mellander Citation2014; Nedjalkov et al. Citation2016). Other compounds are also released depending on the battery chemistry. While the above stages are more applicable for thermal and electrical abuse factors that lead to cell heating, mechanical abuse factors may directly result in failure stages 3 and 4 (Aiello et al. Citation2021; Doose, Haselrieder, and Kwade Citation2021; Essl, Golubkov, and Fuchs Citation2020; Feng et al. Citation2018; Huang et al. Citation2020; Yokoshima et al. Citation2019). After onset of thermal runaway, fire and gases could contribute toward heating adjacent cells thereby leading to propagation of thermal runaway (Larsson, Andersson, and Mellander Citation2016; Liu et al. Citation2016; Lopez, Jeevarajan, and Mukherjee Citation2015). Furthermore, these stages may also be influenced by the state-of-charge (SOC) of the cells (Golubkov et al. Citation2015).
A number of studies have looked at gaseous emissions from Li-ion battery fires and examined them for their toxicity. Nedjalkov et al. (Citation2016) studied thermal runaway events triggered by a nail penetration device and observed the emissions of several highly toxic compounds including benzene, toluene, styrene, biphenyl, hydrogen fluoride and many others. Sturk et al. (Citation2019) conducted temperature and gas measurements for two different types of Li-ion cell chemistries–Lithium Nickel Cobalt Manganese Oxide/Lithium Manganese Oxide (NMC/LMO) and Lithium Iron Phosphate (LFP) cells. They observed that NMC/LMO cells resulted in CO2 emission rates two orders of magnitude higher than LFP cells. Normalized HF emissions were notably higher for LFP cells relative to NMC/LMO cells. Multiple studies (Andersson et al. Citation2016; Larsson et al. Citation2014, Citation2017; Larsson, Andersson, Andersson, et al. Citation2016; Nedjalkov et al. Citation2016) conducted on different types of Li-ion batteries showed the presence of large amounts of toxic gases such as HF, phosphoryl fluoride (POF3) and phosphorus pentafluoride (PF5). Studies conducted with consumer Li-ion batteries with metal-oxide and olivine type cathodes suggested significant release of carbon dioxide, carbon monoxide, hydrogen, methane and ethylene (Golubkov et al. Citation2014). LCO/NMC combination resulted in highest levels of CO emissions compared to NMC and LFP type cells. Barone et al. (Citation2021) examined the morphology and elemental composition of aerosols emitted by the explosion of Li-ion batteries. Their results highlight the importance of selecting low-toxicity battery materials as aerosol species derived from battery materials were found in abundance. While the majority of these studies focus on some of the gaseous species present in Li-ion battery fires, there have been limited studies reported in the literature that examine particulate emission characteristics in detail (Essl, Golubkov, and Fuchs Citation2020; Zhang, Wang, Li, and Li Citation2019; Zhang, Wang, Li, Li, and Ouyang Citation2019). Additionally, these studies focused on particles in the larger than 2.5 µm size range while the focus of this program was on respirable particles in the sub 2.5 µm size range.
The main objective of this research program was to perform detailed characterization of particle emissions from thermal runaway events of Li-ion battery systems. Measurements of some commonly found gaseous species were also included. Li-ion battery modules with two different types of chemistries, namely, NMC and LFP were included for this program. Controlled thermal runaway experiments were conducted and an emissions sampling method was designed and fabricated to capture constituents in the battery fire. Experiments were designed to understand the level of repeatability of emissions (if any), influence of initiation mechanism, and impact of battery chemistry on particle and gaseous emissions. A suite of particle instrumentation was commissioned for the program to perform detailed characterization of particle emissions. Real-time measurements included total particle number/size (solid + volatile constituents in the 5.6–560 nm size range), solid particle number/size (5.6–560 nm is size), and black carbon concentration. Particulate matter (PM2.5) mass and elemental carbon/organic carbon (EC/OC) partitioning were conducted via filter based batch-sampling technique. Filters used to collect PM were analyzed to determine organic fraction and composition of elemental species. Selected gaseous species were also measured in real-time using Fourier Transform Infrared spectrometry.
2. Experimental methods
2.1. Battery modules tested
Four identical LFP modules and one NMC module were used for this program. These modules are typically used in automotive electrified powertrain applications. Additional details about the battery modules are listed in .
Table 1. Battery module specifications.
2.2. Module instrumentation and conditioning
The LFP modules were instrumented with 15 thermocouples. One additional thermocouple was used to measure ambient temperature. The modules were also instrumented with six voltage sensors. The total module voltage was also monitored. Similarly, the NMC module was also instrumented with 15 thermocouples with one additional thermocouple to measure ambient temperature. This module was instrumented with five voltage sensors, and the total voltage for the module was also monitored. Figures providing additional information on module instrumentation have been included in the supplementary information section. Prior to each test, modules were fully charged using the protocol outlined below:
LFP: Constant-current (CC) charge to 43.2V with 20 A, then constant-voltage (CV) charge at 43.2V to cutoff current of 400 mA.
NMC: CC charge to 41.5V with 60 A, then CV charge at 41.5V to cutoff current of 2 A.
2.3. Battery fire test site
Testing was conducted at SwRI’s Fire Technology Center under SwRI’s large scale calorimeter (figure has been included in the supplementary section). The building is comprised of an air-conditioned 80 × 50 × 42 feet bay. A 10 × 10 ft calorimeter was assembled, consisting of an exhaust hood, plenum, exhaust duct, blower, and instrumentation. This facility is equipped with a large pollution abatement system. The exhaust hood was used to collect combustion gases from the burning test specimen. The hood was positioned 10 ft above the floor of the test area. A skirt was installed, using type “X” gypsum that spanned the 10 ft distance to the floor on three sides of the hood. On the fourth side, the sheet rock covered 9 ft with the opening located in the approximate center to allow for video.
The measuring section of the exhaust duct was equipped with a bi-directional pressure probe, six thermocouples, and sample probes for particle and gaseous instrumentation. The bi-directional probe was connected to a pressure transducer and was used to measure the differential pressure in the center of the duct. The thermocouples were positioned across the cross-sectional area of the duct to measure the average temperature of exhaust gases. The differential pressure and the temperature of exhaust gases were used to calculate the mass flow rate in the exhaust duct. These measurements were connected to a dedicated data acquisition system. All particle and gaseous instrumentation extracted sample from the exhaust duct. Engineers and technicians controlled the test and observed the test article from an isolated control room to ensure personnel safety.
2.4. Equipment used to initiate battery thermal runaway
Thermal runaway was initiated via two mechanisms – nail penetration, and over-charging. Details about the hardware used to accomplish thermal runaway are outlined below:
2.4.1. Nail penetration
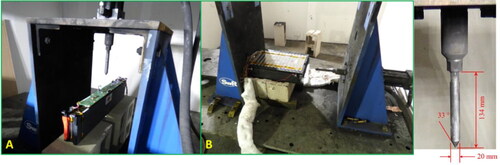
Nail penetration test was conducted in compliance with SAE J2464 procedures. The nail penetration apparatus was controlled by a hydraulic system, and the penetration speed was calibrated to be greater than 8 cm/s. The nail was made of 1144 carbon steel and dimensions of the nail are provided in . For the LFP module, the nail pin was configured vertically (). The penetration depth for the LFP modules was calibrated to be long enough to penetrate all cells vertically. In the case of the NMC module, the nail pin was configured to actuate horizontally as shown in below. The penetration depth for the NMC module was calibrated to be 10 cm into the stacked cells.
Figure 1. Nail penetration rig setup ((a) LFP module, (b) NMC module) along with zoomed in image of the nail.
2.4.2. Overcharge
An NHR 9300 battery cycler was used to overcharge the modules. A current transducer was installed on the charging cable to measure charging current. It is to be noted that the overcharge tests were conducted on LFP modules only.
2.5. Emission instrumentation
Detailed characterization of particle emissions was conducted using methods described in detail in this section. A brief summary of the analytical methods used is included in the supplementary section. These devices are commonly used to characterize automotive tailpipe emissions. However, their fundamental operating principles make them compatible for characterizing aerosol particles emitted from battery fires. The sections below provide additional information about measurement techniques employed by these instruments. It is to be noted that the aerosol sampling techniques used during this program were primarily to measure particles sub 2.5 µm in size. Isokinetic sampling becomes very important for larger particles, and accommodating appropriate sample probes and sampling systems within the framework of the test setup were beyond the scope of this program.
2.5.1. Engine exhaust particle sizer (EEPS)
TSI’s EEPS Model 3090 provides real-time information on particle size distribution and number concentration using a differential mobility-based size classification scheme (Johnson, Caldow, and Pöcher Citation2004). It is capable of measuring particles in the range from 5.6 to 560 nm. Sample particles are charged using a corona charger and subsequently classified based on electrical mobility diameter and detected using twenty-two electrometers. ‘Default inversion’ model was used to convert current data to number concentration information (Wang, Grose, Avenido, et al. Citation2016; Wang, Grose, Caldow, et al. Citation2016). Two EEPS units were employed for this program. One EEPS unit was coupled with SwRI’s Solid Particle Sampling System (SPSS) for solid particle number concentration and size distribution measurement (Khalek Citation2007). This EEPS will henceforth be referred to as solid-EEPS, and the particle number measured by this device will be referred to as solid PN. The SPSS is a well characterized dilution system that facilitates the measurement of solid particles using a catalytic stripper. The second EEPS unit was used without the SPSS to facilitate size distribution and number concentration measurement of solid and volatile components (total constituents). This EEPS unit will henceforth be referred to as total-EEPS, and the particle number measured by this unit will be referred to as total PN. The solid and total-EEPS units extracted samples from two separate BG-3 partial flow dilution systems.
2.5.2. AVL micro-soot sensor
An AVL Micro-soot sensor (MSS) was used to measure real-time black carbon concentration (Schindler et al. Citation2004). It utilizes a photo-acoustic measurement scheme to measure black carbon mass concentration in the sample flow. In this method, black carbon (or elemental carbon or soot) particles are exposed to modulated laser light. This results in an increase in temperature of these strongly absorbing particles. This process results in heating the gas surrounding the particles, leading to the generation of sound waves that are detected by a sensitive microphone. The signal detected by the microphone is proportional to the concentration of soot mass in the measurement cell. The upper and lower limits of the MSS’s detection capability are 50 mg/m3 and 5 µg/m3, respectively.
2.5.3. Gravimetric PM2.5 filter measurement
A Sierra BG-3 partial flow sampling system was used to collect 47 mm diameter PM filters (TX40 media) (Giechaskiel et al. Citation2020). These filters were pre-weighed and post-weighed to determine PM emission rate. The BG-3 includes a radial inflow porous stainless-steel dilution tunnel that helps dilute sample with minimal losses. In addition to gravimetric analysis, filters were also be subjected to vacuum oven sublimation process to determine volatile fraction of PM collected. In this process, filters are baked at 225 °C for 8 h in a vacuum environment. Filters are weighed after the process to determine the volatile weight fraction.
2.5.4. Elemental carbon/organic carbon partitioning
A second Sierra BG-3 partial flow sampling system was used to collect 47 mm diameter Quartz filters. Immediately following sample collection, these filters were transferred to the Emission Laboratory for OC/EC analysis using Sunset Laboratory’s Carbon Aerosol Analyzer (Birch and Cary Citation1996). The instrument utilizes a thermo/optical method that relies on the underlying principle that different carbon compounds undergo oxidation at different temperatures and conditions. OC fraction is determined by volatilizing sample at different temperatures in a Helium environment, and EC fraction is determined by volatilizing sample at different temperatures in an oxygen environment. Filters were analyzed via thermal/optical analysis immediately after sample collection for each test. The Quartz filters used in this campaign were preconditioned in an oven maintained at 900 °C with nitrogen gas for over 8 h to remove contaminants.
2.5.5. Fourier transform infrared (FTIR) spectroscopy
Thermo Scientific’s Antaris IGS gas analyzer allows for the simultaneous identification and quantification of gases. For this work, the FTIR was used to measure real-time concentration of carbon dioxide (CO2), carbon monoxide (CO), formaldehyde (CH2O), nitric oxide (NO), nitrogen dioxide (NO2), hydrochloric acid (HCl), hydrofluoric acid (HF), hydrogen cyanide (HCN), methane (CH4) and propane (C3H8).
2.6. Test setup
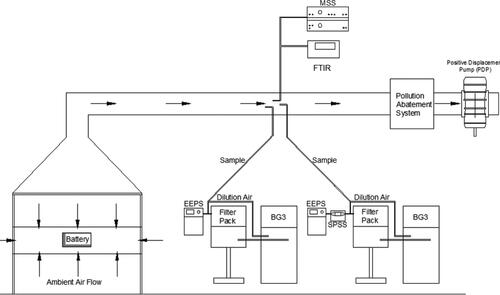
provides a schematic of the test setup. All particle instruments along with the FTIR extracted samples from the duct that was operated at a constant flowrate of ∼3.2 m3/sec. The test article was located under the large hood, and battery emissions were diluted by ambient building air. It is to be noted that there was always sufficient oxygen available for combustion to sustain. Two BG-3 partial flow sampling systems, two engine exhaust particle sizers and one micro-soot sensor were commissioned for the campaign. The EEPS units extracted sample from the auxiliary port of the BG-3. This allowed for the devices to sample diluted exhaust from the battery fire, thereby preventing them from being saturated (exceeding upper concentration limit). The BG-3 used for collecting sample on Quartz filters was also used to deliver sample to the total-EEPS. The solid-EEPS extracted sample from the BG-3 used for collecting sample on the TX40 PM filters. Both BG-3s were operated at similar dilution schedules for each test. The MSS extracted sample from the duct directly. The MSS includes an internal dilution stage, and this was set at 6:1.
Figure 2. Schematic of the experimental setup.
2.7. Test matrix
A total of five tests were conducted as a part of this program. Four LFP modules and one NMC module were induced into thermal runaway in a controlled manner. All five modules involved in the test campaign were manufactured around the same time and were approximately one year old. All five modules were at full SOC prior to the test. The test matrix along with the thermal runaway initiation technique is listed in . Particle emissions were captured from initiation to completion. For nail penetration tests, particle measurements (sampling was turned on) were started 5 s prior to the nail penetration event. For over-charge tests (sampling was turned on), particle measurements were started when venting was observed from the module. Test was deemed to be complete when particle concentration levels returned to pretest background levels as monitored by the total-EEPS.
Table 2. Test matrix.
2.8. Test procedure
The procedure used for the nail penetration and overcharge tests are described in detail in the supplementary information section. For overcharge tests, the NHR cycler was used to apply a 20 A constant charging current to the test article. Nail penetration tests were conducted with the apparatus described previously. Emission measurements were conducted from inception to completion of thermal runaway. No fire suppression systems were engaged at any point. For overcharge tests, sampling was started as soon as venting was observed. For nail penetration tests, sampling was started 5 s before nail penetration was initiated.
3. Results and discussion
Emission results will be discussed for each test followed by comparative analysis focusing on particle emissions for all tests executed as a part of this program.
3.1. Test 1: LFP nail penetration
3.1.1. Module parameters and gaseous emissions
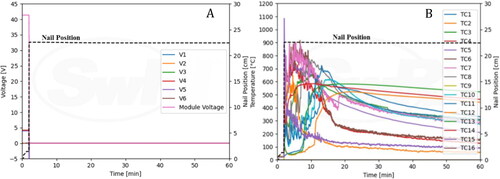
The LFP module was placed on two concrete bricks, and a gap was left between the two bricks to avoid the nail from contacting either of the bricks. After penetration, visible smoke was observed from the penetration region, and the module caught on fire. The fire lasted approximately 1 min and subsided. Thermal runaway did not propagate from the penetration region to other cells in the module. Damage only occurred around the penetration region, and the remaining parts of the module appeared to be undamaged. Two cells on the bottom of the module were pushed out under impact from the nail. The gap was closed during Test 2 to prevent partial penetration. Additional figures have been included in the supplementary section regarding Test 1.
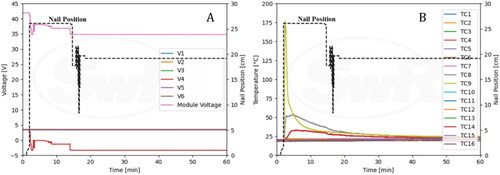
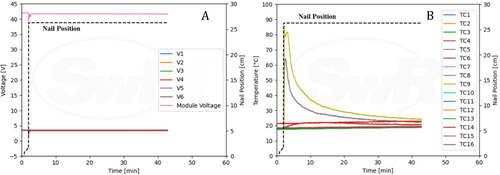
The voltages and nail position are shown in . String voltage 4 was immediately lost upon penetration, and the module voltage dropped from 42.0 V to 34.8 V. String voltages 1, 2, 3, 5, and 6 remained unchanged during the entire event. shows data from the thermocouples (TC) along with nail position. TC 9 peaked at 175 °C shortly after the penetration as expected as it was located near the bottom of the penetration region. TC 8 that is located near the top of the penetration region peaked at 53.5 °C.
Figure 3. Real-time temperature and voltage profile observed during Test 1 (LFP nail penetration).
The thermal runaway event of the LFP module by nail penetration appeared to be mild. As a result, the emission pollutant concentrations measured by FTIR did not show any significant peaks for the measured gaseous components.
3.1.2. Particle emissions
summarizes information on particle emissions observed for all tests. show the real-time profile of solid, total particle number and soot mass emissions respectively. shows average solid particle size distribution while provides size distributions for total particle emissions. Number moment was converted to mass moment assuming a size independent constant density of 1 g/cc. These distributions are shown in and b. For Test 1, the geometric number mean diameter (GNMD) of the solid particle size distribution was 24 nm, and the geometric mass mean diameter (GMMD) was 79 nm. GNMD of total particle size distribution was 55 nm and GMMD was 97 nm. No measurable black carbon concentration was reported by the MSS.
Figure 4. Real-time profile of solid PN emissions as measured in the duct during all five tests. Inlaid plot shows information for tests 1 and 2 with rescaled y-axis.
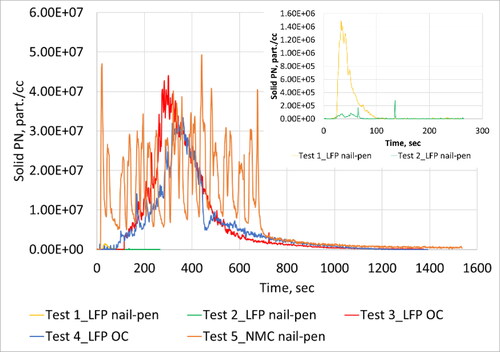
Figure 5. Real-time profile of total PN emissions as measured in the duct during all five tests. Inlaid plot shows information for Tests 1 and 2 with rescaled y-axis.
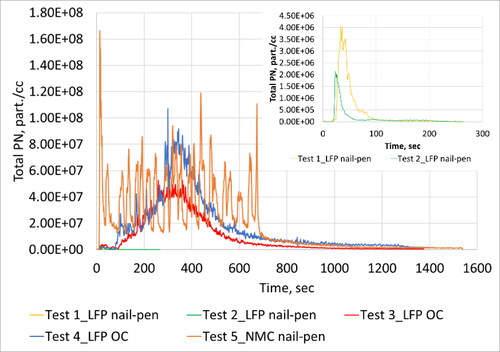
Figure 6. Real-time profile of black carbon emissions as measured in the duct during all five tests. Inlaid plot shows information for Tests 1 and 2 with rescaled y-axis.
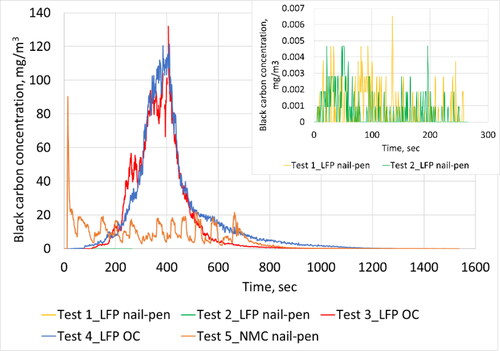
Figure 7. Average solid (a) and total (b) particle size distribution as measured in the duct during all five tests.
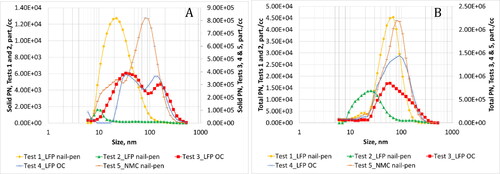
Figure 8. Average solid (a) and total (b) particle mass distribution as measured in the duct during all five tests.
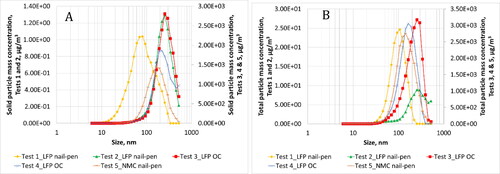
Table 3. Summary of particle results.
3.2. Test 2: LFP nail penetration
3.2.1. Module parameters and gaseous emissions
The penetration test was repeated on a second LFP module. To prevent cells from being pushed out of the casing, two bricks were placed in contact to close the gap. Smoke venting was first observed after penetration. Unlike Test 1, only a small flame was observed near the bottom right side of the module as shown in the figure. The post-test state of the module was similar to that observed during Test 1. Only cells in the penetration region showed significant damage, and the rest of the module appeared undamaged.
Cell voltages along with nail position are shown in . The module voltage dipped from 42.0 V to 39.2 V when nail penetration was initiated but returned to 41.7 V shortly after penetration. shows information for TCs along with nail position. TC 9 peaked at 85.5 °C, and TC 8 peaked at 64 °C.
Figure 9. Real-time temperature and voltage profile observed during Test 2 (LFP nail penetration).
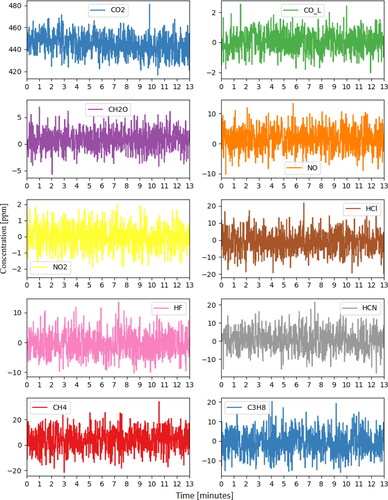
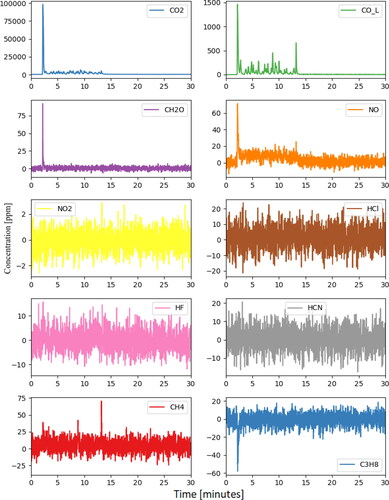
Similar to Test 1, results from the FTIR indicate that gaseous emission concentrations were low for the targeted gases (). However, at the time of thermal runaway the raw FTIR spectra did show significant peaks in a region clearly attributable to the alkyl carbonate compounds that make up the electrolyte in this battery chemistry. This is consistent with a gaseous electrolyte being vented with minimal combustion.
Figure 10. Real-time traces of gases measured using the FTIR (Test 2).
3.2.2. Particle emissions
along with show information on particle emissions. The GNMD of the solid particle size distribution was 24 nm, and the GMMD was 79 nm. GNMD of total particle size distribution was 55 nm and GMMD was 97 nm. As observed during Test 1, no measurable black carbon concentration was reported by the MSS.
3.3. Test 3: LFP overcharge
3.3.1. Module parameters and gaseous emissions
The LFP module was overcharged using a NHR 9300 battery cycler. The module was charged beyond full SOC with 20 A constant current. Overcharging the LFP module resulted in a more dramatic thermal runaway event compared to nail penetration. Smoke venting was visually detected at approximately 16 min into overcharging. Sparks were observed at 17 min 21 s into overcharging. Soon after, the entire module quickly caught fire. At the end of the event, the module was destroyed. A few cells were forced away from the module and scattered on the floor. Figures highlighting the observations mentioned above have been included in the supplementary section.
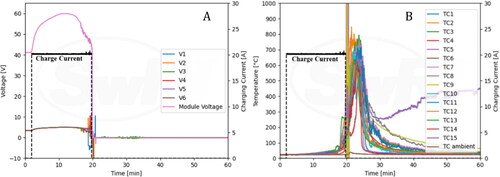
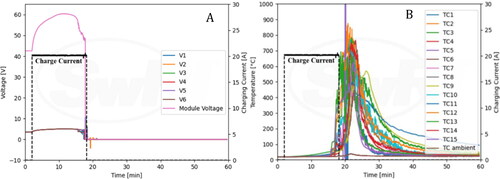
provides information about the charge current and module voltages observed during the experiment. A constant 20 A charge current was supplied to the fully charged module for 17 min and 46 s. This current was terminated once a thermal runaway event was established, approximately 2 min after venting commenced. During overcharging, the module voltage increased to 60 V and exhibited a decreasing and fluctuating period right before thermal runaway occurred. After initiation of thermal runaway, the module voltage dropped to zero. also provides information about TCs along with charging current. One of the TCs peaked to about 850 °C shortly after thermal runaway. High TC spikes occurring at 20 min are likely due to noise signals within the data acquisition system used to record data from TCs.
Figure 11. Real-time temperature and voltage profile observed during Test 3 (LFP overcharge).
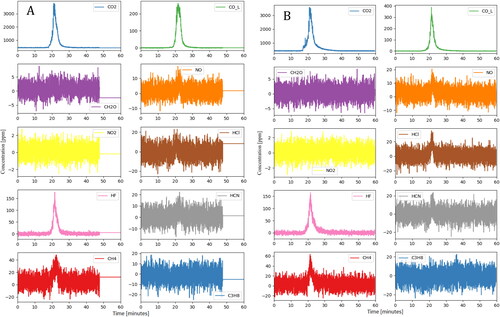
The FTIR results are shown in . Compared with the nail penetration results, the severe thermal runaway due to overcharging yielded much higher gaseous emissions. The peaks in compounds like CO2, CO, and lighter hydrocarbons are those typically expected for combustion of an alkyl carbonate electrolyte although other materials (like plastic casings) may also contribute. Similarly, the HF peak is likely to have primarily formed from LiPF6 (or other fluoride-containing lithium salt) which is often present in electrolytes at concentrations of 1.0 Molar or higher. From a health effects standpoint, the HF peak of 177 ppm is of the greatest concern. National Institute for Occupational Safety & Health (NIOSH) defines the level of HF that is immediately dangerous to life and health (IDLH) as 30 ppm, and the data show the measured concentration remaining above this level for several minutes even under these well-ventilated conditions.
Figure 12. Real-time traces of gases measured using the FTIR for Test 3 (a) and Test 4 (b).
3.3.2. Particle emissions
Thermal runaway resulted in very high particle emissions as evidenced by the real-time traces (). After thermal runaway inception, a continuous increase in emissions were observed for ∼400 s after which emissions gradually returned to baseline levels after ∼1000 s. Real-time traces did not differentiate between discrete cell-level events. It is highly likely that multiple cells experienced thermal runaway at similar points in time. Substantial release of PM2.5, black carbon and solid particles were observed. The GNMD of the solid particle size distribution was 41 nm, and the GMMD was 249 nm. GNMD of total particle size distribution was 69 nm and GMMD was 204 nm.
3.4. Test 4: LFP overcharge
3.4.1. Module parameters and gaseous emissions
The overcharging test was repeated following the same procedure as Test 3 and relevant figures have been included in the supplementary section. Venting was observed at 13 min 31 s into overcharging. After approximately 7 s, a spark was observed near the positive terminal, and the entire module caught on fire afterwards. The module was destroyed during the thermal runaway process, similar to Test 3. The module was overcharged with 20 A constant current for 16 min prior to inception of thermal runaway. During the overcharge process, module voltage increased to 60.0 V and then dropped to 48.4 V immediately prior to thermal runaway (). One of the TCs peaked at about 850 °C shortly after the inception of thermal runaway (). The emissions measured by the FTIR were similar in concentration and duration to the previous test (). Once again, the gases likely result from combustion of the alkyl carbonate electrolyte material and the fluoride salts within. HF was found at concentrations above the IDLH level for several minutes.
Figure 13. Real-time temperature and voltage profile observed during Test 4 (LFP overcharge).
3.4.2. Particle emissions
Similar to Test 3, thermal runaway resulted in significant release of particle emissions as evidenced by the real-time traces (). After inception of thermal runaway, a continuous increase in emissions were observed for ∼400 s after which emissions gradually returned to baseline levels after another ∼1000 s. Real-time traces did not shed any light on discrete cell-level events. Substantial release of PM2.5, black carbon and solid particles were observed. The GNMD of the solid particle size distribution was 69 nm, and the GMMD was 230 nm. Solid particles showed a bimodal size signature with a peak at 34 nm and a second peak at 143 nm. GNMD of total particle size distribution was 68 nm and GMMD was 155 nm. In this case, a wide mono-modal distribution was observed with a single peak at 93 nm.
3.5. Test 5: NMC nail penetration
3.5.1. Module parameters and gaseous emissions
The NMC module featured stacked pouch cells and relevant figures have been included in the supplementary section. To accommodate the large size of the pack and stability of the module during testing, the nail penetration apparatus was reconfigured such that the module could be penetrated horizontally. Sparks were observed immediately upon penetration, both, at the penetration region and at the opposite side of the module. Within a couple of seconds, the module caught on fire. The thermal camera shows that high temperature was observed among cells being penetrated initially, and subsequently on remaining cells as thermal runaway propagated. The NMC module was destroyed during the thermal runaway process as shown in. Cell and module voltages immediately dropped to zero after nail penetration (). The quick drop of voltage is consistent with the immediate and severe thermal runaway event. The TCs peaked at ∼900 °C as shown in .
Figure 14. Real-time temperature and voltage profile observed during Test 5 (NMC nail penetration).
The FTIR results show multiple emission gases’ concentrations peaked during thermal runaway (). Following the first distinct peak, several smaller peaks were observed. These corresponded to subsequent cells experiencing thermal runaway due to propagation. The intensity of the thermal runaway led to peaks that were shorter in duration but of much higher concentration.
Figure 15. Real-time traces of gases measured using the FTIR (Test 5).
3.5.2. Particle emissions
Thermal runaway resulted in very high particle emissions. After thermal runaway inception, several peaks were observed which corresponded to the propagation of thermal runaway from cell-to-cell. Particle emissions observed from each cell event was of similar order of magnitude except for the first cell which resulted in an order of magnitude higher particle emissions. The GNMD of the solid particle size distribution was 54 nm, and the GMMD was 163 nm. Solid particles showed a mono-modal size signature with a peak at 93 nm. GNMD of total particle size distribution was 54 nm and GMMD was 144 nm. A mono-modal distribution was observed with a single peak at 80 nm.
3.6. Repeatability of thermal runaway events
Tests 1 and 2 were nail penetration tests conducted on two identical LFP modules. Tests 3 and 4 were over-charge tests conducted on two more identical LFP modules (similar to the ones used in Tests 1 and 2). In the case of Test 1, some cells fell through from the bottom of the module due to impact of the penetrating nail. This gap was closed for Test 2. While some comparisons are drawn between Tests 1 and 2, it is to be noted that there were some differences in the execution procedure between the two tests in terms of test setup. Tests 3 and 4 were executed in a very similar manner and comparisons between the two tests are valid.
3.6.1. Test 1 vs test 2 (LFP nail penetration tests)
Visually, fire was observed during Test 1 after the inception of thermal runaway. In the case of Test 2, only smoke was observed without the presence of fire. Both tests lasted for a similar duration of the order of 4 min. Negligible black carbon emissions were observed in both cases. PN emissions were observed to be higher for Test 1 compared to Test 2, both, on a solid as well as total basis. Test 2 resulted in solid PN emissions close to instrument background levels while Test 1 yielded an order of magnitude higher emissions. For Test 1, the peak of the solid particle size distribution was ∼20 nm. In the case of total PN, Test 1 resulted in two and half times higher emissions than Test 2. The size signatures also looked very different with Test 1 having a peak at ∼70 nm while Test 2 exhibited a peak at 25 nm. PM2.5 emissions were relatively low for both tests considering higher number emissions, which suggests the particles had low density. This is consistent with the fact that 100% of the total carbon compounds collected on the Quartz filters were organic carbon material. While PM2.5 emissions were low, it is to be noted that larger particles (>2.5 µm) with higher mass may have been generated that were not captured with the aerosol sampling techniques adopted for this program. Test 1 showed a higher peak PN emission concentration level than Test 2–both, on a solid as well as total basis. The emissions profile (shown in ) looked similar for both tests wherein a dramatic increase was observed at the inception of the thermal runaway event, and a gradual decrease back to background levels occurred over a duration of 100 s.
3.6.2. Test 3 vs test 4 (LFP overcharge tests)
For both tests, the battery module was charged beyond full SOC with a constant current of 20 A. During Test 3, the module experienced thermal runaway 960 s from the start of over-charging, and in Test 4, after 811 s. Both tests lasted for similar duration of the order of 22 min from start of runaway after which particle emissions returned to background levels. The runaway event resulted in smoke and fire. Significant black carbon emissions were observed during both tests. Average black carbon emissions were higher for Test 4 compared to Test 3 by ∼19%. Real-time soot mass emissions profile showed that both tests resulted in a peak emission level close to ∼120 mg/m3. While both tests showed similar profiles, Test 4 exhibited a more gradual return to background concentration levels following the peak emission event.
Average total PN emissions were 38% higher for Test 4 compared to Test 3. Both tests resulted in size signatures with similar GNMD values, although, the signatures looked very different (). Test 3 exhibited a peak at 60 nm, while Test 4 exhibited a peak at 93 nm. This resulted in very different mass distributions with GMMD being 203 nm for Test 3 and 155 nm for Test 4. Test 3 resulted in 31% higher average solid PN emissions compared to Test 3. Both tests yielded solid particles with bi-modal size signatures. Some differences were observed in the sub 20 nm size range that could be influenced by EEPS background noise levels.
Real-time emission profiles of solid and total PN emissions looked comparable to that of the MSS. Peak total PN emissions observed for Test 4 was almost twice as that observed during Test 3. Further, there was an order of magnitude difference in the peak levels. Peak emission levels were observed approximately 6 min from the start of the runaway event for both tests. Peak solid PN emissions were 24% higher for Test 3 relative to Test 4, but of similar order of magnitude. Solid and total-PN emissions peaked at similar durations from the start of the runaway event.
PM2.5 emissions were of the order of 380 g/hr for Tests 3 and 4, and were within 3% of each other. This is corroborated by the total-EEPS based mass emissions that were within 1.2% of each other as shown in . The area under the real-time curves for each test were similar as exhibited by the plot. It is to be noted that despite having very different looking total-EEPS size distributions, the total-EEPS based mass distributions yielded similar total-EEPS mass-based emission rates. Vacuum oven sublimation based volatile weight fraction determination yielded similar fractions of the order of 20% for both tests. Quartz filter based OC/EC analysis showed that Test 3 had a 37% higher OC fraction of total carbon derived compounds compared to Test 4.
3.7. Influence of thermal runaway initiation mechanism and battery chemistry
Nail-penetration was used to initiate thermal runaway for LFP modules in Tests 1 and 2, and the NMC module in Test 5. LFP modules were induced into thermal runaway via over-charging during Tests 3 and 4. During Tests 1 and 2, cells directly in the path of the nail experienced thermal runaway. Thermal runaway propagation was not observed as the remaining cells remained intact. It is to be noted that the physical dimensions of the module played a role in how it was oriented in the nail penetration apparatus. One area of future research could examine the impact of orientation of such modules with respect to the nail which was beyond the scope of this program. The absence of propagation of thermal runaway to remaining cells during both tests suggests that the LFP modules tested offer some benefits from safety and stability standpoints when subjected to such a penetration event. In general, no significant release of particle and gaseous emissions were observed during both these tests when compared to the remaining tests.
The NMC module consisted of cells in the form of pouches that were stacked next to each other. When nail penetration was initiated, the nail penetrated the first cell. The first cell entered thermal runaway immediately, and this led to the propagation of thermal runaway from cell-to-cell unlike the case for LFP modules. All 14 cells entered thermal runaway eventually, one at a time. Distinct peaks were recorded by all real-time particle instruments as well as by the FTIR that corresponded to each cell going into thermal runaway.
Thermal runaway of LFP modules were initiated via over-charging in Tests 3 and 4. After initiation, observations were substantially different compared to LFP nail penetration tests. The entire module caught on fire and all cells likely experienced thermal runaway. A dramatic increase in particle emissions were observed and the concentrations peaked after ∼350 s from the inception of thermal runaway. Particle emissions gradually decreased to background levels. Discrete cell-level thermal runaway events were difficult to discern from real-time profiles as it was likely that multiple cells went into thermal runaway at similar times. Peak levels of total PN emissions were 35% higher for Test 5 compared to Test 4 which was higher than all other tests conducted with LFP modules. During Test 5, peak value occurred close to the start of the runaway event while the LFP overcharge tests yielded peak values close to the half way point. In terms of black carbon emissions, Tests 3 and 4 exhibited peak values close to 120 mg/m3 while Test 5 resulted in a peak value close to 90 mg/m3 (25% lower).
From a gaseous emissions standpoint, NMC nail penetration test resulted in a peak CO2 value that was more than 20 times that observed in LFP overcharge tests, indicating a much larger mass of electrolyte combusted per second. In addition, the NMC chemistry produced a totally different mixture of compounds than seen in the LFP tests. Despite the high rate of electrolyte combustion, there was no HF observed in the NMC test at all, likely because of the use of an anion salt not containing fluoride. HF with a peak concentration close to 170 ppm was observed during both LFP overcharge tests. The most hazardous compound observed during NMC nail penetration test was formaldehyde, which was measured above its 20 ppm IDLH level for less than 5 s. Although more testing is needed, this strongly suggests that the selection of anion salts for the electrolyte can have a strong impact on the toxicity of gases produced during thermal runaway. It is not clear from this data whether formaldehyde was disproportionately produced by the NMC cells or if it appeared only because the larger combustion mass led to its rising above the FTIR detection limit.
4. Conclusions
The primary objective of this program was to conduct detailed investigation of particle emissions along with limited characterization of gaseous emissions from thermal runaway events of Li-ion battery systems. Two different Li-ion battery chemistries that included LFP and NMC systems were evaluated for particle and gaseous emissions during thermal runaway. The test campaign was designed to gain information on the influence of battery chemistry, impact of runaway initiation mechanism and the repeatability of thermal runaway emissions. A total of five tests were executed as a part of the program using 4 identical LFP modules and one NMC module. All five modules were manufactured around the same time and were close to a year old. Two LFP modules and the single NMC module were induced into thermal runaway via nail penetration. The remaining two LFP modules were induced into thermal runaway via overcharging beyond full SOC. Test articles were located under a large hood equipped with an exhaust duct (whose flowrate could be controlled) from which particle and gaseous emissions were sampled. A wide array of particle instruments were utilized for the program and included the measurement of PM2.5, real-time solid PN/size, real-time total PN/size, real-time black carbon, OC/EC, and weight fraction of volatile material. Particle emissions were measured from the start of thermal runaway till emission levels returned to background levels (as recorded by real-time instruments). In the case of the nail penetration tests, measurements were started 5 s prior to triggering the nail. For over-charge tests, measurements were started when venting of gases were first observed.
The results from this work highlight the following:
Battery fires emanating from thermal runaway events can result in significant particle and gaseous emissions. Both overcharge tests of LFP modules, and the nail penetration test of the NMC module resulted in PM2.5 emissions exceeding 375 g/h and total PN emissions of the order of 2E + 17 part./h. These emission rates are 5 to 6 orders of magnitude higher than those typically emitted from the exhaust of a modern heavy-duty diesel engine. It is to be noted that the aforementioned statement is primarily to provide a contextual comparison with a well-documented particle emitter.
Initiation mechanism could play an important role in the scale of the thermal runaway event. Within a module, it is possible that there may be a localized impact with some cells experiencing runaway without further propagation. This was observed during nail penetration tests of LFP modules where no cell-to-cell propagation occurred.
Physical dimensions and arrangement of cells within a module could also influence the severity of the runaway event, particularly if the triggering mechanism is mechanical in nature.
Battery chemistry coupled with the thermal runaway initiation mechanism influences the magnitude of particle and gaseous emissions, along with release profile. The overcharge LFP tests resulted in a single continuous release event till peak levels were reached after which a gradual decrease was observed. The NMC nail penetration test resulted in multiple peak events that corresponded with propagation of thermal runaway from one cell to the next.
Particle emissions from thermal runaway events of identical modules induced into runaway via the same mechanism could be highly variable.
Battery chemistry including the type of electrolyte solvent/salt can influence the nature of hazardous gaseous emissions. The LFP overcharge tests yielded HF that exceeded IDLH limits (30 ppm) while the NMC nail penetration test yielded formaldehyde beyond IDLH limits (20 ppm).
Battery usage has grown dramatically over the past few years and is expected to continue increasing in the upcoming years. In addition to consumer electronics, battery usage is expected to exponentially increase in automotive and aerospace applications. This program serves as a first of its kind deep dive into understanding fine particle emissions from Li-ion battery fires. Results from this study highlight how significant emissions can be when batteries enter thermal runaway. This demonstrates the need for establishing a regulatory framework focused on understanding and mitigating such emissions from different battery technologies. Such guidelines would not only draw attention to development of safer battery systems, but also ensure selection of appropriate personnel protective equipment (PPE) for first responders dealing with accidents related to batteries. While this program provides some insight on emissions from battery fires, additional research on thermal runaway events with a focus on battery SOC, various battery chemistries, thermal runaway initiation mechanisms, and repeats are required to better understand safety and health implications.
Supplemental Material
Download MS Word (29.3 MB)Acknowledgments
Authors acknowledge SwRI staff Mr. Kevin Jones (Senior Research Engineer), Dr. Bapi Surampudi (Institute Scientist), Mr. Ian Smith (Manager), Mr. Mickey Argo (Assistant Manager), Mr. Daniel Preece (Supervisor), Ms. Svitlana Kroll (Principal Scientist), and Mr. Jason Huczek (Principal Engineer).
Additional information
Funding
References
- Aiello, L., I. Hanzu, G. Gstrein, E. Ewert, C. Ellersdorfer, and W. Sinz. 2021. Analysis and investigation of thermal runaway propagation for a mechanically constrained lithium-ion pouch cell module. Batteries 7 (3):49. doi:10.3390/batteries7030049.
- Andersson, P., P. Blomqvist, A. Loren, and F. Larsson. 2016. Using fourier transform infrared spectroscopy to determine toxic gases in fires with lithium-ion batteries. Fire Mater. 40 (8):999–1015. doi:10.1002/fam.2359.
- Barone, T. L., T. H. Dubaniewicz, S. A. Friend, I. A. Zlochower, A. D. Bugarski, and N. S. Rayyan. 2021. Lithium-ion battery explosion aerosols: morphology and elemental composition. Aerosol Sci. Technol. 55 (10):1183–201. doi:10.1080/02786826.2021.1938966.
- Birch, M. E., and R. A. Cary. 1996. Elemental carbon-based method for monitoring occupational exposures to particulate diesel exhaust. Aerosol Sci. Technol. 25 (3):221–41. doi:10.1080/02786829608965393.
- Cai, T., P. Mohtat, A. G. Stefanopoulou, and J. B. Siegel. 2020. Li-ion battery fault detection in large packs using force and gas sensors. IFAC-PapersOnLine 53 (2):12491–6. doi:10.1016/j.ifacol.2020.12.1763.
- Cai, T., A. G. Stefanopoulou, and J. B. Siegel. 2019. Early detection for Li-ion batteries thermal runaway based on gas sensing. ECS Trans. 89 (1):85–97. doi:10.1149/08901.0085ecst.
- Cai, T., P. Valecha, V. Tran, B. Engle, A. Stefanopoulou, and J. Siegel. 2021. Detection of Li-ion battery failure and venting with carbon dioxide sensors. eTransportation 7:100100. doi:10.1016/j.etran.2020.100100.
- Doose, S., W. Haselrieder, and A. Kwade. 2021. Effects of the nail geometry and humidity on the nail penetration of high-energy density lithium ion batteries. Batteries 7 (1):6–14. doi:10.3390/batteries7010006.
- Essl, C., A. W. Golubkov, and A. Fuchs. 2020. Comparing different thermal runaway triggers for two automotive lithium-ion battery cell types. J. Electrochem. Soc. 167 (13):130542. doi:10.1149/1945-7111/abbe5a.
- Essl, C., A. W. Golubkov, E. Gasser, M. Nachtnebel, A. Zankel, E. Ewert, and A. Fuchs. 2020. Comprehensive hazard analysis of failing automotive lithium‐ion batteries in overtemperature experiments. Batteries 6 (2):30. doi:10.3390/batteries6020030.
- Essl, C., L. Seifert, M. Rabe, and A. Fuchs. 2021. Early detection of failing automotive batteries using gas sensors. Batteries 7 (2):25. doi:10.3390/batteries7020025.
- Feng, X., M. Ouyang, X. Liu, L. Lu, Y. Xia, and X. He. 2018. Thermal runaway mechanism of lithium ion battery for electric vehicles: a review. Energy Stor. Mater. 10:246–67. doi:10.1016/j.ensm.2017.05.013.
- Giechaskiel, B, et al. 2020. Accuracy of particle number measurements from partial flow dilution systems. (Ld).
- Golubkov, A. W., D. Fuchs, J. Wagner, H. Wiltsche, C. Stangl, G. Fauler, G. Voitic, A. Thaler, and V. Hacker. 2014. Thermal-runaway experiments on consumer Li-ion batteries with metal-oxide and olivin-type cathodes. RSC Adv. 4 (7):3633–42. doi:10.1039/C3RA45748F.
- Golubkov, A. W., S. Scheikl, R. Planteu, G. Voitic, H. Wiltsche, C. Stangl, G. Fauler, A. Thaler, and V. Hacker. 2015. Thermal runaway of commercial 18650 Li-ion batteries with LFP and NCA cathodes - impact of state of charge and overcharge. RSC Adv. 5 (70):57171–86. doi:10.1039/C5RA05897J.
- Huang, S., X. Du, M. Richter, J. Ford, G. M. Cavalheiro, Z. Du, R. T. White, and G. Zhang. 2020. Understanding Li-ion cell internal short circuit and thermal runaway through small, slow and in situ sensing nail penetration. J. Electrochem. Soc. 167 (9):090526. doi:10.1149/1945-7111/ab8878.
- Johnson, T., R. Caldow, and A. Pöcher. 2004. Sizer spectrometer for engine exhaust particle measurements. SAE Tech Pap Ser 2004-01-13.
- Khalek, I. A. 2007. Sampling system for solid and volatile exhaust particle size, number, and mass emissions. J. Fuels Lubric. 116 (724):122–33.
- Lamb, J., C. J. Orendorff, E. P. Roth, and J. Langendorf. 2015. Studies on the thermal breakdown of common li-ion battery electrolyte components. J. Electrochem. Soc. 162 (10):A2131–35. doi:10.1149/2.0651510jes.
- Larsson, F., J. Anderson, P. Andersson, and B.-E. Mellander. 2016. Thermal modelling of cell-to-cell fire propagation and cascading thermal runaway failure effects for lithium-ion battery cells and modules using fire walls. J. Electrochem. Soc. 163 (14):A2854–65. doi:10.1149/2.0131614jes.
- Larsson, F., P. Andersson, P. Blomqvist, A. Lorén, and B.-E. Mellander. 2014. Characteristics of lithium-ion batteries during fire tests. J. Power Sourc. 271:414–20. doi:10.1016/j.jpowsour.2014.08.027.
- Larsson, F., P. Andersson, P. Blomqvist, and B.-E. Mellander. 2017. Toxic fluoride gas emissions from lithium-ion battery fires. Sci. Rep. 7 (1):1–13. doi:10.1038/s41598-017-09784-z.
- Larsson, F., P. Andersson, and B. E. Mellander. 2016. Lithium-ion battery aspects on fires in electrified vehicles on the basis of experimental abuse tests. Batteries 2 (2):9–13. doi:10.3390/batteries2020009.
- Larsson, F., and B.-E. Mellander. 2014. Abuse by external heating, overcharge and short circuiting of commercial lithium-ion battery cells. J. Electrochem. Soc. 161 (10):A1611–17. doi:10.1149/2.0311410jes.
- Liu, X., Z. Wu, S. I. Stoliarov, M. Denlinger, A. Masias, and K. Snyder. 2016. Heat release during thermally-induced failure of a lithium ion battery: impact of cathode composition. Fire Saf. J. 85:10–22. doi:10.1016/j.firesaf.2016.08.001.
- Lopez, C. F., J. A. Jeevarajan, and P. P. Mukherjee. 2015. Experimental analysis of thermal runaway and propagation in lithium-ion battery modules. J. Electrochem. Soc. 162 (9):A1905–15. doi:10.1149/2.0921509jes.
- Nedjalkov, A., Meyer, J., Köhring, M., Doering, A., Angelmahr, M., Dahle, S., Sander, A., Fischer, A., Schade, W. 2016. Toxic gas emissions from damaged lithium ion batteries — analysis and safety enhancement solution. Batteries 2 (1):5. doi:10.3390/batteries2010005.
- Ohsaki, T., T. Kishi, T. Kuboki, N. Takami, N. Shimura, Y. Sato, M. Sekino, and A. Satoh. 2005. Overcharge reaction of lithium-ion batteries. J. Power Sourc. 146 (1-2):97–100. doi:10.1016/j.jpowsour.2005.03.105.
- Schindler, W., Haisch, C., Beck, H., Niessner, R., et al. 2004. A photoacoustic sensor system for time resolved quantification of diesel soot emissions. SAE Technical Paper 2004-01-0968. http://papers.sae.org/2004-01-0968/.
- Sturk, D., L. Rosell, P. Blomqvist, and A. Ahlberg Tidblad. 2019. Analysis of Li-ion battery gases vented in an inert atmosphere thermal test chamber. Batteries 5 (3):61. doi:10.3390/batteries50300.
- Wang, X., M. A. Grose, A. Avenido, M. R. Stolzenburg, R. Caldow, B. L. Osmondson, J. C. Chow, and J. G. Watson. 2016. Improvement of engine exhaust particle sizer (EEPS) size distribution measurement - I. Algorithm and applications to compact-shape particles. J. Aerosol Sci. 92:95–108. http://www.sciencedirect.com/science/article/pii/S0021850215001706 (October 12, 2017). doi:10.1016/j.jaerosci.2015.11.002.
- Wang, X., M. A. Grose, R. Caldow, B. L. Osmondson, J. J. Swanson, J. C. Chow, J. G. Watson, D. B. Kittelson, Y. Li, J. Xue, et al. 2016. Improvement of engine exhaust particle sizer (EEPS) Size distribution measurement - II. Engine exhaust particles. J. Aerosol Sci. 92:83–94. doi:10.1016/j.jaerosci.2015.11.003.
- Yokoshima, T., D. Mukoyama, F. Maeda, T. Osaka, K. Takazawa, and S. Egusa. 2019. Operando analysis of thermal runaway in lithium ion battery during nail-penetration test using an X-ray inspection system. J. Electrochem. Soc. 166 (6):A1243–50. doi:10.1149/2.0701906jes.
- Zhang, Y., H. Wang, W. Li, and C. Li. 2019. Quantitative identification of emissions from abused prismatic Ni-rich lithium-ion batteries. eTransportation 2:100031. doi:10.1016/j.etran.2019.100031.
- Zhang, Y., H. Wang, W. Li, C. Li, and M. Ouyang. 2019. Size distribution and elemental composition of vent particles from abused prismatic Ni-rich automotive lithium-ion batteries. J. Stor. Mater. 26 (September):100991. doi:10.1016/j.est.2019.100991.
- Zinigrad, E. L., Larush-Asraf, J. S. Gnanaraj, M. Sprecher, and D. Aurbach. 2005. On the thermal stability of LiPF6. Thermochim. Acta 438 (1-2):184–91. doi:10.1016/j.tca.2005.09.006.