
 ?Mathematical formulae have been encoded as MathML and are displayed in this HTML version using MathJax in order to improve their display. Uncheck the box to turn MathJax off. This feature requires Javascript. Click on a formula to zoom.
Abstract
Inhaled fibers can potentially cause inflammation of the lung tissue and interstitium, which after long-term exposure may lead to lung cancer, malignant mesothelioma, or pulmonary and pleural fibrosis. To reduce the risk and set the appropriate occupational hygiene regulations, it is important to be able to precisely calculate the fate of inhaled fibers depending on their physical characteristics and inhalation conditions. In the absence of experimental data on the real behavior - trajectories, orientation and flipping - of inhaled fibers, a new test rig was assembled for visualization and recording of flowing fibers in a replica of the human trachea and the first bronchial bifurcation. Fibers prepared from commercially produced glass fibers have been processed, dispersed, and introduced into the airway replica. Visualization was performed using a powerful LED light and a high-speed camera. The flow of fibers was evaluated upstream and downstream of the realistic asymmetrical bifurcation and dependence on flow conditions was sought. The fractions of parallelly and perpendicularly flowing fibers were statistically evaluated in three locations. The frequency of flipping was also analyzed. The results show that the parallel orientation of the fibers is less dominant than expected. The fiber orientation tables for various conditions can be used to adjust and improve computational simulations of inhaled fibers in the human airways.
EDITOR:
1. Introduction
Inhaled fibers are recognized as pathogens that can potentially cause inflammation of the lung tissue and interstitium. The pathogenicity of different fibers is not equal and there are many questions about the effects of man-made fibers and nanofibres. Generally speaking, inhalation of fibers can lead to numerous adverse responses in the body, where the specific reactions depend on the duration and intensity of exposure and the nature of the fibers (their geometry and biopersistenceFootnote1). Evidence reported e.g. in (Donaldson et al. Citation2010) shows that toxicity strongly depends on the fiber dimension and less on its chemical composition.
Inhaled fibers tend to avoid the most efficient mechanism of pulmonary clearance, i.e. the slow upward movement of deposited particles, along with mucus driven by the synchronized motion of cilia, which transports the fibers to the throat and digestive system (Donaldson et al. Citation2013). Some of the inhaled fibers penetrate and deposit beyond the ciliated airways, which after long-term exposure may lead to pulmonary and pleural fibrosis, i.e. a diffuse accumulation of fibrous/scar tissue in the interstitium of the lung or pleura. Pulmonary fibrosis impairs the diffusion of gases from the blood into the air spaces and limits lung expansion. Pleural fibrosis may lead to pleural effusion - an accumulation of fluid in the pleural cavity. It can also lead to asbestosis, pleural plaques, bronchogenic carcinoma (cancer of the cells lining the bronchi or airways. It is the same as the lung cancer that is common in smokers) or malignant mesothelioma (an unusual tumor arising from the mesothelium lining the pleural space that is slow-growing and that does not metastasize and is therefore well-advanced before diagnosis, which subsequently leads to a very poor prognosis) (Donaldson et al. Citation2013).
Fibers can provoke an inflammatory reaction, but they can also directly trigger certain chemical processes. Acute or chronic inflammation is associated with oxidative stress, and the production and release of mediators, such as lysosomal enzymes. The body reaction involves also production of intermediates of arachidonic acid, glutathione S-transferases, proteases, cytokines, growth factors, reactive oxygen species (hydrogen peroxide, superoxide anion, hydroxyl radical) from pulmonary macrophages, neutrophils, and other inflammatory cells. Reactive oxygen species can also be produced in cell-free systems - as a direct chemical reaction between fiber surface and extracellular fluids (Osinubi, Gochfeld, and Kipen Citation2000). Fibers stimulate the proliferation (rapid reproduction) of epithelial or mesothelial cells and simultaneously, during inflammation, some chemical mediators attract fibroblastsFootnote2, which deposits in the lung parenchyma in the area of the irritating fiber. Fibers and mediators of the inflammatory reaction can also damage DNA (genotoxic effect). The pathobiological processes can culminate in the formation of fibrous tissue, which normally occurs during wound healing (fibroplasia), and abnormal (benign or malignant) tissue growth.
The reason the fibers manage to pass to the lower parts of the airways is the fact that their aerodynamic diameter dae can be very small although their length can reach 30 or 50 µm. The equation that can be used for calculation of the dae (for cylindrical fiber) was derived by Griffiths and Vaughan (Citation1986):
(1)
(1)
where df is the physical diameter of the fiber, ρf is the fiber density, ρ0 is the density of water (standard density), βa is the aspect ratio, i.e. the ratio of the length to the diameter of the fiber, and χ is the dynamic shape factor, which is defined as the ratio of the drag force on a non-spherical particle (in our case a fiber) and the drag force of a volume-equivalent sphere.
A troublesome situation is induced by the dynamic shape factor. Its value depends on the direction of the fiber motion with respect to the major axis of the fiber. Fuchs (Citation1964) presented two equations, for parallel and perpendicular motion, respectively:
(2)
(2)
(3)
(3)
In the cases where a random orientation of fibers can be expected, the following formula for the resulting dynamic shape factor is recommended (Kulkarni, Baron, and Willeke Citation2011; page 511):
(4)
(4)
Several papers (e.g. Balashazy et al. Citation2005; Mossman et al. Citation2011; Shachar-Berman et al. Citation2019) suggest that fiber alignment with the flow streamlines plays a crucial role for deposition in human lungs and that there is a tendency of symmetrical fibers to align with the tube axis. Hence, parallel orientation can be expected to be preferential in human airways, at least in locations with laminar flow. On the other hand, Kulkarni, Baron, and Willeke (Citation2011), page 528, points out that the perpendicular orientation is dominant during gravitational settling and acceleration for particle Reynolds numbers 0.01 < Rep < 100, and that fiber motion is often treated as a combination of these two cases. In short, there is no general rule that would predict the number of fibers with parallel and perpendicular orientation as a simple function of flow and fiber characteristics. It should be noted that this information is missing in models for prediction of deposition sites of inhaled fibers (Farkas et al. Citation2019). To improve the accuracy of such models, it is necessary to supplement them with precise data on the orientation of fibers.
Despite the commonly shared notion (Kiasadegh et al. Citation2020; Shanley and Ahmadi Citation2011; Zhang et al. Citation1996) that inhaled fibers travel with their main axis aligned with the direction of the flow, the calculations of Tian and Ahmadi (Citation2013) and also our preliminary experiments (Lizal et al. Citation2020a) have shown that every bifurcation induces a sudden rotation (flip) of a significant portion of fibers in the perpendicular orientation to the streamlines. Further evidence that will elucidate what factors affect those flips is needed.
In general, three approaches are being used for the calculation of the flow of fibers. The first one is an application of an equivalent spherical particle with a constant shape factor accounting for the deviation of elongated particle from the ideal sphere. However, this method does not solve the interaction between fluid and fiber correctly (van Wachem et al. Citation2015) and hence should not be used for precise calculations in airways.
The second approach evaluates the position, rotation, and velocity of each fiber while considering the orientation and moment of inertia of each fiber. This can be resolved by the discrete element method. The complexity of this approach stems from the interaction of a fiber with a fluid. In a uniform flow a sphere experiences only a drag force, whereas fiber is also affected by a transverse lift force, a pitching torque and a counter-rotational torque. Besides, all these forces depend not only on the Reynolds number but also on the angle between the axes of the fiber and the direction of the flow. Moreover, the framework for describing collisions requires a different approach compared to the one used for perfect spheres, because the orientation of the particle must be taken into account (van Wachem et al. Citation2015).
Analytical solutions for calculations of forces and torques were introduced for low Reynolds numbers (below unity) and prolate ellipsoids by Brenner (Citation1963) and Jeffery (Citation1922), respectively. Real fibers can be frequently modeled also as oblate ellipsoids or cylindrical fibers. The substitution for these ideal shapes simplifies the solution for higher Reynolds numbers. Determination of the drag force is based on the calculation of the drag coefficient. Many correlations were proposed to calculate it precisely. Their list was given in Zastawny et al. (Citation2012).
A non-symmetric flow field creates a lift force on a fiber not aligned with the flow. Its value can be calculated based on the lift coefficient, which can be determined e.g. from equation proposed by Mando and Rosendahl (Citation2010). The same authors proposed also formulas for calculation of a pitching torque coefficient. The pitching torque is created when the center of pressure of the total aerodynamic force acting on the fiber does not coincide with the center of mass. Rotation of fiber can be generated due to the pitching torque and also by collisions with walls and suspended particles. Rotation torque for rotations around the axis of symmetry and around the axis perpendicular to the axis of symmetry can be calculated using coefficients given by Zastawny et al. (Citation2012), however, they were calculated for axisymmetric particles in a uniform flow.
To conclude, the calculations following the second approach are extremely computationally demanding, especially in complex turbulent flows.
A compromise and affordable approach is using empirical correlations to modify the drag coefficient on a sphere. Such calculation does not pursue accurate calculation of all forces, however, may deliver sufficiently precise results, providing the determination of drag coefficients is properly addressed (Inthavong et al. Citation2008). The ultimate goal of our work is to provide the ratio of orientations of fibers that may be used for imposing the appropriate drag coefficients. This article presents data for steady conditions and centers of tubes.
A new experimental rig has been assembled to allow visualization of the flow of micrometre-sized glass fibers originating from commercially produced glass wool, which is routinely applied for blown thermal insulation of buildings. The test rig and results of the visualization performed on a replica of the human trachea and the first airway bifurcation are described in this article. First, the visualization of the fibers in a plain glass tube was performed and evaluated. Then the same tube was supplemented with a replica of the bifurcation and the visualization was performed upstream and downstream of the bifurcation in two observation planes in the center of the respective airways. The results were statistically evaluated and the geometrical configurations of inhaled fibers under various conditions were analyzed. The answers to the following questions were sought. Do fibers with a parallel orientation really prevail? Do they prevail in all locations and under all conditions? Does the fraction of parallelly and perpendicularly oriented fibers change with Reynolds number? Does the fraction change as a result of the flow through the bifurcation? What is the effect of the physiological asymmetry of the bifurcation on the fibers? Are the perpendicular fibers rotated randomly in the plane perpendicular to the streamlines?
Answers to the above-mentioned questions will help us to improve the understanding of the motion of inhaled fibers and to improve the computational models. The ability to predict localized concentrations of inhaled toxic fibers will provide decision-makers with critical information to protect the safety of workers and residents (Shanley et al. Citation2018).
2. Materials and Methods
2.1. Preparation and characterization of fibers
The glass wool Supafil® Loft (Knauf Insulation GmbH, Simbach am Inn, Germany) was used as a source of fibers. A method for preparation of single fibers was similar to Wang et al. (Citation2008; Citation2005) and our previous study (Belka et al. Citation2016). The wool has been disintegrated in a mechanical press to produce separate fibers. The resulting fibers were rigid and mostly straight (see Figure S5 in the supplement). Dimensions of fibers were measured by phase-contrast microscopy using Walton-Beckett graticule prior to mixing and dispersing. The diameter of fibers was 3.8 ± 1.4 µm and the length was 34.1 ± 19.0 µm. Then they were mixed with glass beads (Ballotini impact glass beads, Potters Industries Inc., Valley Forge, PA, USA) and sieved to deagglomerate the fibers and produce a homogenous mixture suitable for dispersing the fibers. Fiber length was also checked after dispersing. The fibers were collected downstream of a charge neutralizer. Their length changed to 37.1 ± 20.9 µm after aerosolization and introduction to the rig. The room air temperature during experiments was 20 to 21 °C; hence the kinematic viscosity used for calculation of Reynolds number was 1.5 × 10⁻⁵ m2/s, and density was 1.21 kg/m3. The density of glass is approximately 2500 kg/m3.
2.2. The experimental rig
The experimental rig (see ) consisted of a reservoir of the mixture of glass beads and fibers (a hopper), a rotary feeder that provided a continuous supply of the mixture to a fluidized bed disperser created from an orbital shaker Wisd NM-10 (Witeg Labortechnik GmbH, Wertheim, Germany) with an extension of our design. Fibers were charge equilibrated by 85Kr neutralizer NEKR-10 (Eckert & Ziegler CESIO, Prague, the Czech Republic). The fibers then flowed through a 1.5 m long glass tube to ensure the developed flow and were visualized by a high-speed camera. The tube was always in a horizontal position. The diameter of the tube was 15 mm, which approximately corresponds to the diameter of the trachea (Lewis et al. Citation2005). The tube was then supplemented with a 3D printed replica of the first airway bifurcation.
Figure 1. A scheme of the experimental rig for visualization of the flow of glass fibers in a replica of the human trachea and the first bifurcation.
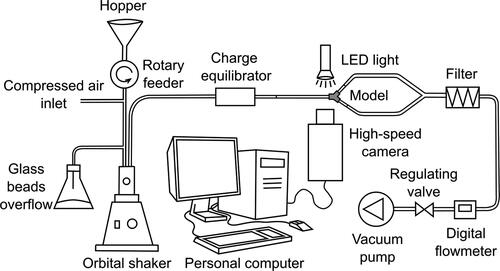
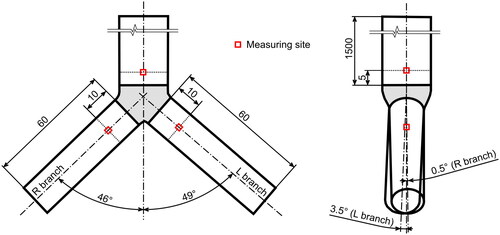
The angles of branching and diameters of the daughter tubes were identical with the semi-realistic geometry described in Lizal et al. (Citation2012); see also . The complex asymmetrical shape of the bifurcation extracted from the original CT of a healthy human male was preserved. Since the current experiment aimed solely on the influence of a single bifurcation, care was taken to ensure identical conditions downstream of the daughter branches. For this reason, both daughter branches were created from tubes of identical length and diameter. The asymmetry of the 3D printed bifurcation had negligible effect on the flowrate distribution between the branches. The flowrate was measured with a digital flowmeter TSI 4040 (TSI, Shoreview, Minnesota, USA), and the differences between the branches were within the measurement error of the instrument. The camera was always focused on the main axis of the tube and aligned in such a way that the main axis was positioned horizontally in the images. The flow was induced by a vacuum pump (Busch PA0008C, Busch Vakuum s.r.o., Brno, the Czech Republic).
Figure 2. A visualization of the replica of the first bifurcation with indication of the measuring cross-sections.
A high-speed camera Photron SA-Z was used to inspect the fiber flow inside the glass tubes. The long-range microscope lens 12X Zoom (NAVITAR, New York, USA) composed of 2X F-mount adapter (type 1-62922) and 12 mm F.F zoom lens (type 1-50486) provided images with a spatial resolution of 1.5 μm per pixel. The maximal dimensions of the image were 1.5 × 1.5 mm for 1024 × 1024 px. The depth of field was approx. 0.1 mm. The flow was illuminated by a pulse LED light model HPLS-36DD18B (Lightspeed Technologies, USA). Since a wide range of flow rates was used, the camera resolution and frame rate were changed in accordance with . Similarly, the light pulse duration varied in a range from 400-800 ns.
Table 1. An overview of the camera and light settings for all measured flowrates.
The flowrates were selected to cover the range from laminar to turbulent flow (). The maximum flowrate was limited by the technical properties of the camera and light; the minimum flowrate was limited by the low concentration of fibers. The following cases were measured: First, a simple straight tube 20 mm upstream of the end of the tube. Second, the same tube extended by the bifurcation measured 5 mm upstream of the bifurcation. Third, in the left main bronchus 10 mm downstream of the bifurcation and fourth, in the right main bronchus 10 mm downstream of the bifurcation (for indication of the measuring sites see . A file with an exact digital copy of the geometry suitable for numerical simulations can be found as a supplemental file). All the above mentioned measurements were performed in the axis of the respective tube. Measurement at each point was performed in two planes: in the coronal plane (left-right direction, when the camera was positioned in the front of the model) and in the sagittal plane (front-back direction, when the camera was observing the model from the side). At least two recordings were performed for each setting. A sample of the raw recording can be found in the supplementary data (fibers_flow.avi).
Table 2. Results of the measurement and statistical analysis in the center of simple straight tube, center of a tube with bifurcation and in the position 0.6R from the center of a tube with bifurcation.
To acquire a notion about the differences that can be expected in off-axis regions, an additional measurement was performed in the position 0.6R from the center of a tube upstream of the bifurcation. This location has been selected because Segré–Silberberg’s theory (Segre and Silberberg Citation1961) predicts an accumulation of particles there during laminar flow.
The fibers appearing as horizontal in the images are parallel to the flow, the fibers recorded as vertical are perpendicular to the flow streamlines. Only fibers with either a horizontal or vertical orientation were observed (in other words, as expected, there were no fibers with an orientation different from simply parallel or perpendicular – except for the instants of flipping).
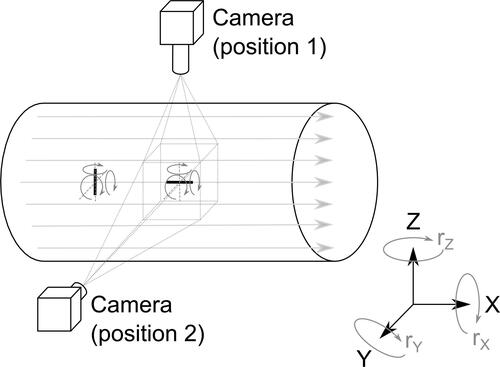
Just one configuration of a parallel orientation of fiber to the streamlines was expected and observed (the current setup naturally cannot resolve a possible rotation of the fiber about its main axis, see ). On the contrary, the perpendicular fiber can be in any random orientation in the plane perpendicular to the streamline. As only a single camera was used, the only effect the rotation of the fiber in the plane perpendicular to the streamline (and at the same time perpendicular to the observation plane) would have is changing the length of the fiber in the image. In a limiting case, the perpendicular fiber might appear as a “dot” with the size of the fiber diameter. Such fibers were indeed observed, but they had to be excluded from the evaluation as such objects do not fulfill the criteria of fiber (length to diameter ratio at least 3) and thus cannot be distinguished from any other non-fibrous particles. The number of all such objects was less than 3% of the total number of fibers, and hence their neglection did not compromise the statistics.
Figure 3. An illustration of possible rotations of fibers parallel and perpendicular to the streamlines. Rotation (rolling) of both fibers about the main axis cannot be registered by the current system. The rotation of the parallel fiber about axes z and y could be easily recognized directly from the images, but the rotation of the perpendicular fiber about the axis x cannot be recognized from a single camera recording. Such a rotating fiber would appear shorter, but as the true length of that specific fiber is not known, no conclusions can be drawn from the observation of a single fiber. Statistical analysis was used to reveal whether the fiber lengths differed in the two observation planes, which would indicate a possible preferential rotation of the perpendicular fibers.
In the above text, we use the usual convention of linking the parallel or perpendicular orientation with streamlines. In our case, however, the actual information about the streamlines was not available. Therefore, during our evaluation, the orientation of the fiber was related to the image frame (which, as noted above, was aligned with the axis of the respective airway tube).
2.3. The image processing software
The high-speed camera recordings were analyzed by an in-house software Fiber Analyzer. It is a second generation of the software which was originally developed for automated counting of fibers deposited on filters photographed with a phase-contrast microscope. A full description of the original version was given in (Belka et al. Citation2016; Štarha et al. Citation2013). In brief, the analysis proceeded with the following sequence of steps. First, the contrast between fibers and background was enhanced by the Adaptive Contrast Control method. It calculated an equalization function using values of pixel brightness in the neighborhood of each pixel. An adaptive radial convolution filter was then applied. It differs from the classic radial convolution filter which would suppress both additive noise and fiber edges, thus leading to distorted fiber detection during thresholding. Therefore, the adaptive filter applied a weight function which caused the radial filter to prefer certain directions more than others. The direction of fiber edges was recognized using a stochastic approach. In the next step, the objects captured in the images were detected by thresholding. Consequently, the fibers were classified based on their shape characteristics described by moment invariants. All non-fibrous objects were excluded from the selection. Finally, the fibers were transformed into digital lines, and dimensional characteristics of each detected fiber were stored.
The original software has been adapted for application on high-speed camera images. Its latest version uses a modified method of obtaining a calibration image for correction of the background inhomogeneity. This process is essential because a high-speed camera uses a very short exposure time. For this reason, the images contain a large amount of additive noise and the signal-to-noise ratio is very low. The original method for increasing the contrast of observed objects and subsequent filtering of additive noise (Štarha et al. Citation2013) sufficiently suppresses the background inhomogeneity. However, it is extremely time-consuming and hence not suitable for series of ten thousands of images produced by a high-speed camera. It also enhances the image noise.
In order to prevent the generation of additive noise in the processed images, it was necessary to prepare a calibration image of the background inhomogeneity with the lowest possible noise level. The background inhomogeneity correction is based on the application of a flat field image. It is a background image without an object (in common situations created from images either before or after observing the object). In our case, however, the background properties change over timeFootnote3, which significantly complicates the calibration. Therefore, the flat field image must be created from images containing the observed objects.
Because the observed objects move, it is possible to obtain the flat field image from adjacent images of the analyzed image. Let’s assume that the analyzed image is number 17. Then images number 1-8 and 26-33 are used for flat field image preparation. Images number 9-16 and 18-25 cannot be used because pixels containing the fibers overlap and that would create an unwanted trace of fibers in the resulting flat field. At first the part of the image that is free of the observed objects must be segmented. For this purpose, an auxiliary median image is calculated for each source image. The motivation for using the median grounds from the fact that additive noise is expected to have Gaussian probability distribution N(0, σ2), and the median is more robust to deviated pixel values than the mean. The median image is subtracted from each source image and the subsequent segmentation is performed by thresholding. The so conditioned images are then used for the flat field image preparation. The algorithm proceeds by pixels and for each calculates the arithmetic mean of all the respective pixels that do not contain the observed object in the available source images. The resulting pixels of the flat field image are created from a different number of source pixels. However, if a sufficient number of source images are available and the observed object moves fast, this fact does not significantly influence the resulting background image.
When the calibrated flat field image is finally available, it is possible to use the standard image processing tools, i.e. fiber identification and subsequent object analysis.
The fiber characteristics that were extracted from the recordings by the Fiber Analyzer software and evaluated were: orientation of the fibers at the inlet and outlet, trajectories, coordinates, flip directions (parallel to perpendicular orientation, or vice versa), and fiber lengths.
3. Formulations of statistical hypotheses
Since the concentrations of fibers in the visualization window was varying for different locations and boundary conditions, and also in time, it was useful to employ statistical tools to evaluate the frequency and coherence of the observed phenomena and their statistical significance. The following statistical hypotheses were formulated to answer the questions raised in the Introduction.
3.1. The statistical test applied to the fibers in the straight tube
As mentioned above, several publications on the deposition of fibrous aerosols in human lungs (Balashazy et al. Citation2005; Mossman et al. Citation2011; Shachar-Berman et al. Citation2019) state that the fibers penetrate deep into the alveoli due to their ability to align with the flow streamlines. Therefore, it seems logical to formulate a hypothesis that more than 50% of inhaled fibers are oriented parallel to the streamlines. The following statistic was used to test the hypothesis. The analysis was first performed in the simplest cases - a plain tube without and with the bifurcation.
3.1.1. Prevailing orientation of fibers in the straight tube and the trachea upstream of the bifurcation (test 1)
The random variable X describing the number of parallelly oriented fibers is expected to have Bernoulli distribution Bernoulli (p), where the parameter p is the probability of parallel fiber orientation. The null hypothesis H0: p ≥ 0.5, i.e. Parallelly to perpendicularly oriented fibers ratio is higher than 1:1, is tested at the significance level α = 0.05. The following test statistic is used.
(5)
(5)
T1 is the value of the test statistic, and n is the total amount of measured fibers. For the given significance level α, a test interval is and if
the null hypothesis is not rejected.
3.2. Statistical tests applied on the fibers in the airway replica
3.2.1. Evaluation of prevailing parallel orientation among fibers incoming and leaving the visualization region (test 2)
The second test was performed at recordings downstream of the bifurcation (the reason is that there were no differences in orientation of incoming and outgoing fibers upstream of the bifurcation). In agreement with the observation of the fibers, where again only the parallel with the streamlines (in images appearing as horizontal) or perpendicular (i.e. vertical) orientation had been recorded, a Bernoulli distribution was assumed again. The second test uses the same test statistics T2 = T1 and the same null hypothesis. The complement of the critical region is i.e. again
If
then the hypothesis is not rejected at the significance level α.
A different test was used to check the hypothesis that the fibers switch from a perpendicular to parallel orientation within the measuring window downstream of the bifurcation.
3.2.2. A difference in the fraction of horizontally oriented fibers between the inlet and outlet of the measuring window (test 3)
Either the test of equality of at the inlet and outlet could have been performed, or (which we assumed to be a better idea)
at the inlet and outlet could be compared to confirm the tendency of fibers to orient in a specific direction.
As in the previous tests, let us assume that fibers at the inlet (X) and outlet (Y) are both random samples from Bernoulli distribution, i.e. as only two types of orientation (parallel or perpendicular) are possible. As the previous test rejected the null hypothesis about predominant parallel orientation at the inlet in the right main bronchus and did not reject the same hypothesis at the outlet, the following hypothesis is tested for all regimes: the fraction of parallelly oriented fibers at the inlet is higher than at the outlet. The corresponding test statistic is used:
where
are sample means, i.e.
and
where x and y are the numbers of parallelly oriented fibers at the inlet and outlet, respectively. In our case,
because there is the same total number of fibers at the inlet and outlet.
For the hypothesis the complement of the critical region is
i.e.
A condition of
was satisfied for all regimes except one (only 36 fibers were recorded there).
3.2.3. Statistical significance of the differences between the fractions of parallelly oriented fibers at the inlet and outlet (test 4)
To gain even stronger evidence that fibers indeed switch from perpendicular to parallel orientations downstream of the bifurcation, an additional test was prepared to verify that the differences in numbers of parallelly oriented fibers at the inlet and outlet are statistically significant.
The fourth test is similar to the previous one: it uses the same test statistics T4 = T3, but a different null hypothesis has been formulated. Let the null hypothesis be or in other words, that the fractions of parallelly oriented fibers at the outlet and inlet are identical. The alternative hypothesis is then
In the case of rejection of the null hypothesis, we will not only get the information that the fractions are not equal but also that their difference is statistically significant. The complement of the critical region is
i.e.
If
then the null hypothesis is not rejected at the significance level α = 0.05.
3.2.4. Orientation of the perpendicular fibers rotated in the plane perpendicular to the streamlines (test 5)
The fifth test is based on the assumption that the possible rotation of a fiber appearing as perpendicular in the plane perpendicular to the streamlines would result in a change of the length of such fiber in the image. As already mentioned, the maximum length would correspond to the fiber perpendicular to the camera and would decrease as the fiber rotates along the streamline (see ).
It should be noted that the length of the fiber extracted from the images cannot be automatically accepted as equivalent to the actual length of the fiber. The reason is that some fibers were slightly out of focus but still within the depth of field. The same fiber positioned either in the optimal focus or slightly out of it would produce somewhat different length after the image processing and evaluation. Nonetheless, considering that there were hundreds of fibers recorded, we assumed that comparison of median lengths would be reasonable, as the distribution of positions of fibers within the depth of field should be the same for all cases.
Since the probability distribution of orientation of perpendicular fibers in the plane perpendicular to the streamlines is not known and we can only assume that it is to some extent random, a nonparametric test of medians is required. Mann Whitney U Test (known also as Wilcoxon Rank Sum Test) seems to be a suitable tool. To acquire information on the possible rotation of perpendicular fibers, lengths of parallel and perpendicular fibers were compared within a single plane. This analysis presumes that the parallel and perpendicular fibers have the same actual length. The test was performed at first on the aggregated data in coronal and sagittal planes, and consequently on the separate locations.
4. Results and discussion
The recordings confirmed that, in agreement with expectations, only parallel or perpendicular fibers were present within the whole range of flow Reynolds (190 to 4500) and particle Reynolds numbers (0.08 to 1.81) in all locations. No flips from parallel to perpendicular orientation or vice versa were observed in the straight tube and the tube upstream of the bifurcation. Fibers with parallel orientation slightly prevailed there, and this condition seemed to be more frequent in the tube supplemented with the bifurcation (in comparison with the simple straight tube). The trajectories were straight lines with rare intersections.
On the contrary, many flips from parallel to perpendicular orientation were observed downstream of the bifurcation. The bifurcation obviously induced a change in the fraction of parallelly and perpendicularly oriented fibers. Significant differences were found between the left and right main bronchus, as a result of the physiological asymmetry of its shape, although the diameter and length of the daughter branches were identical. Yet, the differences in the shapes and branching angles of the left and right side of the 3D printed realistic bifurcation (see and the STEP geometry in the supplement) resulted in noticeable differences between the daughter branches. There were frequent intersections of trajectories and a combination of straight and curved courses was recorded.
4.1. Fibers in the straight tube and the trachea upstream of the bifurcation– prevailing orientation of fibers (test 1)
The above-mentioned test statistics T1 was evaluated for varying flow rates. The condition of having at least 30 recorded fibers (n ≥ 30) was valid for all studied cases. The following tables present the data and results of the statistical analysis for measurements in the simple straight tube and the tube upstream of a bifurcation and in the position 0.6R from the center of a tube with bifurcation ().
The column with values of the T1 test statistics shows that the null hypothesis (that there is more than 50% of parallelly oriented fibers) for any of the given flow rates in the simple straight tube could not be rejected at the significance level α.
Similarly, even for the straight tube equipped with the bifurcation (simulation of the trachea), the null hypothesis was not rejected (see ). The parallel orientation seems to be slightly more frequent (it is confirmed by the higher value of the test statistics T1) compared to the simple straight tube.
The null hypothesis was not rejected for any of the flow rates also in the position 0.6R from the center of a tube with bifurcation. Fluctuation of values among flow rates in this point indicates that the flow of fibers is less stable in off-axis regions.
In short, the results of the first test mean that the hypothesis about prevailing parallel fibers might be valid, nonetheless, the parallel orientation is less dominant than expected.
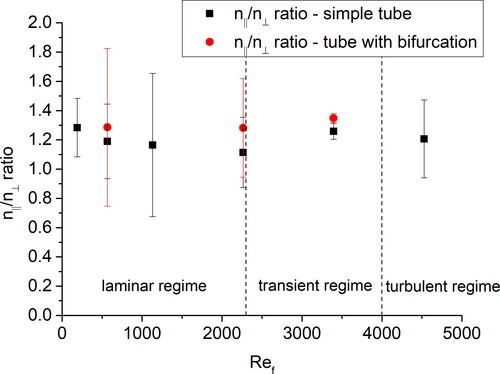
Consequently, the ratio of the number of parallelly and perpendicularly oriented fibers (nǁ/n⟂ ratio) was calculated for each flowrate and plotted against the flow Reynolds number (see ). There was no significant influence of the flow Reynolds number within the measured range on the orientation of the fibers (the possible tendency of nǁ/n⟂ ratio to decrease in the laminar regime is within the standard deviations). also may be interpreted in the way that the parallel orientation might be more frequent in the tube with the bifurcation. However, the differences were within standard deviations, and hence statistically insignificant for the current dataset.
Figure 4. The ratio of parallelly and vertically oriented fibers as a function of the flow Reynolds number. The error bars represent standard deviations.
4.2. Statistical tests applied on the fibers in the airway replica
4.2.1. Prevailing parallel orientation among fibers incoming and leaving the visualization region (test 2)
The second test was first applied separately for each camera view and regime (). The null hypothesis was rejected only in the right main bronchus and mostly only in the sagittal plane of observation. Consequently, the data for both views for the same regime were aggregated and the test was repeated for the aggregated datasets (see ). The results showed that perpendicular orientation prevailed at the inlet of the measuring plane in the right main bronchus. In all other cases, parallel orientation was more frequent.
Table 3. Results of the statistical test on the prevalence of parallel fibers at the inlet and outlet of the measuring window (T2), on the difference in the fraction of parallelly oriented fibers between the inlet and outlet of the measuring window (T3), and on differences between the fractions of parallelly oriented fibers at the inlet and outlet (T4). Calculated at separated locations, flowrates and views.
Table 4. Results of the statistical test on the prevalence of parallel fibers at the inlet and outlet of the measuring window (T2), on the difference in the fraction of parallelly oriented fibers between the inlet and outlet of the measuring window (T3), and on differences between the fractions parallelly oriented fibers at the inlet and outlet (T4) – aggregated views.
The second test suggests that the bifurcation indeed causes flipping of significant number of fibers into orientation perpendicular to the streamlines. It should be noted that the location of the measuring window downstream of the bifurcation was not motivated by an effort to target the location where parallel fibers would dominate again. Presumably, the fibers had been flipping all the way down from the bifurcation. It would be beneficial to have a more detailed mapping of the whole path and to describe the process in greater detail; nonetheless, even the data acquired in a single observation window in each daughter branch yield interesting results. The previous test examined whether the parallel fibers dominate at the inlet and outlet of the measuring window. However, in order to test the hypothesis that the fibers indeed switch to a parallel orientation within the measuring window downstream of the bifurcation, a new test statistic had to be established.
4.2.2. Test 3 - A difference in the fraction of parallelly oriented fibers between the inlet and outlet of the measuring window
As can be seen from and , the third test supported our expectation that there probably is a tendency of fibers to change from the perpendicular to parallel orientation, i.e. from perpendicular to parallel to the flow. That tendency does not depend on the number of fibers at the inlet, flowrate or branch (left or right main bronchus). This statement is based on the fact that the null hypothesis was not rejected for any of the regimes. However, to prove that the tendency was not caused by accidental factors, and to gain even stronger evidence, the fourth test was prepared to verify that the differences in numbers of parallelly oriented fibers at the inlet and outlet are statistically significant.
4.2.3. Test 4 – Statistical significance of the differences between the fractions of parallelly oriented fibers at the inlet and outlet
shows also that the fraction of parallelly oriented fibers increased. However, the difference was not statistically significant in most of the regimes (the null hypothesis was not rejected). The four rejections in the right main bronchus suggested that there had been a difference between the branches. This was further supported by the aggregated data (), where data for both observation planes for the same location and regimes had been summed. We can conclude that fibers in the right main bronchus have a strong tendency to switch from perpendicular to parallel orientation. We cannot assert that the same does not happen in the left bronchus - test 3 proved it does happen, but the changes are so slow that they are not statistically significant.
4.2.4. Orientation of the perpendicular fibers rotated in the plane perpendicular to the streamlines (test 5)
4.2.4.1. Length of parallel and perpendicular fibers in the coronal planes
The median of the length of perpendicular fibers in the coronal plane was 29.54 px, the median of the length of parallel fiber was 29.46 px and the p-value of the Mann Whitney U Test was p = 0.06, hence p > α and the null hypothesis was not rejected. It suggests that most of the perpendicular fibers are rotated perpendicularly to the camera.
4.2.4.2. Length of parallel and perpendicular fibers in the sagittal planes
The medians of the length of fibers in the sagittal plane were 23.21 px and 24.47 px for perpendicular and parallel fibers, respectively. In this case, the p-value of the Mann Whitney U Test was p = 0.04, hence p < α, and hence the null hypothesis about equality of lengths was rejected at the significance level α = 0.05. This result might be interpreted as an indication that the perpendicular fibers do tend to rotate and align to the coronal plane preferentially.
The current test was performed at first on aggregated fibers from all locations and all regimes. It seems logical to expect that the alignment of perpendicular fibers depends on the location, therefore a more detailed test was performed for each measuring location. The results are summarized in .
Table 5. Results of the statistical test on the equality of the length of the fibers with parallel and perpendicular orientation - separated locations, and views.
4.2.4.3. Evaluation of the length of parallel and perpendicular fibers in separate locations
Only the sagittal plane had been recorded in the simple tube without the bifurcation and in the tube upstream of the bifurcation. When these two cases were compared, the null hypothesis was not rejected in the former case, but was rejected in the latter case (see ). This suggests that the attachment of the bifurcation caused the fibers to be preferentially aligned into the coronal plane. In other words, it seems that the fibers flowing parallel to the streamlines tend to rotate to the plane of the bifurcation. The results in both daughter branches were similar. There was negligible difference in the lengths of parallel and perpendicular fibers in coronal planes (the null hypothesis had not been rejected), while significant difference was found in sagittal planes (rejection of the null hypothesis). Surprisingly, however, the perpendicular fibers were longer than the parallel ones. Obviously, our original assumption that perpendicular fibers would always be shorter than parallel ones is not valid there. One possible explanation may be that because the camera was aligned with the axis of the tube (and not the streamlines), the actual plane in which the fibers flew was different from the plane of visualization. Such inclination of fibers would influence the apparent length of the parallel fibers more than the length of perpendicular fibers. In a limiting case it would be possible for the fiber flow plane to cross the visualization plane to such an extent that a notable number of fibers would come out of the depth field and some fibers would appear and disappear within the imaged plane. Such disappearing fibers were indeed observed in the right branch (see the trajectories in ).
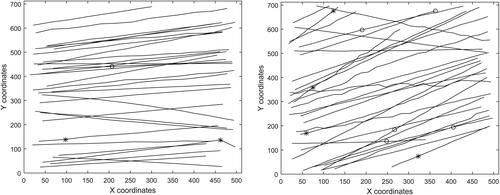
Figure 5. Trajectories of fibers for Reynolds number of 3400 in the left and right main bronchus, respectively, in the coronal plane. The asterisks denote flip from perpendicular to parallel orientation, the circles the opposite flip.
The second possible explanation - by a rotation of parallel fibers about axes y and z (see ) was immediately ruled out, as it was not observed in either plane. A third explanation might be that optical distortions caused by the cylindrical glass wall of the tube caused polarization effects that might have affected the parallel and perpendicular fibers differently. Nonetheless, this hypothesis fails to explain why such an effect would be apparent only in the sagittal and not in the coronal plane.
In summary, the Mann Whitney U test revealed statistically significant differences between the length of the perpendicular and parallel fibers in sagittal planes. This does not necessarily mean that there is an inclination of the fibers flowing perpendicular to the streamlines to turn into the coronal plane, but this hypothesis remains sound. It is obvious that some other effects were involved, and hence it is important to perform additional tests to reveal the true nature of the observed events.
4.2.4.4. Flipping of fibers
An interesting insight into the nature of the flow of fibers through a bifurcation brings displaying a number of flips in the daughter branches. A flip is defined as a rapid switch of fiber from the perpendicular to parallel orientation or vice versa. In one case a 180° flip from perpendicular to perpendicular orientation within the visualization window was observed. No 180° flip from parallel to parallel orientation was recorded. Obviously, there were significantly more flips from perpendicular to parallel orientation (which had already been proved by the above presented statistical analysis). Flips from parallel to perpendicular orientation were observed only for higher Reynolds numbers. There was a notable difference between the left and right daughter branches in the case of perpendicular to parallel flips. In the right branch in both visualization planes, these flips were more frequent for low Reynolds numbers. On the contrary, a much lower number of flips was observed and the dependence on Reynolds number was not clear in the left branch. The last two columns in show the ratio of the number of parallel and perpendicular fibers. The term “inlet” here means the instant of the first detection of a fiber in the recording and “outlet” the last detection of the same fiber. It should be noted that the last two columns originate from the automated tracking algorithm, but the flips were detected manually by the operator. The automated detection always tracked at least 60 fibers for each regime. The number of manually recorded fibers is in the table. Finally, it should be emphasized that not all fibers were tracked over the whole length of the visualization window. Some fibers appeared later or disappeared earlier (they entered the visualization area later or left earlier due to the difference between the angles of the tube main axis and the flow streamlines), as can be seen from the tracked trajectories in .
Table 6. Overview of flips observed in all measured locations and views.
shows the tracked trajectories from a single recording at flow Reynolds number of 3400 in the left and right main bronchus, respectively, in the coronal plane (the remaining trajectories can be found in the supplement). The asterisks denote flip from perpendicular to parallel orientation, the circles the opposite flip. It is obvious that the flow in the right main bronchus is more turbulent than in the left. The trajectories upstream of the bifurcation were simple straight lines with no flips.
It is known that especially the area on the right main bronchus represents a challenge even for numerical simulations of flow, because of the high kinetic energy between the separated shear layer and the recirculation zone (Koullapis et al. Citation2018). The asymmetry of first airway bifurcation and its influence on the flow in right main bronchus was observed also by Banko et al. (Banko et al. Citation2015) or Grosse (Große et al. Citation2007). The fibers are influenced by the unstable flow and some of them are carried away which results in variable trajectories. It should be kept in mind that both figures show a “condensed” view of trajectories that were recorded in a longer time range. The appearance of fiber in the high-speed camera recording is a relatively rare occasion. Therefore the flow field changes in the meantime before the next fiber enters the same area and hence the new fiber follows a different trajectory.
4.3. Limitations of the study
In this study, we tried to clearly define the boundary conditions to facilitate simulation of the identical conditions by computational fluid dynamics (CFD). For this reason, the 1.5 m long glass tube was used as an entrance section to ensure a fully developed flow. Nonetheless, the upper airways and glottis are known to generate turbulent fluctuations that persist to the end of the trachea and induce turbulent flow, although the flow Reynolds number is below the critical value (Lizal et al. Citation2020b). Our current results need to be supplemented with a follow-up study which will include the upper airways effects. Similarly, more detailed spatial mapping needs to be performed especially downstream of the bifurcation. Close attention should be paid to the near-wall area and the effects of the boundary layer. Currently, the effects of realistic inhalation patterns are being studied and the data is being collected.
The possible influence of gravitational sedimentation was considered. The residence time within the measuring volume was 0.3 to 8 ms depending on the flow rate, the settling velocity was 4 mm/s. Hence gravitational sedimentation had a negligible effect on the results.
The analysis of the orientation of fibers would be much easier if the fibers could be observed from both visualization planes simultaneously. However, this task is hardly feasible, as two identical high-speed cameras and complex illumination technique ensuring identical light conditions for both instruments would be needed. But more importantly, as the microscope objectives have a relatively low depth of field, the visualization volume is extremely small. Consequently, a flight of fiber through such a crosssection of the visualization planes would be an extremely rare occasion even for very high concentrations of fibers. Scaling of the whole airway replica would solve part of the above-mentioned problems, but keeping the dimensionless numbers equal to the real case while still using fibers suspended in the air would lead to an inextricable problem.
As noted earlier, the orientation of fibers was related to the image frame and not streamlines. The streamlines are curves constructed as tangents to the velocity vector in each point. The situation would be easy for steady flow conditions. In such a case pathlines (i.e. trajectories of centers of each fiber) could be used as indications of streamlines. However, the air flow in our case, especially in daughter branches, is not steady, because the bifurcation induces flow instabilities due to the swift changes of the geometry from the parent to daughter branch. Hence the pathlines and streamlines are not identical. Also, as noted earlier, fibers were recorded within a certain depth of field and therefore the pathlines in different depths would be displayed in the resulting 2D images without the possibility to discriminate between them. Hence, although the rotations of fibers evaluated with respect to the image frame (which was always aligned with the main axis of the respective mother or daughter tube) do not necessarily represent the orientation to the real streamlines, they can be easily used for comparison of various flow regimes and boundary conditions on the behavior of flowing fibers. From this point of view, the fact that only two orientations (parallel or perpendicular) are observed, is favorable.
The precise evaluation of length of fibers is limited by the depth of field. Fibers out of the optimal focus appear shorter. The depth of field is determined by the subject distance, the lens focal length, and the lens relative aperture. For the given camera sensor size (20,48 × 20,48 mm) and the required image spatial resolution (1,3 µm/pix), the depth of field can be controlled only by changing the lens aperture. However, reducing the lens aperture (increasing f-number) reduces the amount of collected light, which severely reduces the contrast of fibers in the image. Moreover, very small apertures are likely to produce diffraction and reduce image overall sharpness. The optical setup used here was a carefully chosen compromise between depth of field, image brightness and sharpness
5. Conclusions
Prediction of the fate of inhaled fibers remains a difficult task. Especially in the case when separate fibers are modeled in bifurcating airways. Our study provides statistically founded answers to several questions which arise when the flow of fibers through a single bifurcation is solved. The analysis of the recorded orientations confirmed that the parallel orientation of the fibers indeed tends to prevail. Nonetheless, its supremacy is relatively low and not permanent. The bifurcation triggered flips to the perpendicular orientation. Consecutively, continuous flipping was observed 1 cm downstream of the bifurcation, while parallel fibers were successively becoming prevalent again.
Although the left and right daughter branch had identical lengths and diameters, the realistic asymmetry of the 3D printed bifurcation originating from a CT scanned airway geometry caused a substantial difference in the behavior of fibers. Their trajectories were more complex in the right branch and also the flips were more frequent there. The flow Reynolds number within the range of 190 to 4500 had little effect on the ratio of parallelly and perpendicularly oriented fibers upstream of the bifurcation, but it influenced the rate of flipping downstream of the bifurcation.
It should be noted that fiber orientation has a substantial effect especially on one of the five lung deposition mechanisms – interception. In fact, every aerosol textbook emphasizes that interception plays an important role mostly for fibers. In principle, our current results can be used to prescribe the orientation of fibers in the deposition formulas. However, one should keep in mind that the presented measurements were performed mostly in the centers of airways. Additional measurements near the walls are needed to capture the effects of the boundary layer and high velocity gradients. Nonetheless, the current results can be used for validation of numerical simulations. If the simulated orientations did not agree in the center, they would most likely not agree at the wall either.
The effort to reveal whether the perpendicular fibers preferably turn into the coronal plane was only partially successful. The statistical analysis of recordings might be interpreted in favor of this hypothesis, but the evaluation of the length of fibers raised some questions that have not been completely answered and additional experiments need to be prepared to confirm or reject this hypothesis.
Supplemental Material
Download MS Word (7.3 MB)Supplemental Material
Download Microsoft Video (AVI) (7.5 MB)Additional information
Funding
Notes
1 The ability to remain inside an organism, resistance to being forced out or digested.
2 A cell in the connective tissue which produces collagen and other fibres.
3 Even small changes in the tube position, caused e.g. by vibrations of floor, slightly change the path of light. This fact, together with the low number of greyscale levels, causes small changes of the background.
Related Research Data
References
- Balashazy, I., M. Moustafa, W. Hofmann, R. Szoke, A. El-Hussein, and A. R. Ahmed. 2005. Simulation of fiber deposition in bronchial airways. Inhal Toxicol. 17 (13):717–727. doi:10.1080/08958370500224565.
- Banko, A. J., F. Coletti, D. Schiavazzi, C. J. Elkins, and J. K. Eaton. 2015. Three-dimensional inspiratory flow in the upper and central human airways. Exp. Fluids. 56 (6):1–12. doi:10.1007/s00348-015-1966-y.
- Belka, M., F. Lizal, J. Jedelsky, P. Starha, H. Druckmullerova, P. K. Hopke, and M. Jicha. 2016. Application of image analysis method to detection and counting of glass fibers from filter samples. Aerosol Sci. Technol. 50 (4):353–362. doi:10.1080/02786826.2016.1151858.
- Brenner, H. 1963. The stokes resistance of an arbitrary particle. Chem. Engin. Sci. 18 (1):1–25. doi:10.1016/0009-2509(63)80001-9.
- Donaldson, K., F. A. Murphy, R. Duffin, and C. A. Poland. 2010. Asbestos, carbon nanotubes and the pleural mesothelium: A review of the hypothesis regarding the role of long fibre retention in the parietal pleura, inflammation and mesothelioma. Part Fibre Toxicol. 7:1–17. doi: Artn 5 doi:10.1186/1743-8977-7-5.
- Donaldson, K., C. A. Poland, F. A. Murphy, M. MacFarlane, T. Chernova, and A. Schinwald. 2013. Pulmonary toxicity of carbon nanotubes and asbestos - similarities and differences. Adv Drug Deliv Rev. 65 (15):2078–2086. doi:10.1016/j.addr.2013.07.014.
- Farkas, Á., F. Lizal, J. Elcner, J. Jedelsky, and M. Jicha. 2019. Numerical simulation of fibre deposition in oral and large bronchial airways in comparison with experiments. J. Aerosol Sci. 136:1–14. doi:10.1016/j.jaerosci.2019.06.003.
- Fuchs, N. A. 1964. The mechanics of aerosols. New York: Macmillan.
- Griffiths, W. D., and N. P. Vaughan. 1986. The aerodynamic behavior of cylindrical and spheroidal particles when settling under gravity. J. Aerosol Sci. 17 (3):431. doi:10.1016/0021-8502(86)90123-0.
- Große, S., W. Schröder, M. Klaas, A. Klöckner, and J. Roggenkamp. 2007. Time resolved analysis of steady and oscillating flow in the upper human airways. Exp Fluids 42 (6):955–970. doi:10.1007/s00348-007-0318-y.
- Inthavong, K., H. Wen, Z. F. Tian, J. Y. Tu. 2008. Numerical study of fibre deposition in a human nasal cavity. J. Aerosol Sci. 39:253–265. doi:10.1016/j.jaerosci.2007.11.007.
- Jeffery, G. B. 1922. The motion of ellipsoidal particles immersed in a viscous fluid. Proceedings of the Royal Society of London A: Mathematical, Physical and Engineering Sciences 102:161–179. doi:10.1098/rspa.1922.0078.
- Kiasadegh, M., H. Emdad, G. Ahmadi, O. Abouali. 2020. Transient numerical simulation of airflow and fibrous particles in a human upper airway model. J. Aerosol Sci. 140:17. doi:10.1016/j.jaerosci.2019.105480.
- Koullapis, P., S. C. Kassinos, J. Muela, C. Perez-Segarra, J. Rigola, O. Lehmkuhl, Y. Cui, M. Sommerfeld, J. Elcner, M. Jicha, I. Saveljic, N. Filipovic, F. Lizal, and L. Nicolaou. 2018. Regional aerosol deposition in the human airways: The siminhale benchmark case and a critical assessment of in silico methods. Eur. J. Pharm. Sci. 113:77–94. doi:10.1016/j.ejps.2017.09.003.
- Kulkarni, P., P. A. Baron, and K. Willeke. 2011. Aerosol measurement: Principles, techniques, and applications. 3rd ed. Hoboken, New Jersey: John Wiley & Sons, Inc.
- Lewis, T. A., Y. S. Tzeng, E. L. McKinstry, A. C. Tooker, K. S. Hong, Y. P. Sun, J. Mansour, Z. Handler, and M. S. Albert. 2005. Quantification of airway diameters and 3d airway tree rendering from dynamic hyperpolarized 3He magnetic resonance imaging. Magn. Reson. Med., 53 (2):474–478. doi:10.1002/mrm.20349.
- Lizal, F., M. Belka, M. Maly, M. Cabalka, J. Jedelsky, and M. Jicha. 2020a. Flow behaviour of inhaled fibres – equations of motion and preliminary results of real trajectories recorded by a high-speed camera. MATEC Web Conf. 328:01005. doi:10.1051/matecconf/202032801005.
- Lizal, F., J. Elcner, P. K. Hopke, J. Jedelsky, and M. Jicha. 2012. Development of a realistic human airway model. Proc. Inst. Mech. Eng. H, 226 (3):197–207. doi:10.1177/0954411911430188.
- Lizal, F., J. Elcner, J. Jedelsky, M. Maly, M. Jicha, A. Farkas, M. Belka, Z. Rehak, J. Adam, A. Brinek, J. Laznovsky, T. Zikmund, and J. Kaiser. 2020b. The effect of oral and nasal breathing on the deposition of inhaled particles in upper and tracheobronchial airways. J. Aerosol. Sci. 150:105649. doi:10.1016/j.jaerosci.2020.105649.
- Mando, M., and L. Rosendahl. 2010. On the motion of non-spherical particles at high reynolds number. Powder Technol. 202 (1–3):1–13. doi:10.1016/j.powtec.2010.05.001.
- Mossman, B. T., M. Lippmann, T. W. Hesterberg, K. T. Kelsey, A. Barchowsky, and J. C. Bonner. 2011. Pulmonary endpoints (lung carcinomas and asbestosis) following inhalation exposure to asbestos. J. Toxicol. Environ. Health B. Crit. Rev. 14 (1–4):76–121. doi:10.1080/10937404.2011.556047.
- Osinubi, O. Y., M. Gochfeld, and H. M. Kipen. 2000. Health effects of asbestos and nonasbestos fibers. Environ. Health Perspect. 108 (Suppl 4):665–674. doi:10.1289/ehp.00108s4665.
- Segre, G., and A. Silberberg. 1961. Radial particle displacements in poiseuille flow of suspensions. Nature 189 (4760):209–210. doi:10.1038/189209a0.
- Shachar-Berman, L., Y. Ostrovski, K. Koshiyama, S. Wada, S. C. Kassinos, and J. Sznitman. 2019. Targeting inhaled fibers to the pulmonary acinus: Opportunities for augmented delivery from in silico simulations. Eur. J. Pharmaceut. Sci. 137:1–10. doi:10.1016/j.ejps.2019.
- Shanley, K. T. and G. Ahmadi. 2011. A numerical model for simulating the motions of ellipsoidal fibers suspended in low reynolds number shear flows. Aerosol Sci. Technol. 45:838–848. doi:10.1080/02786826.2011.566293.
- Shanley, K. T., G. Ahmadi, P. K. Hopke, Y. S. Cheng. 2018. Simulated airflow and rigid fiber behavior in a realistic nasal airway model. Part. Sci. Technol. 36:131–140. doi:10.1080/02726351.2016.1208694.
- Štarha, P., H. Druckmüllerová, M. Bělka, F. Lízal, and J. Jedelský. 2013. Application of adaptive radial convolutional filter. In 19th International Conference on Soft Computing, MENDEL 2013, Brno, pp., 357–362.
- Tian, L. and G. Ahmadi. 2013. Fiber transport and deposition in human upper tracheobronchial airways. J. Aerosol Sci. 60:1–20. doi:10.1016/j.jaerosci.2013.02.001.
- van Wachem, B., M. Zastawny, F. Zhao, and G. Mallouppas. 2015. Modelling of gas-solid turbulent channel flow with non-spherical particles with large stokes numbers. Int. J. Multiphase Flow 68:80–92. doi:10.1016/j.ijmultiphaseflow.2014.10.006.
- Wang, Z., P. K. Hopke, G. Ahmadi, Y. S. Cheng, and P. A. Baron. 2008. Fibrous particle deposition in human nasal passage: The influence of particle length, flow rate, and geometry of nasal airway. J. Aerosol Sci. 39 (12):1040–1054. doi:10.1016/j.jaerosci.2008.07.008.
- Wang, Z. C., P. K. Hopke, P. A. Baron, G. Ahmadi, Y. S. Cheng, G. Deye, and W. C. Su. 2005. Fiber classification and the influence of average air humidity. Aerosol Sci. Technol. 39 (11):1056–1063. doi:10.1080/02786820500380198.
- Zastawny, M., G. Mallouppas, F. Zhao, and B. van Wachem. 2012. Derivation of drag and lift force and torque coefficients for non-spherical particles in flows. Int. J. Multiphase Flow 39:227–239. doi:10.1016/j.ijmultiphaseflow.2011.09.004.
- Zhang, L., B. Asgharian, S. Anjilvel. 1996. Inertial and interceptional deposition of fibers in a bifurcating airway. J. Aerosol. Med. 9:419–430. doi:10.1089/jam.1996.9.419.