
 ?Mathematical formulae have been encoded as MathML and are displayed in this HTML version using MathJax in order to improve their display. Uncheck the box to turn MathJax off. This feature requires Javascript. Click on a formula to zoom.
Abstract
A general purpose aerosol conditioning device called the Universal Aerosol Conditioner (UAC) has been designed and tested. The device may be used to condition an aerosol in multiple ways: dilute the entire aerosol (gas- and particle-phase), dilute only a gas-phase component of the aerosol without diluting the particle concentration, denude the aerosol by removing semi-volatile material from the particle phase, and humidify or dehumidify an aerosol. The UAC accomplishes these processes by bringing the aerosol into contact with sheath air and allowing enough time for gas-phase components of the aerosol to diffuse into the sheath flow. A model was developed to assess the theoretical performance of the UAC and was solved numerically. From the model it was determined that two parameters dictated the rate of diffusion between the two flows: the Péclet number and the ratio of sheath-to-aerosol flow rates. A prototype was designed and built and the theory of operation was experimentally validated by measuring the particle penetration efficiency and the gas dilution factor at various particle sizes and flow conditions. The results showed that at low aerosol and sheath flows, the prototype behaved closely to the theoretical model but diverged from the theory once the sheath flows were increased, presumably due to mixing between the two flows.
Copyright © 2022 American Association for Aerosol Research
EDITOR:
1. Introduction
A range of applications involving aerosols require conditioning processes including dilution, denuding, gas exchange and drying/humidification. Aerosol dilution is achieved by adding diluent gas (typically particle-free air) to the aerosol to reduce the concentration of the particle- and gas-phase species as done using methods such as dilution tunnels (Ström, Ekdahl, and Harbuck Citation1995), ejector dilutors (Mikkaanen and Koskinen Citation2010; Gehner et al. Citation2006), and rotary disk diluters (Bergmann and Pongratz Citation2013), for example. Aerosols are commonly denuded to remove specific gas species by using thermal denuders (Burtscher et al. Citation2001; Wehner, Philippin, and Wiedensohler Citation2002), catalytic strippers (Swanson and Kittelson Citation2010), and diffusion denuders (Kulkarni et al. Citation2011; Allegrini et al. Citation1987; Kitto and Colbeck Citation2017). Commonly, denuders are heated to remove semi-volatile material which can be adsorbed on the surface of a particle or present in a distinct mode of particles in the aerosol, useful in applications where only the nonvolatile material of an aerosol (e.g. black carbon) is desired including in regulatory measurements of vehicle exhaust (Giechaskiel et al. Citation2019). Some applications require the aerosol to be dried or humidified (e.g. to shrink/grow particles by evaporation/condensation) commonly using silica gel dryers (Namieśnik and Wardencki Citation1999) or Nafion[textregistered] tube dryer/humidifiers (Leckrone and Hayes Citation1997; Smith and Burke Citation2012; Yang et al. Citation2018) by exchanging gas species, in this case water vapor, through diffusion across a semi-permeable membrane. While many of these conditioners function exceptionally well at the tasks for which they were designed, it is both cumbersome and costly to use many different devices to condition the aerosol prior to measurement even though many of the operating principles of each conditioner are similar. Furthermore, it can become a technical challenge if these devices operate at different recommended flow rates. Ideally, one device could be used for all these aerosol conditioning tasks: dilution, denuding, gas exchange and drying/humidifying with flexibility in operating modes depending on the desired application.
Recently, Hagino (Citation2017) developed a cylindrical counter-flow denuder (CoFD) to exchange gas species from a sample flow to a purge flow across a cylindrical, semi-permeable membrane. The CoFD enables removal of trace gases which are inert or less reactive (e.g. CO2, H2O, CO, NO) and therefore may not be suitably removed by conventional denuders which require gas diffusion to a chemically reactive surface (Kitto and Colbeck Citation2017). In the CoFD, a sample aerosol is drawn through the central tube while the purge gas flows through the annular region in a counter-flow configuration. It was shown to remove a range of gas species from the sample flow while maintaining high particle penetration. Therefore, the method was shown to be suitable for conditioning prior to characterizing particles with techniques which may be sensitive to background trace gases. Building on that work, Bainschab et al. (Citation2019) characterized a gas exchange system involving a CoFD with a semi-permeable membrane. A model of gas removal efficiencies was validated by experiment for a range of gases and the authors showed remarkably high particle penetration for particles smaller than 23 nm, relevant to existing and upcoming legislation on particle emissions measurement. Though it could be addressed in future designs, Bainschab et al. (Citation2019) report limitations in operating temperature due to requirements for sealing to the porous membrane and show that gases such as gaseous sulfuric acid likely ‘stick’ to the porous membrane interfering with exchange of species in the gas-phase which may lead to a need for periodic regeneration or replacement of the porous membrane. Special attention must be paid to the material of the porous membrane, including the pore size, to avoid undesired particle or gas losses, e.g. by using porous glass rather than PTFE (Hagino Citation2017).
The CoFD system requires a special membrane in order to operate, however, a membrane is not necessary if the sheath and aerosol flows do not mix and are operated in co-flow rather than counter-flow. McMurry and Stolzenburg (Citation1989) successfully demonstrated a membrane-less dryer/humidifier system with sheath and aerosol flows in co-flow, with a predictable increase in RH and typically 80% particle penetration efficiency. That method relied on allowing diffusive exchange of water vapor between controlled sheath and sample flows. In this work, we show that the system can be extended to different operational modes (and other applications) which rely on diffusive exchange of gas species by carefully controlling the gas flowing in and out of the conditioner. Dilution of gas species beyond water vapor can be accomplished while maintaining high particle penetration. Denuding may also be accomplished by heating the sheath flow entering the conditioner. Simple gas and particle dilution may be performed, if desired, by balancing flow rates since there is no membrane separating the flows. As no membrane is required for any of these functions to work, this RH conditioner serves as an excellent base for a multi-functional conditioning instrument, which we call a Universal Aerosol Conditioner (UAC). This article describes the operation of the system using a theoretical model and demonstrates the performance of the system for exchange of gas species and particle penetration.
2. The universal aerosol conditioner
The purpose of the Universal Aerosol Conditioner (UAC) is to accomplish diluting, denuding and drying/humidifying in one device as well as diluting the gas-phase of the aerosol without diluting the concentration of the particle-phase.
The UAC consists of sample inlet and sample outlet tubes which are concentric to an outer tube (‘dilution tube’) as shown in . The aerosol enters and exits the UAC through the sample inlet and sample outlet tube, respectively. A sheath flow enters from a manifold close to the sample inlet, thereby forming an annular region between the central tube and the outer tube (see ). The sheath flow is filtered to remove any particles. To ensure the sheath flow enters the dilution chamber uniformly, the sheath flow passes through fine glass beads which are constrained using a fine mesh screen at both the inlet and outlet of the UAC.
Figure 1. (a) Schematic of the prototype UAC manifolds. Not to scale: the length, L, is longer than shown. (b) Schematic of the prototype UAC. Note: in this schematic the sheath/exhaust flow is only connected to one port on each manifold. Experimental validation was done with both ports connected.
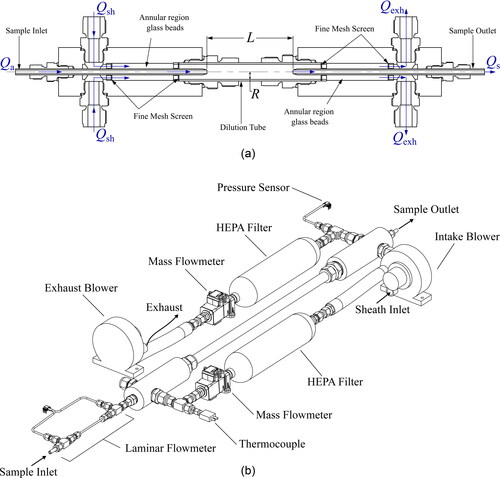
The flow rate of the sample outlet flow, is controlled by an aerosol instrument, or some other device, downstream of the UAC. As shown in , the flow rate of the sheath flow,
and exhaust flow,
are each controlled by a blower and mass flow meter in feedback systems. Both the aerosol and sheath flows are laminar to prevent mixing of the sheath and aerosol flows. A thermocouple and pressure sensor upstream of the inlet manifold are used to calculate the densities of the gases and volumetric flow rates within the UAC. By controlling the sample outlet, exhaust and sheath flows, the sample inlet flow,
is dictated.
Once the aerosol enters the UAC, the particles are carried along the central axis with the flow. Gas species in both the aerosol and sheath flows will diffuse, and, by Fick’s law, net diffusion of gas species will follow a concentration gradient. Therefore, gas species of the sheath flow may diffuse into the aerosol flow and gas species of the aerosol flow may diffuse into the sheath flow (i.e. following a concentration gradient in the radial direction). If the length, L, of the outer tube is sufficiently long, then the gas concentration will be uniform in the radial direction prior to the outlet. In the UAC, particles in the aerosol stream will also diffuse outwards toward the particle-free sheath flow. However, since the diffusion coefficients of particles are typically several orders of magnitude lower than the diffusion coefficients of the carrier gases, operating points may be selected such that the particles will remain in the region of flow near the central axis.
2.1. Theory of operation
The device could be used in four modes of operation: gas dilution, denuding, humidification, and combined gas and particle dilution.
Gas dilution without particle dilution can be accomplished by setting the sheath flow, equal to the exhaust flow,
To reduce the concentration of a gas component in the aerosol, the sheath flow should be a gas with a very low concentration of the component to be reduced. For example, if the aerosol is saturated with water vapor, then dry air can be supplied to the sheath flow, and the aerosol will be dried. The gas dilution ratio will depend on the ratio of the sheath flow to the aerosol flow, the relative concentrations of the gas to be diluted in the two flows, as well as the residence time in which the two flows are in contact. Assuming a diluent gas is used for the sheath flow and gas concentration is uniform in the radial direction at the outlet, the dilution factor will only depend on the sheath to aerosol flow ratio. For example, if the sheath flow is 9 times larger than the aerosol flow, then the gas concentration will be reduced by a factor of 10.
Denuding may be accomplished by setting the sheath flow equal to the exhaust flow and heating the sheath air (before it enters the outer tube chamber) or the outer tube or both. To heat the sheath air an inline heater can be added downstream of the sheath mass flow sensor. In this mode, the volatile material in the aerosol evaporates, diffuses into the sheath flow and is exhausted. As in the case of gas dilution without particle dilution, the reduction in concentration is equal to the ratio of sheath to aerosol flow.
Humidification can be accomplished by setting the sheath flow equal to the exhaust flow and by supplying humidified sheath air into the UAC. In this case, the water vapor in the sheath flow diffuses into the aerosol stream and humidifies it. Conversely, the aerosol stream can be dried by exposing it to a dry sheath flow (McMurry and Stolzenburg Citation1989).
Since the flows are controlled and monitored, and there is no membrane separating flows, the UAC may further be used as a simple diluter. Combined gas and particle dilution can be accomplished by setting the sheath inlet flow higher than the exhaust flow (i.e. ), thereby drawing in some sheath flow to the sample outlet flow resulting in
Since the flows are controlled and monitored, a known dilution ratio (i.e. calculated by the flow rate measurements) may be easily selected and given the uncertainty in the mass flow meters it is expected this method would give accurate dilution up to dilution ratios of 10. In contrast, ejector dilutors provide an unknown dilution ratio (unless it is calibrated or measured), though may have other advantages depending on the configuration (Bergmann et al. Citation2008).
As a side note, one additional operating mode is setting the sheath inlet flow to a value higher than the sum of the sample outlet and exhaust flows. This would result in ‘clean’, sheath air exiting the sample inlet, sample outlet, and exhaust and could be used if the experimental apparatus allows it. For example, this configuration may be used to provide particle-free gas to the aerosol instrument at the outlet to “zero” it.
3. Theoretical model
As diffusion is the primary operating mechanism of the UAC, a model was developed using the advection-diffusion equation as its basis. From the model, the concentration profiles of both the particle- and gas-phases throughout the UAC’s dilution chamber can be found. Two important parameters can be calculated by knowing the concentrations of the particles and gases at the aerosol inlet and outlet sample tubes: the particle penetration efficiency and the dilution factor for the gas-phase. Particle penetration, η, is the ratio of particle flux that exits in the sample flow to the particle flux entering with the aerosol flow. Penetration is important in identifying the concentration of particles that is expected to be retained in the aerosol sample once it passes through the UAC. The dilution factor, DF, is the ratio of gas flux of the unwanted gas species that exits the sample outlet to the gas flux of that species that enters the sample inlet. The dilution factor shows how much of the undesirable gas species can be diluted in the aerosol.
The region modeled is bounded by the distance between the sample inlet and outlet tubes, L, and the inner radius of the dilution tube, R. Since this region is axially symmetric, only half of the domain was modeled (centerline to wall). The advection-diffusion equation (Friedlander Citation2000) for incompressible flow in the absence of any body forces on the particles is
(1)
(1)
where n is the concentration of particles or gas species, t is time, u is the gas velocity, and D is the diffusion coefficient of the particle or gas species.
Assuming: i) particle or gas diffusion in the axial direction is negligible, ii) the flows do not mix and are fully developed and parabolic, iii) there is no rotational component to the flow velocities (i.e. there is no θ velocity component), iv) and the flows are steady-state, then EquationEquation (1)(1)
(1) in cylindrical coordinates becomes
(2)
(2)
where z and r are the axial and radial directions, respectively. Recall that the aerosol sample that is to be conditioned enters through the small central tube, while the sheath flow enters from the annular region formed from the central tube and the outer tube. The concentration profile entering the UAC dilution tube (i.e. just downstream of the outlet of the central inlet tube) for both the particle and gas-phases of the combined aerosol and sheath flow can be expressed as a step profile in cylindrical coordinates:
(3)
(3)
where n0 is the initial concentration and
is the radius of the bounded aerosol core. The bounded radius is found through:
(4)
(4)
where R is the inner radius of the dilution tube. Zero concentration at the walls and axial symmetry are prescribed for the boundary conditions for the particle phase:
(5)
(5)
(6)
(6)
The boundary conditions prescribed for the gas-phase using EquationEquation (2)(2)
(2) are zero gradient at the wall and symmetry about the diluter centerline:
(7)
(7)
(8)
(8)
Converting EquationEquation (2)(2)
(2) to a dimensionless form yields:
(9)
(9)
where Pe, ν, ρ, and ζ denotes the Péclet number, dimensionless concentration (
), radial (
), and axial locations (
), respectively. Pe is given by:
(10)
(10)
Notice that Pe is independent of the dilution chamber radius. This implies that diffusion in the UAC is independent of the radius of the dilution tube. EquationEquation (9)(9)
(9) was solved numerically using the Crank-Nicolson finite difference method (detailed derivation of the model and discretization can be found in the online supplementary information).
3.1. Visualizing diffusion in the UAC
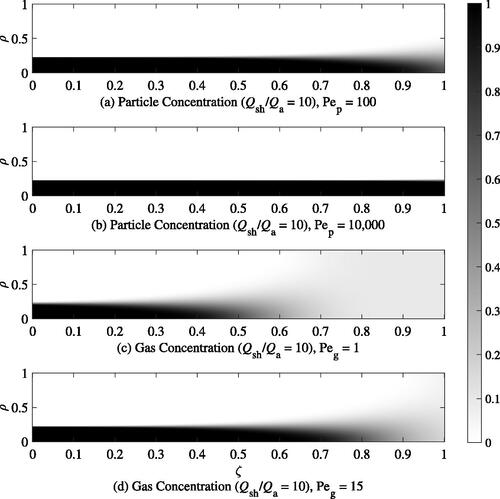
Diffusion in the UAC is visualized by examining the concentration maps for both phases of the aerosol in over a range of Pe that one might expect in practice. For clarity, Pe for the particle and gas phases are denoted by Pe and Pe
, respectively. A sheath-to-aerosol ratio of 10 is used to plot these maps as it is near the maximum dilution ratio that could be accurately controlled with such a system. The sheath flow is assumed to contain only diluent gas. In the case of the particle phase, Pe
of 100 () and 10,000 () are used to illustrate the operating principle of the UAC. At Pe
of 10,000, there is minimal particle diffusion – only a small amount of diffusion can be seen near the outlet of the dilution chamber. With a Pe
of 100, diffusion at the outlet is more noticeable as a larger portion of the particles have migrated further away from the center of the dilution chamber. For the gas-phase species, diffusion is significant even at the higher end of the practical Pe
numbers considered. As shown in , for Pe
of 1, net diffusion of gas species from the sample flow to the sheath flow may be observed early in the flow, near the inlet. At low Pe
of order 1 or lower, by the time the sample reaches the end of the dilution chamber, the concentration of gas species will be uniformly distributed across ρ, which is desired for controlled gas dilution. For Pe
of 15 shown in , it is seen that a higher concentration of gas species remains near the center of the dilution chamber compared with the outer, sheath flow. In summary, for optimal gas-only dilution, particle Pe
must be kept high while minimizing gas Pe
In general, this is possible because the diffusion coefficient for typical particles of interest is orders of magnitude smaller than typical gases.
Figure 2. Concentration maps of the particle (p) and gas (g) phases of the aerosol at different Peclet numbers (Pe) for non-dimensional radial () and axial (
) locations.
3.2. Theoretical performance
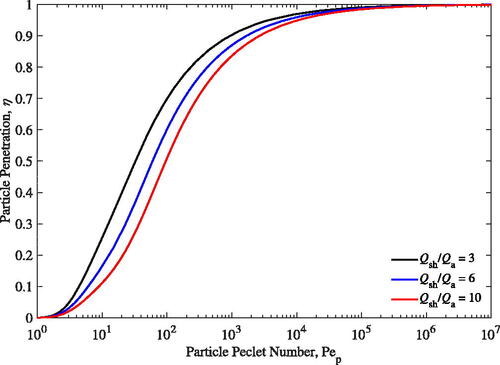
Particle penetration at various flow ratios are shown in . The particle penetration increases with Pe until it is sufficiently large (Pe
of approximately 1000). It is interesting to note that the particle penetration increases with decreasing flow ratios. The aerosol core bounding radius, ra, decreases as the sheath-to-aerosol flow ratio increases leading to higher rate of diffusion of particles (relative to advection) through the smaller bounding area into the sheath flow. In isolation, if maximizing particle penetration, η, is desired then smaller sheath-to-aerosol flows should be used but, in doing so, gas dilution will decrease as shown in the next section.
Figure 3. Theoretical particle penetration at different Pe and sheath-to-aerosol ratios.
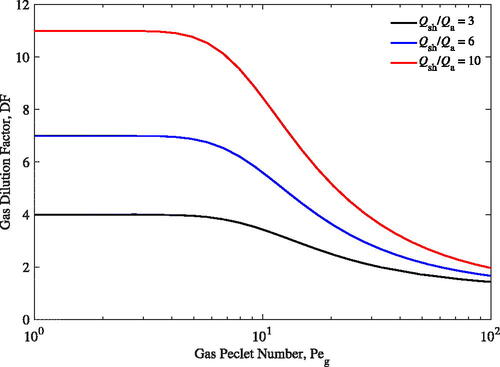
shows the expected gas dilution at various flow ratios. As shown in the figure, gas dilution is significantly reduced once Pe is greater than 10. To achieve high gas dilution factors, large flow ratios are needed and Pe
must be kept low. Ideally, Pe
should be kept below 10 as DF is still close to its maximum value. Once Pe
is larger than 10, the dilution factor quickly decays until it reaches an asymptote. At high Pe
(i.e. Pe
> 100), there is not significant gas diffusion between the two flows because the residence time in the UAC is too short. The conditions that the particle penetration benefits from (short tube length and high volumetric flow rates) have a detrimental effect on the gas dilution.
Figure 4. Theoretical gas dilution factor at different Peg and sheath-to-aerosol ratios.
4. Experimental setup
4.1. Prototype description
A schematic of the prototype is shown in . The diameters of the aerosol sample and dilution tubes were selected for isokinetic flow of the sheath and sample flows (i.e. axial flow velocities of the sheath and aerosol flows equal to one another at the inlet) at a sheath-to-aerosol flow ratio of 10:1. The aerosol sample tubes were 0.2 m in length with an outer diameter (OD) of 6.35 mm (0.25 inch), and an inner diameter (ID) of 3.56 mm. The dilution tube had an OD of 19.05 mm (0.75 inch), an ID of 15.75 mm, and a length of 0.559 m. This dilution tube length resulted in a distance, L, of 0.5 m between the sample tubes.
In addition, a laminar flow meter was integrated into the aerosol sample inlet of the UAC to monitor the actual aerosol volumetric flow rate coming into the UAC. The laminar flow meter was constructed out of two 0.25 inch OD Swagelok tees (SS-400-3) with a 10 cm long tube with an OD of 3.175 mm (0.125 inch) and an ID of 1.753 mm connecting the tee fittings together. A pressure sensor (Model HSCDRRN002NG2A3, Honeywell Sensing) was connected to each tee to read the pressure drop across the length of the 3.175 mm OD tube. The pressure reading was then used to calculate the aerosol flow rate once calibrated.
An Arduino Uno was programmed to control the sheath and exhaust flows using proportional-integral-derivative (PID) control. The sheath and exhaust flows were each driven by a regenerative blower (Model SE12RE21SA/081780, Ametek Dynamic Fluids Solution). Each blower had its own mass airflow sensor (Model Zephyr HAFUHT0020L3AXT, Honeywell Sensing) to measure the volumetric flow rate through the sheath and exhaust lines. The absolute pressure (Model SSCSRNN1.6BA7A3, Honeywell Sensing) and temperature (Type-K thermocouple, Omega) were also measured and were used to calculate the volumetric flows. Both the sheath and exhaust flows were filtered. The HEPA filters (HEPA Capsule 12144, Pall Laboratory) were located immediately upstream of the mass airflow sensors.
4.2. Particle penetration testing
Schematics of the particle penetration experimental setups are shown in . The UAC was set to gas-only dilution mode (e.g. ) for all tests. To evaluate the penetration efficiency, the particle concentration entering and exiting the UAC were measured using a condensation particle counter (CPC; Model 3776, TSI Inc.). Penetration efficiency was then calculated by taking the ratio of these two concentrations.
Figure 5. Experimental setups for testing the particle penetration through the Universal Aerosol Conditioner (UAC). Bis (2-ethylhexyl) sebacate (DOS) particles were classified using an Aerodynamic Aerosol Conditioner (AAC) or NaCl particles were classified using Differential Mobility Analyzer (DMA) upstream of the UAC. Particle concentrations were measured using a Condensation Particle Counter (CPC).
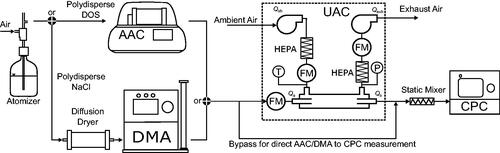
Bis (2-ethylhexyl) sebacate (‘DOS’) and sodium chloride (NaCl) particles were used for testing penetration efficiency. The particles were generated with an atomizer (Model 3076, TSI Inc.). The NaCl (99.0%, Sigma-Aldrich) particles were generated from a solution of distilled water (0.5% mass fraction) while the DOS particles were generated from pure bis (2-ethylhexyl) sebacate (>97.0%, Aldrich Chemistry). DOS was used to test particle sizes >100 nm, while the NaCl was used to test particle sizes
25 nm.
As shown in , for larger particle diameters (>100 nm), DOS particles were classified by their aerodynamic diameter, using an aerodynamic aerosol classifier (AAC; Cambustion Ltd.; Tavakoli, Symonds, and Olfert Citation2014) set to a resolution of 10 in terms of relaxation time (i.e. the sheath-to-aerosol flow ratio was 10). The AAC was used as it classifies particles independent of particle charge (i.e. no multiple-charge artefacts) over a wide range of diameters (25 nm to >5 μm) with high transmission efficiency and high resolution (Tavakoli and Olfert Citation2013). To measure the penetration as a function of particle diameter, aerodynamic diameters of 100, 250, 500, and 1000 nm were used. Particle counts upstream of the UAC were measured using the bypass line; the length of the bypass line was made equal to the UAC-CPC path to keep the diffusional losses in each flow path the same. HEPA-filtered (particle-free) ambient air was used as the sheath gas in the UAC.
For diameters 25 nm, penetration efficiency was tested using an electrostatic classifier (Model 3080, TSI Inc.), which comprised of a bipolar charge neutralizer (Model 3077 A, TSI Inc.) followed by a differential mobility analyzer (Model 3081, TSI Inc.), to classify NaCl as shown in . The DMA was used to classify particles smaller than the range of the AAC (∼25 nm). The DMA resolution was set to 10 in terms of electrical mobility (i.e. the sheath-to-aerosol flow ratio was 10). NaCl particles with nominal mobility diameters of 11 nm (the smallest mobility diameter for NaCl that could be measured in the experiment) and 25 nm were used. Multiply charged particles with larger mobility diameter than the nominal setpoint of 25 nm represent <5% of the particles classified and are therefore neglected. After the aerosol was generated it was dried with a diffusion dryer (Model 3062, TSI Inc.) before entering the classifier. From there, the classified aerosol entered either the UAC or bypass line as previously discussed.
When the aerosol sample exits the UAC, the particles are generally not well-mixed with the gases. Due to some mixing (which will be shown later) between the aerosol and sheath flows in the UAC, the particles exiting the UAC with the sample flow will be concentrated in a region that is off center from the sample tube centerline. This becomes a problem when the particle concentration is measured with the CPC 3776. If the aerosol is not thoroughly mixed, the CPC will report inaccurate particle concentrations due to the way the CPC internally splits the incoming aerosol sample for particle counting (TSI Incorporated Citation2014). Depending on how the particles are oriented in the aerosol sample flow, the CPC can either over or under-count the true particle concentration in the aerosol. To avoid this issue, a static mixer (Model 1/4-40-2-6-2, Koflo Corporation) was connected directly to the CPC’s sample inlet and was used for both the downstream and bypass measurements.
To conduct the experiments, the desired particle size was first selected on the classifier. The sample flow rate was set to 0.3 L min−1 while the sheath flow rate of the UAC was varied. At each sheath flow rate, the particle concentration was first measured upstream of the UAC, then bypassing UAC, each for a sample period of 30 s. This procedure was repeated five times for each sheath flow rate tested (for a total of five samples at each sheath setting). Then, the sample flow rate was changed to 1.5 L min−1, and the testing procedure was repeated. Aerosol sample flow rates of 0.3 L min−1 and 1.5 L min−1 were used for determining particle penetration as these are the two flow rates at which the CPC can operate. The maximum sheath flow rate the regenerative blowers could produce was 13 L min−1. Once testing at 0.3 L min−1 and 1.5 L min−1 was completed, the particle size was changed and the entire testing procedure was repeated. The particle penetration, η, was calculated by dividing the particle concentration downstream of the UAC, by the concentration upstream of the UAC,
at each flow combination:
(11)
(11)
4.3. Gas dilution testing
The gas dilution setup is shown in . A LI-COR LI-840A gas analyzer was used to measure the concentration in the sample flow upstream and downstream of the UAC. Ambient air was used as the sample gas while the sheath gas was dry nitrogen (
). The
line was vented before meeting the sheath inlet of the UAC to ensure that the UAC’s sheath blower was only drawing in the necessary amount of
A CPC was used as a suction pump for the sample line as the LI-840A lacks an internal pump. The sample flow rate was held constant as the sheath flow was varied.
Figure 6. Experimental setup for testing the Universal Aerosol Conditioner’s (UAC) dilution performance. A Condensation Particle Counter (CPC) was used as a suction pump for the sampling line.
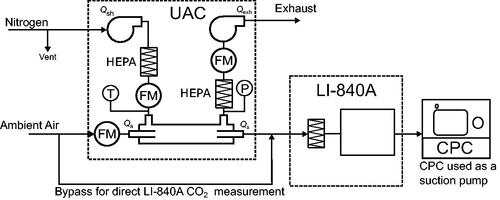
In the gas dilution experiments, the sample flow rate was set to 0.3 L min−1 while the sheath flow rate was varied. At each sheath flow rate, the concentration in ambient air was first measured for a period of 15 s. Then, the sample outlet of the UAC was connected to the LI-840A and the
concentration was monitored until it decreased to a steady reading. The
concentration was then measured for 15 s. This procedure was repeated five times for each sheath flow rate. The dilution factor, DF, was then calculated by dividing the ambient
concentration by the
concentration downstream of the UAC:
(12)
(12)
where
is the
concentration upstream of the UAC and
is the
concentration downstream of the UAC.
5. Results and discussion
5.1. Particle penetration results
Particle penetration over a range of mobility diameters and two distinct flow rate settings is shown in . For reference, the particle Pe in spans from ∼4,900 to 8.42 and ∼6,800 to 1.20
for flow ratios of 10 and 8.67, respectively, due to the wide range of particle sizes. The error bars represent the 95% confidence intervals of the uncertainity in the mean of the measurements.
Figure 7. Experimental and theoretical particle penetration, η, as a function of particle mobility diameter, for two distinct flow rate settings. Corrected for additional diffusional losses in the sampling line.
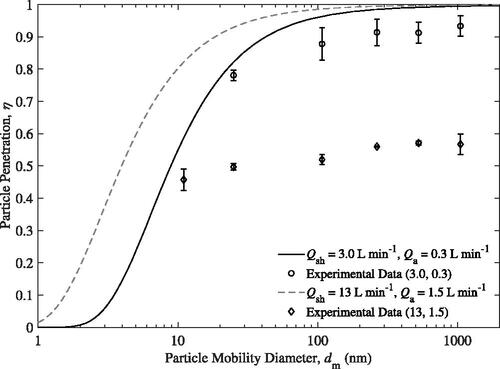
shows good agreement between the experimental data and model when the sample flow rate is set to 0.3 L min−1 and a flow ratio of 10 is used. In particular, the model seems to predict diffusional losses well at small particle sizes. At a mobility diameter of 25 nm, there is only a difference of ∼0.04 between the model and experiment. Particle penetrations, η, for mobility diameters larger than 100 nm were 0.88 or better. Note that 11 nm particles could not be measured when is set to 0.3 L min−1 as the diffusional losses in the sample line prior to the UAC were too high.
The offset between the experimental data and the theoretical penetration at larger particle sizes suggests that at this flow setting, there is a possibility that there is some mixing between the aerosol and sheath flow, meaning the gas streamlines do not follow the trajectories as expected in the model. Examining the data collected when the aerosol flow rate was set to 1.5 L min−1 and the sheath flow rate was set to 13 L min−1, suggests there is some flow instability. For this flow rate setting, the experimental particle penetration at all particle sizes tested are significantly lower than predicted. Even particles with a large mobility diameter of 1050 nm see large losses once passed through the UAC. On average for all particle sizes tested, ∼54% of the particles do not reach the UAC sample outlet. As the particle penetration is only weakly dependent on particle size, other loss mechanisms besides diffusion must be prevalent. As mentioned earlier, mixing between the flows would explain why the experimental penetration values are significantly lower and why the penetration efficiency is relatively constant with diameter.
To investigate if mixing is occurring, η was measured for a particle with a mobility diameter of 1050 nm across several different sheath flow rates as shown in . Experiments were conducted for both 0.3 L min−1 and 1.5 L min−1 aerosol flow rates. The smallest particle Pe presented here is 1.0 meaning little to no particle diffusion is expected as seen by the constant theoretical lines.
Figure 8. Particle penetration for = 1050 nm as a function of
with
and 1.5 L min−1.
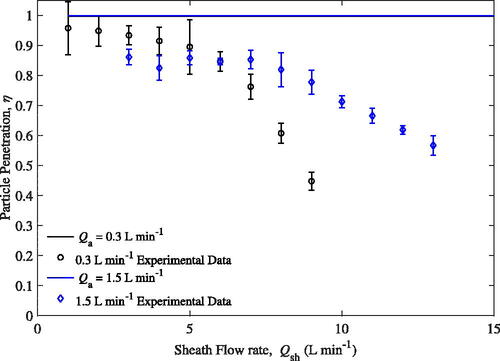
At 1.5 L min−1, the observed η remains constant (with an offset from the theory) for sheath flow rates less than 8 L min−1. For sheath flow rates greater than 8 L min−1, penetration starts to decrease. The small offset at the lower sheath flow rates suggests mixing is already present and more mixing occurs as the sheath flow rate increases. The sheath flow may not be evenly distributed in the dilution chamber, the inlet and outlet tubes are not coaxial with each other or the outer tube, and/or the assumption of fully developed flow in the model does not adequately describe flow effects possibly occurring in the experiment. More evidence of this will be shown in the following section.
Meanwhile, the observed penetration for 0.3 L min−1 at sheath flows ranging from 1 to 5 are very high; the particle penetration on average is greater than 0.90 for flow rates in this range. The particle penetration for sheath flows ranging from 3 to 6 L min−1 are higher when the sample flow rate is at 0.3 L min−1 than it is at 1.5 L min−1. Penetration was observed to have started decreasing earlier at 0.3 L min−1 than at 1.5 L min−1. With sheath flow rates greater than 6 L min−1, the penetration decreases rapidly. At a sheath flow of 7 L min−1, the particle penetration at 0.3 L min−1 sample flow is significantly reduced compared to 1.5 L min−1 (a difference of ∼0.21).
5.2. Gas dilution results
Gas dilution was only tested with a of 0.3 L min−1 because the flow rate of 1.5 L min−1 exceeded the maximum that the LI-840A is capable of operating at. The results of the dilution test are shown in . The expected dilution factor is predicted by the theoretical model while the maximum dilution factor is the largest dilution factor possible when the aerosol and sheath flows are completely mixed. The area in the plot that is bounded by the expected and maximum dilution factor curves are regions where mixing occurs.
Figure 9. Experimental CO2 DF compared to the theoretical model at various with
= 0.3 L min−1.
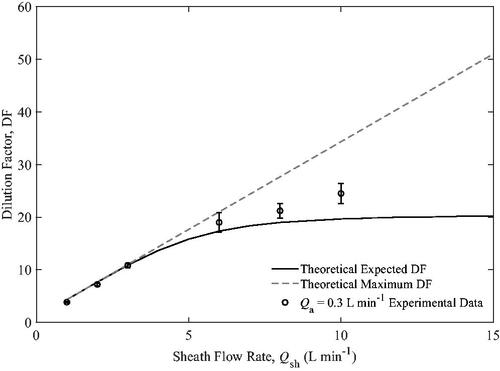
At low sheath flows, the maximum and expected dilution factors are the same because the gas has sufficient time to diffuse uniformly across the dilution tube. Once becomes larger than three, the two curves begin to deviate from each other. Specifically, when the Pe
for CO2 is too high for the CO2 in the aerosol to completely diffuse uniformly across the dilution tube, the dilution factor is reduced from the theoretical maximum. For reference, the data points shown in the figure correspond to Pe
ranging from 1.72 to 13.7. With small sheath flows (Pe
ranges from 1.72 to 4.38 for
= 1 to 3 L min−1), the experimental DF aligns very closely with theory. At higher sheath flows (
= 6 to 10 L min−1), the trends in the experimental data and theory agree well. The experimental data shows slightly higher than expected dilution factors possibly due to some advective mixing of flows at higher sheath flows. If the aerosol, Q
and sheath flows, Q
were fully mixed prior to the outlet, the dilution factor would approach a maximum. Therefore, the differences between the theory and experiment are attributed to the assumptions in the model which do not fully account for possible mixing, e.g. assuming fully developed flow, or assuming that the tubes for aerosol and sheath flows and exactly collinear with the walls. Some unaccounted advective mixing at high sheath flow rates would also explain particle losses seen in the previous section (flow ratio of 8.67,
L min−1).
The Hagino denuder achieves particle penetrations that are on average greater than 90% (for particle sizes ranging from 20 nm to 300 nm), agreeing with theory, versus the 80% observed in the UAC. The UAC gas dilution performance is quite comparable to the Hagino denuder when they are operated at the same flow rates. At a sample flow rate of 0.3 L min−1 and a 10:1 sheath-to-aerosol flow rate ratio, the UAC removes ∼90% of the CO2 from the aerosol while the Hagino denuder removes ∼95%. The Hagino denuder is able to hold a performance advantage over the UAC while also being roughly half the physical size since it may be operated in counter-flow. However, the Hagino denuder requires the use of a porous membrane which increases the cost of the system and performance may deteriorate due to fouling (Bainschab et al. Citation2019).
6. Conclusion
It was found that the particle penetration and gas dilution performance agreed quite well with the theoretical model when the sample flow was set to 0.3 L min−1 and a sheath-to-aerosol ratio of 10:1 was used. The particle penetration on average was >80% for each mobility diameter tested. Dilution factors with sheath flow rates from 1 to 3 L min−1 were very close to the predicted values from the model. Experimental testing has shown that there may be some mechanisms not accounted for in the model or that some assumptions were incorrect, such as the assumption of fully developed flow entering the dilution chamber. Higher sample flow and larger sheath flow rates showed problematic areas with the current UAC design. Mixing between the aerosol and sheath flows was likely to have occurred at higher sheath flow rates, resulting in poor particle penetration and higher than expected gas dilution. If the UAC is operated solely in low flow mode, it functions well in the gas-only dilution mode for flow ratios up to 10. Ratios beyond 10 tend to have deteriorated performance presumably due the mixing issue that arises at high sheath flows.
Supplemental Material
Download PDF (225.4 KB)Supplemental Material
Download Latex File (27.6 KB)Additional information
Funding
Related Research Data
References
- Allegrini, I., F. D. Santis, V. D. Palo, A. Febo, C. Perrino, M. Possanzini, and A. Liberti. 1987. Annular denuder method for sampling reactive gases and aerosols in the atmosphere. Sci. Total Environ. 67 (1):1–16. doi:10.1016/0048-9697(87)90062-3.
- Bainschab, M., S. Martikainen, J. Keskinen, A. Bergmann, and P. Karjalainen. 2019. Aerosol gas exchange system (AGES) for nanoparticle sampling at elevated temperatures: Modeling and experimental characterization. Sci. Rep. 9 (1):17149. doi:10.1038/s41598-019-53113-5.
- Bergmann, A., and H. Pongratz. 2013. Rotating disc diluter for fluid flows. U.S. Patent 8,434,512.
- Bergmann, M., R. Vogt, J. Szente, M. Maricq, and T. Benter. 2008. Using ejector diluters to sample vehicle exhaust at elevated pressures and temperatures. SAE Int. J. Engines 1 (1):1167–78. doi:10.4271/2008-01-2434.
- Burtscher, H., U. Baltensperger, N. Bukowiecki, P. Cohn, C. Hüglin, M. Mohr, U. Matter, S. Nyeki, V. Schmatloch, N. Streit, et al. 2001. Separation of volatile and non-volatile aerosol fractions by thermodesorption: Instrumental development and applications. J. Aerosol Sci 32 (4):427–42. doi:10.1016/S0021-8502(00)00089-6.
- Friedlander, S. K. 2000. Smoke, dust, and haze - fundamentals of aerosol dynamics. 2nd ed. New York, NY: Oxford University Press.
- Gehner, G. S., R. R. Graze, Jr, K. G. Iyer, K. A. Koch, H. P. Mallampalli, and J. R. Wagner. 2006. Method and apparatus for mixing gases. U.S. Patent 7,100,459.
- Giechaskiel, B., P. Bonnel, A. Perujo, and P. Dilara. 2019. Solid particle number (SPN) portable emissions measurement systems (PEMS) in the European legislation: A review. Int. J. Environ. Res. Public Health. 16 (23):4819. doi:10.3390/ijerph16234819.
- Hagino, H. 2017. Laboratory evaluation of nanoparticle penetration efficiency in a cylindrical counter flow denuder for non-specific removal of trace gases. Aerosol Sci. Technol. 51 (4):443–50. doi:10.1080/02786826.2016.1271939.
- Kitto, A.-M., and I. Colbeck. 2017. Filtration and denuder sampling techniques. In analytical chemistry of aerosols, 103–26. Boca Raton, FL: CRC Press.
- Kulkarni, P., P. A. Baron, C. M. Sorensen, and M. Harper. 2011. Nonspherical particle measurement: Shape factor, fractals, and fibers. In Aerosol meas. princ. tech. appl., ed. P. Kulkarni, P. A. Baron, and K. Willeke, 3rd ed., chapter 23, 510. Hoboken, NJ: John Wiley & Sons.
- Leckrone, K. J., and J. M. Hayes. 1997. Efficiency and temperature dependence of water removal by membrane dryers. Anal. Chem. 69 (5):911–8. PMID: 11536807.
- McMurry, P. H., and M. R. Stolzenburg. 1989. On the sensitivity of particle size to relative humidity for Los Angeles aerosols. Atmos. Environ. 23 (2):497–507. doi:10.1016/0004-6981(89)90593-3.
- Mikkaanen, P., and T. Koskinen. 2010. Device and a method for diluting a sample. U.S. Patent 7,759,131.
- Namieśnik, J., and W. Wardencki. 1999. Water vapour removal from gaseous samples used for analytical purposes: A review. International Journal of Environmental Analytical Chemistry 73 (4):269–80. doi:10.1080/03067319908032669.
- Smith, T. P., and D. J. Burke. 2012. Membrane gas dryers incorporating rotatable fittings. U.S. Patent 8,268,055.
- Ström, H., R. Ekdahl, and E. S. Harbuck. 1995. Gas sampling method and dilution tunnel therefor. U.S. Patent 5,410,907.
- Swanson, J., and D. Kittelson. 2010. Evaluation of thermal denuder and catalytic stripper methods for solid particle measurements. J. Aerosol Sci. 41 (12):1113–22. doi:10.1016/j.jaerosci.2010.09.003.
- Tavakoli, F., and J. S. Olfert. 2013. An instrument for the classification of aerosols by particle relaxation time: Theoretical models of the aerodynamic aerosol classifier. Aerosol Sci. Technol. 47 (8):916–26. doi:10.1080/02786826.2013.802761.
- Tavakoli, F., J. P. R. Symonds, and J. S. Olfert. 2014. Generation of a monodisperse size-classified aerosol independent of particle charge. Aerosol Sci. Technol. 48 (3):i–iv. doi:10.1080/02786826.2013.877121.
- TSI Incorporated. 2014. Model 3776 Ultrafine Condensation Particle Counter: Operation and Service Manual, Revision H. Shoreview, Minnesota: TSI Incorporated.
- Wehner, B., S. Philippin, and A. Wiedensohler. 2002. Design and calibration of a thermodenuder with an improved heating unit to measure the size-dependent volatile fraction of aerosol particles. J. Aerosol Sci 33 (7):1087–93. doi:10.1016/S0021-8502(02)00056-3.
- Yang, C., W. Zhao, B. Fang, X. Xu, Y. Zhang, Y. Gai, W. Zhang, D. S. Venables, and W. Chen. 2018. Removing water vapor interference in peroxy radical chemical amplification with a large diameter Nafion dryer. Analytical Chemistry. 90 (5):3307–12. doi:10.1021/acs.analchem.7b04830.