
Abstract
Surgical masks are one of the most widely used personal protective equipment to keep pandemics under control. Medical face masks help slow the spread of the coronavirus (SARS-CoV-2) that causes COVID-19. Due to their lower cost and comfort, surgical masks are mostly preferred for the prevention of the epidemic. There are dozens of different face masks in the market. However, users do not have the opportunity to scientifically evaluate masks and analyze their performance against viruses. Surgical masks are classified according to EN 14683 standard but, the testing standards has been standardized considering bacterial permeability. In this study, a simple surgical mask testing approach has been demonstrated based on Quartz Crystal Microbalance (QCM) technique and variety of commonly available surgical masks’ aerosol filtration performances were compared using the proposed approach. Then, SEM images of some masks were taken, and the results obtained from SEM analysis were compared with the results that was taken by proposed mask testing approach. In short, a simple direct mask test method taking into account the entire human aerosol distribution is proposed.
Copyright © 2022 American Association for Aerosol Research
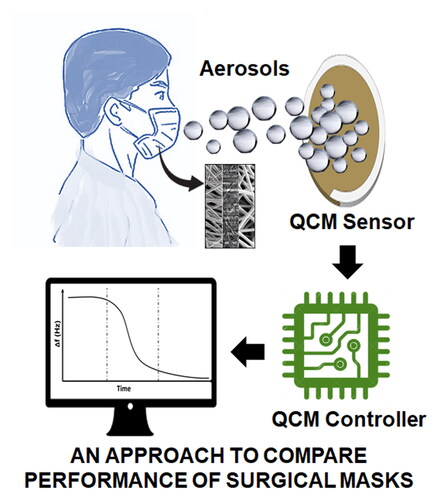
Graphical Abstract
EDITOR:
1. Introduction
The World Health Organization (WHO) announced on 11 March 2020 that the COVID-19 outbreak would be considered a global epidemic (Martin et al. Citation2020). On June 23, 2021, the number of registered COVID-19 cases reached 179+ million (Ghebreyesus Citation2020). The COVID-19 pandemic is affecting the world with global macroeconomic effects (McKibbin and Fernando Citation2020), global mobility (Renaud Citation2020), economic effects (Fernandes Citation2020), and global poverty. Pandemic continues to negatively affect the daily life of the individuals and still emerges as the most important issue for the world. COVID-19 disease, Severe Acute Respiratory Syndrome, is a pandemic caused by Coronavirus-2 (SARS-CoV-2) (Gorbalenya et al. Citation2020). One of the most important tools used to slow down pandemics is the use of protective masks.
As the spreading mechanism of the SARS-CoV-2 virus is revealed, the importance of using face masks is better understood as a personal protective equipment (PPE). It has been confirmed that people can spread the virus through exhaled droplets even without symptoms (Prather, Wang, and Schooley Citation2020). As a result, it is accepted by healthcare organizations that wearing a mask is one of the most recommended ways to help reduce the spread of coronavirus. The emergence of the B.1.1.7 coronavirus variant seen in the UK was confirmed on December 14, 2020, and this variant was reported to be 50% more contagious (Galloway et al. Citation2021). With these developments, the use of masks has gained more importance as a PPE and surgical masks are recommended to be worn instead of fabric masks due to their higher efficiency. It was understood that the performance of the masks is very important in protection. Therefore, simple and inexpensive face mask filtration performance test methods started to gain importance.
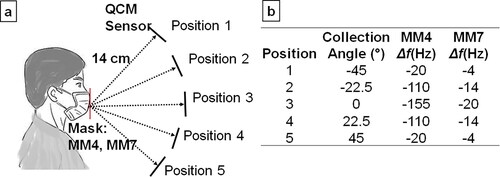
The surgical masks are effective to protect the user against infection, as well as reducing the spread of the virus to others by infected people. Therefore, the widespread use of masks and mask performance reduce the risk of getting sick at that rate. There are many types of protective masks on the market. Basically, medical (surgical) mask, N95 mask and fabric masks are preferred to limit virus spread. In , a representative cross-sectional view of particles captured by the mask and escaping from the mask is given.
Figure 1. (a) A sample representation of particles escaping from the mask. (b) Illustration of sectional view of particles escaping from the mask and filtered, and SEM images of mask layers (200X magnification).
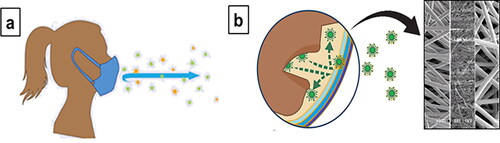
Surgical mask is a loose-fitting disposable mask protecting the user's nose and mouth from contact with droplets, splashes, and sprays that may contain microorganisms. Contrary to what is known, surgical masks have been developed for one-way protection of other people rather than the mask user (Sureka, Garg, and Misra Citation2020). Surgical masks are usually three layered masks, which consist of two sheets of “nonwoven” fabric sandwiching a melt blown layer in the middle. Especially, melt blown layer has more filtering capability. Surgical masks can protect the people around by reducing the exposure of others to the saliva and respiratory secretions of the person wearing the mask. The fabric mask is made to catch droplets that are released when the user speaks, coughs or sneezes. However, it can help reduce the spread of the virus by people with COVID-19 who are unaware of it. Respirators are tight fitting masks designed to protect the wearer. The most commonly used respirator type is N95 and these masks filter 0.3 µm particles with 95% efficiency (Sureka, Garg, and Misra Citation2020).
In order to test surgical masks, high-cost instruments such as Mask Bacterial Filtration Efficiency Tester (BFE), air permeability tester, face mask particle filtration efficiency tester, and surgical mask differential pressure tester are used (Forouzandeh, O'Dowd, and Pillai Citation2021; Tessarolo et al. Citation2021). A comprehensive overview of the standards and testing methods was published by Pillai et al. (Forouzandeh, O'Dowd, and Pillai Citation2021). Surgical masks are classified based on official standards as EN 14683 (2019) in Europe or ASTM F2100-19 (2019) [13][13][12][12][12][12][12] in the US. EN 14683:2019 standard classifies the surgical masks in two main categories according to their bacterial filtration efficiency test (BFE). Type I and Type II masks have a BFE ≥ 95% and BFE ≥ 98%, accordingly. The BFE test is one of the most widely used standards for testing performance of surgical masks.
A simple low-cost optical measurement method was demonstrated to test the efficacy of masks by Fischer et al. (Citation2020). However, the main limitation of the technique was the low collection efficiency of the camera aperture. Our technique is based on the any mass absorbed on the sensor surface, in our case it is aerosol mass. A testing protocol was presented by Fernandez et al. for evaluation of loose-fitting type masks based on two particles escaping (Mueller et al. Citation2020). An analytical system was developed to measure the percentage of particles escaping through the face masks using optical particle counter based on light scattering principle by Amendola et al. (Citation2020). An accessible mask screening approaches proposed for emergency evaluation of masks using an aerosol particle counter by Schilling et al. (Citation2021). Cloth materials filtration efficiency (FE), differential pressure (ΔP), and quality factor (QF) were measured for protection from the SARS-CoV-2 by Zangmeister et al. (Citation2020).
As known, the SARS-CoV-2 virus spreads by micro and nano droplets (aerosols) that come out of the mouth or nose. In this sense, it becomes important to what extent masks can prevent micro or nano droplets. In this study, a Quartz Crystal Microbalance (QCM)-based face mask particle filtration performance test have been proposed. Some volunteers were asked to wear face masks and blow on the sensor surface at specified standards. Droplets, in other words aerosols that could escape from the mask as a result of the blowing were absorbed on the QCM sensor, and the mass absorbed on the sensor was measured by QCM which is proportional to the amount of aerosol escaped from face masks. We did not convert the QCM sensor frequency shift to mass, because it is a viscoelastic mass with many unknown parameters. This is why we have only focused relative comparisons of frequency shifts for each mask. Eight different commercial surgical masks were tested using proposed approach.
Quartz Crystal Microbalance (QCM) is a real-time, surface-sensitive technique for analyzing surface interaction phenomena, thin film formation and its properties (Sauerbrey Citation1959). Briefly, it is a scientific instrument used to detect very small masses on the sensor surface at the nanograms scale. In the technique, mass changes are measured in real-time so that the mass increase or decrease can be tracked. QCM device designed for this purpose can be handheld instrument.
In this study, the amount of aerosol that could escape from the mask was measured using the QCM system. The amount of aerosol mass adsorbed on the QCM sensor is proportional to the sensor frequency shift. Thus, the effectiveness of surgical masks was revealed with the help of the QCM-based mask efficiency tester, which was developed using aerosol size distribution directly produced by humans instead of indirect methods. It is a very complex task to produce aerosols with a structure similar to the aerosols structure and distribution produced by humans. This is why we tested the surgical masks by human generated aerosols to have more realistic mask performance test results.
2. Material and methods
First of all, masks were purchased considering the positive user comments in internet sales stores. As known, users care more about mask comfort and prefer market perceptions over scientific methods. In order to test the masks, a QCM-based aerosol permeability test setup has been established. Mask test protocol has been developed to obtain reproducible and reliable results. Afterwards, the aerosol permeability data of the masks were obtained by performing QCM-based mask efficiency tests. According to this information, electron microscopy analyzes were performed on 3 masks with low, medium, and high aerosol permeability. Then, the final results were evaluated.
2.1. The proposed mask test method
In this study, a Phase-Locked Loop (PLL) based QCM system (flexQCM, FlexInst Scientific, Turkey) was used in order to assess the particle blocking performance of face masks. In the experiments, a 5 MHz gold coated AT-cut QCM sensors (flexSens, FlexInst Scientific, Turkey) were used without any sensor surface treatment. Gold coated QCM sensor surface water contact angle was measured 74° ± 2° which can be considered as hydrophilic surface. Since we preferred to have the water contact angle in this range, we did not apply extra surface treatment to sensor surface. Aerosols may get merged after they have been condensed to the sensor surface during relaxation on the high hydrophilic surfaces. On the contrary, it may not be possible to detect aerosols with QCM as they cannot attach to the surface on the hydrophobic surfaces.
QCM is a mass sensitive technique that can measure mass changes on the sensor surface at nano gram sensitivity. In this technique, mass on the sensor is measured in real time, thus allowing close monitoring of changes such as mass increase or decrease on the sensor surface (Lu, Czanderna, and Townshend Citation1987). More information is given in the Supporting Information. The schematic diagram of the PLL based QCM system and block diagram of QCM controller are given in , respectively. Experimental test setup is given in . QCM uses a AT-cut quartz sensor that vibrates at its own resonant frequency, and the resonant frequency of the sensor is monitored by a PLL (Phase-Locked Loop). PLL-based piezoelectric sensor was developed for the first time by Hu et al. (Citation2016). The temperature stability of the system is very important. Due to the properties of quartz, the resonance frequency of the QCM crystals depends on the temperature (Bradshaw Citation2000; Sauerbrey Citation1959). The room temperature and sensor temperature was kept at 22 °C during the experiments. Laboratory relative humidity (RH) level was measured 34%. The PLL-based QCM controller includes a high-bandwidth locked amplifier (LIA) to measure the sensor vibration amplitude and phase. There are two PID based feedback control systems to lock the phase and amplitude of the sensor signal. The phase lock feedback loop generates frequency shift data and the amplitude feedback loop produces a signal that can be correlated with the mechanical properties of the thin film on the sensor.
Figure 2. (a) Schematic diagram of the developed PLL based QCM system; (b) QCM controller block diagram; (c) experimental setup.
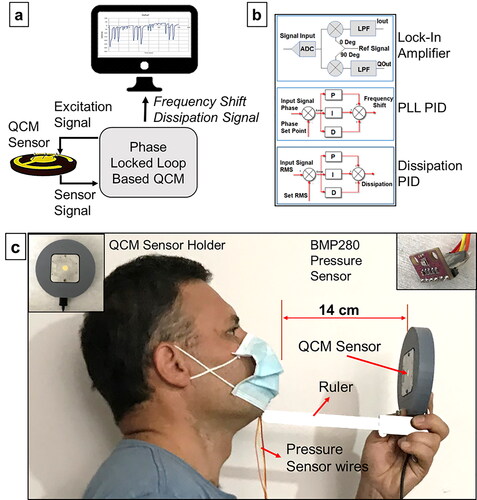
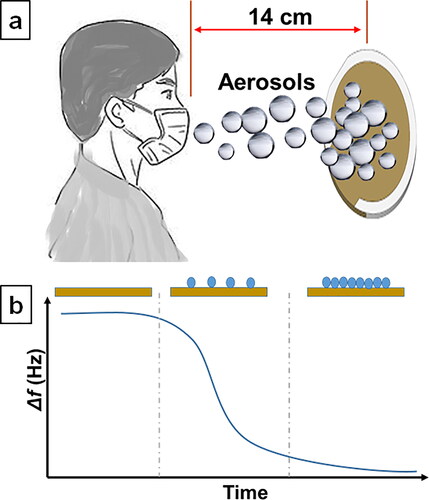
Mask test setup demonstration is given in . The subjects were asked to wear the mask in accordance with the standards specified by the manufacturer and then blow onto the QCM sensor surface, taking into account the protocol given in the “Development of Mask Test Protocol” section. The density of micro and nano droplets condensing on the sensor surface passing through the mask was measured simultaneously with the QCM system. The representative frequency shift graph referring to the condensation of aerosol on the surface is given in . The sensor resonance frequency decreases with the increase in mass accumulating on the sensor surface, and this frequency shift is proportional to the mass deposited on the sensor surface.
Figure 3. (a) Mask test setup with QCM; (b) frequency shift representation graph obtained by mass adsorption to the QCM sensor surface.
2.2. The proposed mask test protocol
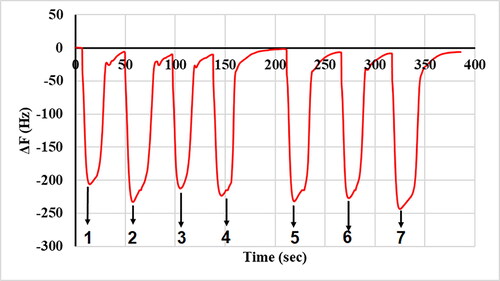
A test protocol has been developed in order to obtain reproducible results from individuals who perform the mask test. First of all, important parameters were taken into consideration in order to obtain reproducible results and decrease inaccuracies on human trials. These parameters were determined as blowing time and maximum pressure, mask face grip, distance between sensor and mask, and blowing angle. We noticed that some aerosols were flowing out through face seal leaks in our first experiments. Therefore, mask face grip one of the most important parameters to compare surgical face masks. We pressed the all mask borders with our fingers as a sealing gasket to ensure it is not leaking from borders in our all experiments. Reproducible results were obtained by standardizing the specified parameters. The mask user was asked to breathe at the maximum lung capacity and blow it toward the QCM sensor during specific time period as given in . It was noticed that the results were inconsistent due to the failure of the mask edges to grip the face well during blowing. Therefore, care has been taken to prevent air leaking from the edges of the mask during blowing. Mask elastic ear loops are tightened more and nose wires formed for the user nose to eliminate leakage problem. We mount a portable pressure sensor (BMP280, Bosch, Germany) into the mask with the resolution 0.01mbar to ensure there is no leakage and the mask user blows at the same pressure during all sets of surgical masks. Since the amount of aerosol falling on the sensor unit area depends on the distance and angle between the mask and the sensor, the mask user has been provided with a ruler to blow perpendicular to the sensor from a distance of 14 cm. In , the results obtained during and after the test protocol development phase using MM1 mask are given. After the test protocol was developed, reproducible results were obtained with an error rate of ± 12 Hz.
Figure 4. QCM frequency shift results obtained during and after the mask test protocol development phase. The time period from 0 to 380 sec shows the frequency shift result at different blowing time during parameter optimization. Repeatable results are obtained after standardizing blowing time, mask face grip, maximum pressure in the mask, the distance between QCM sensor and the mask, and blowing angle.
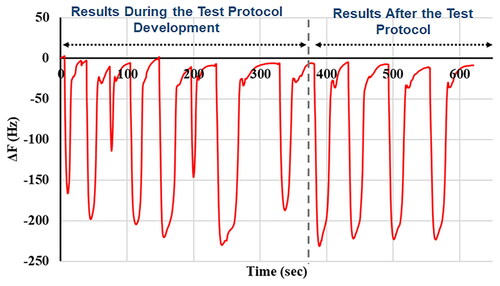
Table 1. Surgical mask aerosol permeability chart.
2.3. Mask types employed in experiments
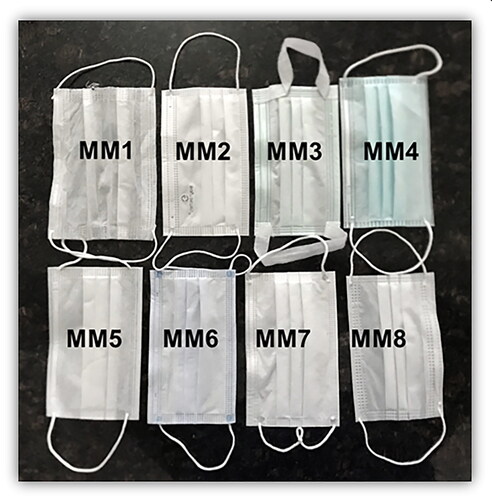
In the experiments, 8 different surgical masks at different price ranges were used. We preferred to use surgical masks in the experiments on purpose because generally public and low income communities prefer to use surgical masks to be protected due to its low cost. The main goal of the study is to propose a new mask testing method rather than testing different masks. The masks used are given in . In the experiments, full capacity blowing test was performed by the subjects and measurements were taken using the mask test setup. The experiments were conducted by human volunteers. In this way, it is thought that results closer to real life applications will be obtained. In the experiments, subjects with wide and average facial structure were used.
Figure 5. Surgical masks used in the experiments. All masks are triple-layered and have a nose wire.
3. Experimental results and discussion
End users do not have the opportunity to test their face masks with scientific methods. Because mask particle permeability tests are performed by high-cost devices that require a laboratory environment. In our study, an alternative direct, simple and low cost test method is proposed. As known, issues such as mask hygiene, its covering and particle filtering ability are important in protecting ourselves and our environment from the pandemic. The protection of the mask for both the user and other people is proportional to the particle filtering ability of the masks. This situation statistically reduces the risk of infection. In reality, consumers are not aware of the aerosol filtering differences between surgical masks at the market even if their labels refer to the same standard EN 14683. For that reason, they purchase any surgical mask considering their protection concerns. Actually, properly worn low quality surgical mask blocks coughing aerosols mostly.
We proposed a novel aerosol low cost surgical mask testing method for mask performance comparison but also it has some drawbacks. Test results variation between users is an expected situation, because of difference in mask coverage, facial structure, and body physiology. Maybe, it is not a disadvantage because we produce specific results for certain cases. Second limitation is the limited collection of aerosols. QCM sensor has 14 mm diameter, therefore we only measure the aerosols condensed to 14 mm QCM sensor. The technique is quite sensitive; we could be able to collect enough aerosols for mask comparison when the mask user blows 14 cm away from the QCM sensor. We forced the user to apply the procedure that had been optimized before the mask testing experiments. The technique also can be used for other cases as speaking, sneezing, and coughing. Third limitation, the technique is based on mass comparison condensed to sensor surface. We are not counting the number of particles or measuring size of particles.
3.1. Aerosol absorption and desorption kinetics
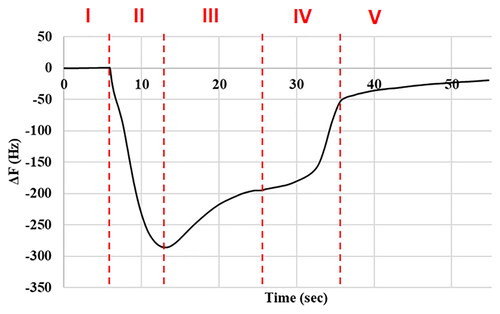
The mask test result patterns that had been obtained using QCM-based aerosol permeability tester were examined. shows the aerosol absorption and desorption kinetics on the QCM sensor. Any mass added to the QCM sensor decreases the resonance frequency of the sensor or vice versa. We should examine the by considering this information. We think, Zone I shows the state before aerosol condensation to the QCM sensor. Zone II shows the amount of aerosol escaped from the mask and absorbed onto the sensor during the surgical mask test. Zone III shows the aerosol evaporation kinetics that condenses to the sensor surface and then evaporates faster due to their smaller diameter. Zone IV represents the evaporation kinetics of larger diameter aerosols that reach the sensor surface and then evaporate slower. Zone V, on the other hand, represents the slow evaporation behavior due to human aerosols’ viscous structure.
Figure 6. QCM data of aerosol absorption and desorption kinetics on the QCM sensor surface. The data divided into 5 zones, I: before aerosol condensation onto QCM sensor, II: aerosols absorbed onto the sensor, III: desorption of aerosols with smaller diameters, IV: desorption of larger diameter aerosols and V: desorption of human viscous aerosols.
Similar absorption and desorption characteristics were observed in all experiments. We think, aerosol data characteristics captured by QCM can differ from person to person, especially sick person to healthy person. It needs to be further analyzed systematically.
3.2. Comparison of surgical masks
First of all, experimental conditions were optimized for robustness and repeatable tests. In blowing experiments, the subjects were blown to the sensor surface with a mask from 14 cm away perpendicular to sensor surface. It was noticed that some masks leaked air around their edges, preventing reproducible results. Reproducible results were obtained with an error rate of ± 12 Hz in the tests performed by tightening the mask rubber and especially fixing the chin and nose part during blowing. All measurements were repeated under the same conditions and each volunteer tested each mask for three times. QCM based surgical mask test average results for each mask and user are given in . Larger negative numbers, in other words frequency shifts, corresponds worse aerosol filtration performance of the mask.
Mask tests were carried out by 2 different mask users with different facial structures. Mask user 1 had longer face shape and user 2 had round face shape. In the tests, relatively close performance results were obtained for each mask. The reason for getting different results for the same mask among mask users is that the mask users have different facial structure and different blowing pressure. Additionally, two users can have different aerosol density and size distribution that is likely to cause different mask performance results. One of our sub-goals in this study is to answer the question of whether the same mask can perform differently for different people. We aim to get the performance of a surgical mask in average but also measure a mask performance for an individual.
In the experiments, it was seen that the MM7 mask had the lowest aerosol permeability performance and MM1 mask had poor aerosol permeability performance. Similar performance results were obtained with MM3 and MM4 masks. We can roughly divide the masks into 4 classes as low, under-medium, medium, and high performance as listed in . Surgical masks aerosol permeability test results for 3 different users is given in .
Figure 7. Surgical masks aerosol permeability test results for 3 different users.
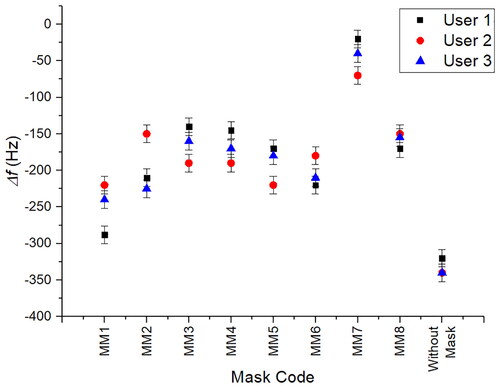
Table 2. Surgical mask aerosol permeability chart.
The measurement results are given in was collected with 0° collection angle as possible that corresponds Position 3 in . To understand the effect of the collection angle on the QCM measurements, aerosol collection was performed at different angles as in . We observed that the collection ratio was maximum when the sensor was positioned normal to the mask as in Position 3 in . The QCM data that were collected at different angles using MM4 and MM7 surgical masks are given in . If we assume the maximum collected particles as 100% at Position 3 for MM4 mask, only 71% of the aerosols are collected at Point 2 and 13% at Point 1. We observed similar behavior for symmetrical point as Position 2, Position 4 and Position 1, and Position 5.
Figure 8. (a) Illustration aerosol collection with respect to the mask at different angles. (b) The collected QCM data at different angles. Data was collected with an error rate of ± 12 Hz for MM4 and ± 2 Hz for MM7.
3.3. Surgical mask electron microscope analysis
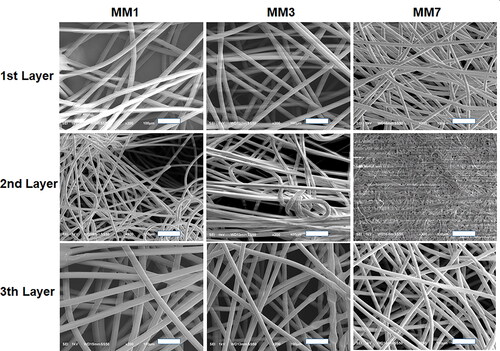
After the QCM-based aerosol permeability tests, the masks are classified as high, medium, medium-low, and low performance. Later, electron microscope analysis was performed on low, medium, and high performance masks. In this way, it was aimed to determine the relationship between the aerosol permeability result and the mask morphology. The obtained SEM analysis results are given in . In the MM1 mask, a low density fiber structure in the inner layer, a thinner and denser fiber structure with a heterogeneous distribution in the middle layer, and a fiber structure similar to the inner layer in the outer layer were observed. In MM3 mask, a denser and homogeneous fiber morphology was observed in all layers compared to MM1 mask. In the MM7 mask, a morphology similar to the MM3 mask was observed in the outer layer. In the middle layer, it was observed that the fiber structure showed a rather dense and homogeneous distribution compared to the other two masks. A much denser and homogeneous fiber structure was observed in the inner layer of the MM7 mask compared to the other 2 masks. It was observed that the SEM images taken were consistent with the results obtained with QCM. QCM-based mask aerosol permeability tests were obtained in average as −254 Hz for MM1 mask, -165Hz for MM3 mask and −45 Hz for MM7. MM1 and MM3 masks were relatively close to each other in terms of performance, and the performance of MM7 masks was observed to be much better. In the SEM analysis results, a similar fiber morphology was observed for MM1 and MM3 with better homogeneity. However, much denser fiber structure was seen in all layers in MM7, especially for 2nd layer.
Figure 9. SEM images for 3 different masks with low, medium, and high aerosol permeability, scale bar on SEM images = 100 µm.
3.4. The effect of mask washing on performance
As known, surgical masks are recommended to be used for a maximum of 4 h. However, it is not likely to replace the masks very often for people with low income. In this study, we also carried out the tests after washing and drying the masks used only once with soap in order to test the reusability of the masks. The tests were carried out with the novel mask test approach we developed. In the post-wash tests, MM1, MM3 and MM5 masks with low, medium and high aerosol permeability were used, respectively. No significant decrease in mask performance before and after washing was observed on these 3 masks. The tests obtained for MM3 are given in . In test 1 to 4, aerosol permeability test was performed using the new mask and frequency shift was measured between 205 and 232 Hz.
Figure 10. Analysis of the mask labeled MM3, which is used for the first time and reused after washing.
In the test 5 to 7, washed mask was used, and frequency shift was measured between 229 Hz and 242 Hz According to the test results, it has been seen that the masks can be used without losing performance after washing at least once more. We observed the same results for other two masks before and after washing with the same error margins.
3.5. Surgical mask testing standards and particle sizes of infectious aerosols
In this study, we do not aim to replace regulation approaches, it is aimed to evaluate a rapid assessment of the existing masks. On the other hand, the EN 14683 standard imposes two test parameters as a mean particle size (MPS) of 3.0 ± 0.3 µm and 1700–3000 CFUs of bacteria per test (Pourchez et al. Citation2021). These standards may guarantee the quality for blocking bacterial transmission but, it is clear that the particle size used in the BFE test cannot be a legitimate standard for determining the aerosol permeability performance for the aerosols including viral particles. Because, the virus diameter is stated to be around 100 nm if we consider the Sars-CoV-2 virus. These viral particles can travel easily in aerosols that are smaller than 3 µm.
Particle size distribution for the individuals is analyzed by Asadi et al. (Citation2019). They measured the aerosol particle size distribution while speaking loud, intermediate, and quiet. They get the similar particle size distribution for the 3 cases and the peak particle size measured about 1um which is out of focus of EN 14683 standard. Particle sizes of infectious aerosols was disused by Fennelly (Citation2020).
3.6. The effect of velocity on filtration efficiency
Face velocity can be defined as the velocity of the particles as they leave the mouth. It has a non-negligible effect on the mask filtration performance that decreases with the increasing face velocity (O'Kelly et al. Citation2020). Mask performance decreases with the increasing face velocity. An adult coughing and breathing face velocity were measured 16.5 m/s and 1.4 m/s, respectively (Tang et al. Citation2013; Zhu, Kato, and Yang Citation2006). We can assume that the blowing face velocity that we used in our experiments should be roughly in coughing face velocity range. We tested the masks MM4 and MM7 under low and high face velocity conditions. We observed that MM7 performed better at high face velocity compared with MM4 as the data summarized in . Distance between mask and QCM sensor for low and high face velocity tests are set to 3 cm and 22 cm, respectively. We proportioned high face velocity and low face velocity QCM frequency shifts to compare the masks for both cases as in .
Table 3. Surgical mask aerosol permeability chart. LFV (low face velocity), HFV (high face velocity).
3.7. Comparison of results with optical microscope based mask testing method
A validation test is required to demonstrate the functionality of the proposed methods. Unfortunately, we do not have access to standard mask testers such as PFE (particle filtering efficiency) to compare our approach with existing standard high cost instruments. Therefore, we proposed another low cost method and compared the results with QCM based testing approach. We collected the aerosols onto a silicon wafer for the masks coded as MM1, MM4, and MM7 under the same conditions. After 60 s, we used an optical microscope with 50X objective to capture the aerosol distribution condensed to silicon wafer. We analyzed the particle distribution and density within 6 cm diameter using ImageJ open source software. The areal aerosols distribution on a silicon wafer for MM4 mask is given in . Each image was taken along the X axis at 1.5 cm intervals and “0” corresponds to center of the wafer. The results show that the aerosol distribution in a 6 cm diameter is relatively homogeneous.
Figure 11. An example optical microscope image of aerosols distribution and areal coverage on the silicon wafer exposed to aerosols using MM4 mask. Each picture was taken along the X axis at 1.5 cm intervals and “0” corresponds to center of the wafer. Images area = 150 x 200 µm2.
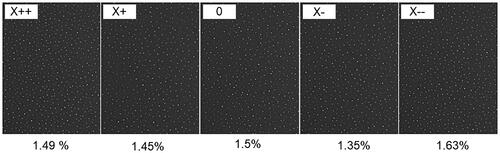
The areal aerosols coverage for MM1, MM4 and MM7 on a silicon wafer was 3.05 ± 0.15%, 1.48 ± 0.15% and 0.36 ± 0.15% in average, respectively. A representative aerosol distribution for the three masks is given in . We can conclude that the results obtained with the optical microscope-based and QCM-based test method are consistent. Comparison of mask test methods for the MM4 and MM7 masks is reported in .
Figure 12. An example optical microscope image of aerosols and areal coverage on the silicon wafer. The aerosols are marked red in ImageJ for particle counting.
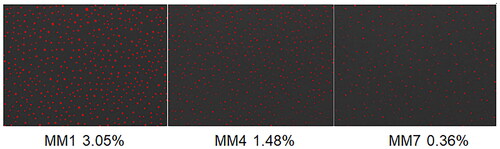
Table 4. Comparison of mask test methods for the MM4 and MM7 masks.
4. Conclusion
In this study, we developed a novel low cost face mask testing approach based on Quartz Crystal Microbalance technique. Most used standard mask testing methods are Mask Bacterial Filtration Efficiency Tester (BFE), air permeability tester, face mask particle filtration efficiency tester, and medical mask differential pressure tester, but these methods are bulky and high cost instruments. BFE test may guarantee the quality for blocking bacterial transmission but, it cannot be a legitimate standard for determining the performance for viral particles sized aerosols.
We aimed to suggest a direct mask testing technique that directly uses the aerosols generated by humans. First, we designed an open QCM sensor holder to be able to collect the aerosols on the sensor surface. We developed a mask testing procedure to measure repeatable and robust results. The testing approach was used on commercially available surgical masks. Eight different surgical masks were procured through online stores and the aerosol filtering performances of the masks were analyzed using the novel mask testing approach. As a result of the tests, 3 masks with low, medium, and high aerosol filtering performance were selected and SEM analyzes of these masks were performed. Then, the results obtained with SEM and the mask test system were associated. We observed that mask fabric fiber morphology, homogeneity, pore structure were effecting the mask particle filtration performance. We found that the proposed approach was effective to compare the performances of the face masks very quickly. It was also investigated whether there were performance losses after mask washing, and it was seen that there was no significant performance loss after the first wash. As a result, in this study, a new simple and fast, low-cost direct mask comparison test method using human subjects is proposed.
References
- Amendola, L., M. T. Saurini, F. D. Girolamo, and F. Arduini. 2020. A rapid screening method for testing the efficiency of masks in breaking down aerosols. Microchem. J. 157:104928. doi:10.1016/j.microc.2020.104928.
- Asadi, S., A. S. Wexler, C. D. Cappa, S. Barreda, N. M. Bouvier, and W. D. Ristenpart. 2019. Aerosol emission and superemission during human speech increase with voice loudness. Sci. Rep. 9 (1):10. doi:10.1038/s41598-019-38808-z.
- Astm f2100–19 2019. - Standard specification for performance of materials used in medical face masks.
- Bradshaw, L. 2000. Understanding piezoelectric quartz crystals. RF Time and Frequency 8:50–8.
- En 14683 + ac 2019. Medical face masks - requirements and test methods (includes amendment: 2019).
- Fennelly, K. P. 2020. Particle sizes of infectious aerosols: Implications for infection control. Lancet Respir. Med. 8 (9):914–24. doi:10.1016/S2213-2600(20)30323-4.
- Fernandes, N. 2020. Economic effects of coronavirus outbreak (COVID-19) on the world economy (ssrn scholarly paper id 3557504). Social Sci. Res. Netw. Available at https://papers.ssrn.com/sol3/papers.cfm?abstract_id=3557504
- Fischer, E. P., M. C. Fischer, D. Grass, I. Henrion, W. S. Warren, and E. Westman. 2020. Low-cost measurement of face mask efficacy for filtering expelled droplets during speech. Sci. Adv. 6 (36) eabd3083. doi:10.1126/sciadv.abd3083.
- Forouzandeh, P., K. O'Dowd, and S. C. Pillai. 2021. Face masks and respirators in the fight against the covid-19 pandemic: An overview of the standards and testing methods. Saf. Sci. 133:104995. doi:10.1016/j.ssci.2020.104995.
- Galloway, S. E., P. Paul, D. R. MacCannell, M. A. Johansson, J. T. Brooks, A. MacNeil, R. B. Slayton, S. Tong, B. J. Silk, G. L. Armstrong, et al. 2021 Emergence of sars-cov-2 B.1.1.7 Lineage - United States, December 29, 2020-January 12, 2021. Morb. Mortal. Wkly. Rep. 70 (3):95–9. doi:10.15585/mmwr.mm7003e2.
- Ghebreyesus, T. A. 2020. Who director-general’s opening remarks at the media briefing on covid-19-11 March 2020. World Health Organization 11. https://www.who.int/director-general/speeches/detail/who-director-general-s-opening-remarks-at-the-media-briefing-on-covid-19-11-march-2020
- Gorbalenya, A. E., S. C. Baker, R. Baric, R. J. d. Groot, C. Drosten, A. A. Gulyaeva, B. L. Haagmans, C. Lauber, A. M. Leontovich, and B. W. Neuman. 2020. Severe acute respiratory syndrome-related coronavirus: The species and its viruses–a statement of the coronavirus study group. doi:10.1101/2020.02.07.937862.
- Hu, Z., J. Hedley, N. Keegan, J. Spoors, B. Gallacher, and C. McNeil. 2016. One-port electronic detection strategies for improving sensitivity in piezoelectric resonant sensor measurements. Sensors 16 (11):1781. doi:10.3390/s16111781.
- Lu, C., A. Czanderna, and A. Townshend. 1987. Applications of piezoelectric quartz crystal microbalances. Anal. Chim. Acta 199:279–doi:10.1016/S0003-2670(00)82840-8.
- Martin, A., M. Markhvida, S. Hallegatte, and B. Walsh. 2020. Socio-economic impacts of covid-19 on household consumption and poverty. EconDisCliCha. 4 (3):453–79. doi:10.1007/s41885-020-00070-3.
- McKibbin, W., and R. Fernando. 2020. Global macroeconomic cooperation in response to the COVID-19 pandemic: a roadmap for the G20 and the IMF. Oxford Rev. Economic Policy, 36:S297–S337.
- Mueller, A. V., M. J. Eden, J. M. Oakes, C. Bellini, and L. A. Fernandez. 2020. Quantitative method for comparative assessment of particle removal efficiency of fabric masks as alternatives to standard surgical masks for PPE. Matter 3 (3):950–62. doi:10.1016/j.matt.2020.07.006.
- O'Kelly, E., S. Pirog, J. Ward, and P. J. Clarkson. 2020. Ability of fabric face mask materials to filter ultrafine particles at coughing velocity. BMJ Open. 10 (9):e039424. doi:10.1136/bmjopen-2020-039424.
- Pourchez, J., A. Peyron, Y. Montigaud, C. Laurent, E. Audoux, L. Leclerc, and P. O. Verhoeven. 2021. New insights into the standard method of assessing bacterial filtration efficiency of medical face masks. Sci. Rep. 11 (1):1–11. doi:10.1038/s41598-021-85327-x.
- Prather, K. A., C. C. Wang, and R. T. Schooley. 2020. Reducing transmission of sars-cov-2. Science 368 (6498):1422–4. doi:10.1126/science.abc6197.
- Renaud, L. 2020. Reconsidering global mobility–distancing from mass cruise tourism in the aftermath of covid-19. Tourism Geograph. 22 (3):679–11. doi:10.1080/14616688.2020.1762116.
- Sauerbrey, G. 1959. Verwendung von schwingquarzen zur wägung dünner schichten und zur mikrowägung. Z Physik 155 (2):206–22. doi:10.1007/BF01337937.
- Schilling, K., D. R. Gentner, L. Wilen, A. Medina, C. Buehler, L. J. Perez-Lorenzo, K. J. G. Pollitt, R. Bergemann, N. Bernardo, and J. Peccia. 2021. An accessible method for screening aerosol filtration identifies poor-performing commercial masks and respirators. Journal of Exposure Sci Environ Epidemiol. 31: 943–952. doi: 10.1038/s41370-020-0258-7.
- Sureka, B., M. K. Garg, and S. Misra. 2020. N95 respirator and surgical mask in the pandemic of covid-19. Ann. Thorac. Med. 15 (4):247–8. doi:10.4103/atm.ATM_264_20.
- Tang, J. W., A. D. Nicolle, C. A. Klettner, J. Pantelic, L. Wang, A. B. Suhaimi, A. Y. L. Tan, G. W. X. Ong, R. Su, C. Sekhar, et al. 2013. Airflow dynamics of human jets: Sneezing and breathing - potential sources of infectious aerosols . PLoS One. 8 (4):e59970. doi:10.1371/journal.pone.0059970.
- Tessarolo, F., G. Nollo, D. Maniglio, M. Rigoni, L. Benedetti, F. Helfer, I. Corradi, L. Rovati, A. Ferrari, M. Piccini, et al. 2021. Testing surgical face masks in an emergency context: The experience of Italian laboratories during the covid-19 pandemic crisis. IJERPH. 18 (4):1462. doi:10.3390/ijerph18041462.
- Zangmeister, C. D., J. G. Radney, E. P. Vicenzi, and J. L. Weaver. 2020. Filtration efficiencies of nanoscale aerosol by cloth mask materials used to slow the spread of sars-cov-2. ACS Nano. 14 (7):9188–200. doi:10.1021/acsnano.0c05025.
- Zhu, S., S. Kato, and J.-H. Yang. 2006. Study on transport characteristics of saliva droplets produced by coughing in a calm indoor environment. Build. Environ. 41 (12):1691–702. doi:10.1016/j.buildenv.2005.06.024.