
 ?Mathematical formulae have been encoded as MathML and are displayed in this HTML version using MathJax in order to improve their display. Uncheck the box to turn MathJax off. This feature requires Javascript. Click on a formula to zoom.
Abstract
Ice nucleating particles (INPs) impact cloud properties and precipitation processes through their ability to trigger cloud glaciation. Dust and bioparticles are two important sources of INPs that have markedly different atmospheric loadings and ice nucleating efficiencies. In-situ identification of the sources of INPs in clouds has been accomplished using single particle mass spectrometry (SPMS). However, external mixtures of dust and bioparticles present a unique challenge as they have overlapping mass spectral ion signatures, complicating their unambiguous identification. This study presents a detailed discussion of dust and bioparticle SPMS signatures, uniting data from a broad array of studies. As emphasized, the ion signals from both dust and bioparticles are highly sensitive to ionization conditions. To understand the observed variations, we characterize the mass spectral dependence of distinct dust and bioparticle samples using total positive ion intensity (TPII) as an indicator of the laser pulse energy each particle encountered. Through this analysis, a broad range of characteristic biogenic low intensity ion peaks that may be useful to distinguish bioparticles from dust became apparent and are highlighted. Insights informed by this analysis were utilized to identify bioparticles in ambient SPMS data. Ambient particles exhibiting both dust and characteristic biogenic spectral fingerprints were excluded from the bioparticle classification. Although bioparticles only made up 0.2% of all sampled particles, their abundance was moderately correlated with INP concentrations measured at −15 °C.
Copyright © 2022 American Association for Aerosol Research
EDITOR:
1. Introduction
Dust and primary bioparticles have been shown to be the most effective ice nucleating particles (INPs) in field and lab studies. INPs trigger the formation of atmospheric ice at temperatures higher than the homogeneous freezing point of water at ∼−38 °C (DeMott et al. Citation2010). Because only 1 in 106 of all particles in the atmosphere will induce freezing at −20 °C (Rogers et al. Citation1998), INPs exert an outsized influence upon clouds and precipitation by inducing cloud glaciation (DeMott et al. Citation2010). Dust has the highest atmospheric loading by mass of any aerosol source (Andreae and Rosenfeld Citation2008; Engelstaedter, Tegen, and Washington Citation2006; Zender Citation2004) and is generally estimated to represent the largest fraction of INP by number at temperatures lower than −20 °C (Kanji et al. Citation2017). While dust particles can activate at higher temperatures depending on their mineralogy and organic content (Atkinson et al. Citation2013; Hill et al. Citation2016; Tobo et al. Citation2014), bioparticles are generally assumed to be more efficient nucleators at temperatures above −15 °C and may be particularly important due to their influence upon secondary ice processes that occur in these temperature ranges.
Due to a limited number of measurements isolating the nuclei present in cloud droplets, it has yet to be directly demonstrated that bioparticle INPs play a role in cloud ice-processes (Fröhlich-Nowoisky et al. Citation2016). Bioparticles include whole organisms (e.g., bacteria), viruses, spores, pollen, and cell fragments/excretions with particle diameters ranging from nanometers to hundreds of microns (Fröhlich-Nowoisky et al. Citation2016). While bioparticles and their fragments can be internally mixed with other particles such as dust (e.g., Yamaguchi et al. Citation2012), we are primarily interested in cellular particles or particles comprised of undecomposed cellular fragments. The breadth of potential sources coupled with their rarity as INPs increase the difficulty of detection and unambiguous source identification (Kanji et al. Citation2017).
Many offline techniques have been utilized to identify bioparticles, including cultures, immunological assays, microscopy, and mass spectrometry (Després et al. Citation2012 and references therein). These techniques require lengthy sampling periods and specialized handling and preservation techniques which can add uncertainty and bias to the measurements (Després et al. Citation2012). There is a limited understanding of the concentrations of bioparticles at altitudes where clouds exist (Fröhlich-Nowoisky et al. Citation2016; Twohy et al. Citation2016), which is due to the fact that techniques that require long sampling times are not a good match for aircraft studies.
Single particle mass spectrometers (SPMS), such as aerosol time-of-flight mass spectrometry (ATOFMS), are uniquely suited for directly identifying INP sources in clouds because they are aircraft-compatible and can distinguish between a wide variety of particle sources. In previous studies, the presence of ion markers 26CN− and 42CNO−, have been used to identify the presence of organic nitrogen species, and 79PO3−, from phosphates, in single particle dust mass spectra and to classify a distinct internally mixed “biological-dust” particle type, where the biological species have been postulated to be related to the presence of bacteria, fungal spores, or plant detritus (Creamean et al. Citation2013; Pratt et al., 2009). These ion markers are ubiquitous in cellular (defined as whole cells) single particle mass spectra (e.g., Cahill et al. Citation2015; Czerwieniec et al. Citation2005; Fergenson et al. Citation2004; Steele et al. Citation2003; Zawadowicz et al. Citation2017). However, 26CN−, 42CNO−, and 79PO3− signals have also been frequently reported in dust mass spectra (Creamean et al. Citation2014; Marsden et al. Citation2019; Schmidt et al. Citation2017; Silva, Carlin, and Prather Citation2000; Zawadowicz et al. Citation2017), including mass spectra of mineral dust standards, which contain small amounts of organic material, and no cellular material. As summarized by Zawadowicz et al. (Citation2017), the presence of 26CN−, 42CNO−, or 79PO3− ion markers alone cannot be used as indicators of the presence of biological material.
To better address this ambiguity, Zawadowicz et al. (Citation2017) proposed a new method for identifying single particle mass spectra containing “biological” material. Standards of biological and inorganic particles were analyzed using Particle Analysis by Laser Mass Spectrometry (PALMS), and the data simplified to a two-dimensional space of the ratios of 79PO3−/63PO2− versus 26CN−/42CNO− ion signals. A supervised machine learning algorithm was used to distinguish between two particle classes with 97% accuracy within this space. The applicability of this approach to other SPMS datasets, regardless of the specific algorithm, training set, or parameters specified, largely depends on the natural division between biological and inorganic spectra in this two-dimensional space. However, factors in addition to composition can influence individual mass spectra, and may affect partitioning within this 2-D space. For instance, individual aerosol particles analyzed using SPMS have been shown to exhibit a high degree of variability in relative ion signals, that depend in varying degrees on factors such as particle size (Reinard and Johnston Citation2008), degree of particle desorption (Carson, Johnston, and Wexler Citation1997), the wavelength of the desorption/ionization laser (Thomson, Middlebrook, and Murphy Citation1997), and the photon flux experienced by the aerosol within the laser beam (Wenzel and Prather Citation2004). Mass spectral signatures generated by aerosolized bacterial cells have been shown to be particularly sensitive to the photon flux experienced by each particle (Steele et al. Citation2003, Citation2005).
Given the variability in dust and bioparticle mass spectra both within single particle data sets and across SPMS designs, it is important to understand the “landscape” that these mass spectral signatures can occupy in order to more accurately distinguish between them. Methods developed to discriminate between the two types utilizing a few select ion markers with specific ratios or thresholds may be useful for a specific instrument and operating parameters, however such methods cannot easily be extended to all single particle datasets.
In this study, the dependence of dust and bioparticle mass spectral fingerprints on laser energy density is explored by examining the mass spectra as a function of total positive ion intensity (TPII). Using this approach, we identify ion markers that can be used to discriminate between the two particle types but that have been rarely mentioned in previous studies of atmospheric aerosols. These ion markers are used to identify single cells in an ambient dataset at a coastal site in California. The temporal evolution of these bioparticles is compared against other real-time bioparticle measurements, as well as measured concentrations of INPs active at −15 °C (INP-15) in order to quantify the relative contributions of individual cells to INP populations.
2. Materials and methods
2.1. Aerosol standards
Dust and bioparticle standards in this study were analyzed with an aircraft-aerosol time-of-flight mass spectrometer (A-ATOFMS; Pratt et al. Citation2009b) at the Aerosol Interaction and Dynamics in the Atmosphere (AIDA) facility at the Karlsruhe Institute of Technology (KIT) during the Fifth International Ice Nucleation Workshop (FIN-1) in November 2014 (DeMott et al. Citation2018). During this portion of the workshop, a total of 10 single particle mass spectrometers from around the world sampled a common set of aerosol standards and participated in cloud expansion experiments. Additional aerosolized unicellular algal and cyanobacteria standards were analyzed at the University of California, San Diego (UC San Diego) using the A-ATOFMS outfitted with an aerodynamic lens optimized for the transmission of large particles (John F. Cahill et al. Citation2014). Finally, Arizona Test Dust (ATD) was analyzed with a nozzle-ATOFMS (Gard et al. Citation1997) at UC San Diego. A summary of the samples is provided in .
Table 1. Summary of dust and biological samples.
2.1.1. FIN-1 sampling details
Experiments were conducted in the Aerosol Preparation Chamber (APC) at the AIDA facility. The APC is a 4 m3 stainless-steel cylindrical vessel of controlled pressure used for characterizing aerosols. Samples of pure dust and bacteria were introduced into the APC during separate experiments. A more complete description of these samples is given in . A rotating brush generator was used to disperse the mineral dust samples into a stream of particle free synthetic air. Larger dust particles were removed using an inertial impactor. For Snomax, a suspension of 1 g in 200 mL of ultrapure water (18.2 MΩ) was created. Bacterial samples were cultured on agar, and suspensions created at concentrations of 109 cell mL−1 of ultrapure water. The Snomax and bacterial suspensions were freshly prepared before dispersion into the APC, and were aerosolized using a two-component jet device, which uses particle free synthetic air to disperse a liquid flow (Wex et al. Citation2015).
2.1.2. UC San Diego study details
Details of sample preparation and aerosolization for the algal and cyanobacteria standards analyzed at UC San Diego have been previously published (Cahill et al. Citation2014, Citation2015). Cell solutions were nebulized by a C-type concentric nebulizer (Precision Glassblowing, CO) using dry nitrogen. The cell solution was stirred to prevent cell agglomeration and settling. The aerosol stream was dried by a heated flow tube and diffusion dryer and the dried cells were then introduced into the A-ATOFMS. The Arizona Test Dust sample was placed in a sealed flask and aerosolized using a flow of filtered air and then sampled into a nozzle-ATOFMS.
2.2. ATOFMS analysis
Single particle mass spectra were acquired using an aerosol time-of-flight mass spectrometer (nozzle-ATOFMS; Gard et al. Citation1997) and an aircraft aerosol time-of-flight mass spectrometer (A-ATOFMS; Pratt et al. Citation2009b). While these instruments are conceptually the same, they employ different aerosol focusing methods and use different mass spectrometers. The ATOFMS was configured with a nozzle-skimmer configuration instead of an aerodynamic lens, and thus sampled larger particles than the A-ATOFMS, which uses the aerodynamic lens described in Pratt et al. (Citation2009b). For the algal and cyanobacteria standards analyzed at UC San Diego, a specialized lens that optimizes the transmission of particles between 4 and 10 µm (Cahill et al. Citation2014) was used with the A-ATOFMS and this configuration is hereafter referred to as LP-ATOFMS. We note that the inlet is the only difference between these configurations. Also, the ATOFMS uses a linear TOF while the A-ATOFMS employs a Z-TOF. While mass spectra cannot be directly compared between these two instruments, mass spectral features and general trends with regard to TPII should still be similar.
As these instruments have been described previously, we provide only a short overview here. Particles are introduced into the instrument through either a converging nozzle and series of skimmers (ATOFMS), or an aerodynamic lens (A-ATOFMS) in order to collimate smaller particles into a tight beam. Particle velocity, calculated from the intersection of the particle beam with two continuous wave lasers (532 nm; Nd:YAG), is used with external calibration to compute particle vacuum aerodynamic diameter (Dva). A pulsed 266 nm laser (Nd:YAG; 8 ns pulse width, 1.0–1.3 mJ pulse−1, focused to a 700 µm diameter spot size, peak power ∼108 W cm−2) desorbs and ionizes species from individual particles, and positive and negative ions are analyzed using a time-of-flight mass spectrometer. Data were imported into Matlab (The MathWorks, Inc.) and analyzed using the single particle mass spectrometry analysis and visualization software toolkit FATES (Sultana et al. Citation2017).
Particles analyzed by ATOFMS during the CalWater-2015 field campaign were clustered using a neural net algorithm (Rebotier and Prather Citation2007; Song et al. Citation1999) as detailed in Martin et al. (Citation2017). Dust particles were identified based upon their characteristic mass spectra (Schmidt et al. Citation2017; Silva and Prather Citation2000). Hereafter Dust-CW refers to particles classified as dust during CalWater-2015. A total of 65,534 of the 1,220,818 particles measured by the ATOFMS were classified as Dust-CW (5.4%). A separate methodology was used to identify bioparticles and is described in Sec. 3.4 and the SI.
2.3. CalWater-2015 field campaign
The CalWater-2015 field campaign was conducted at the Bodega Marine Laboratory in Bodega Bay, California (38.3°N, 123.1°W) from January 15 to March 8, 2015. Details of this study have been published elsewhere (Martin et al. Citation2017), so only a short overview is provided here. Measurements of aerosol size, number, and composition were made in a UC San Diego mobile laboratory. Section 2.2 contains details on ATOFMS sampling and analysis. Bioparticle concentrations were measured with a wideband integrated bioaerosol sensor (WIBS-4; Droplet Measurement Technologies, Inc.; hereafter WIBS) in a mobile lab operated by Colorado State University (CSU) and North Carolina State University (NCSU) (Sec. 2.3.1). Ambient aerosol samples were collected and analyzed for their INP concentrations (Sec. 2.3.2).
2.3.1. Online bioaerosol concentrations
The wideband integrated bioaerosol sensor (WIBS) measures the size, asymmetry factor, and fluorescence signal of particles with optical diameters between 0.5–20 µm (Hirst et al. Citation2004). Fluorescence is measured in three different channels: FL1, excitation 280 nm, emission 310–400 nm; FL2, excitation 280 nm, emission 420–650 nm; FL3, excitation 370 nm, emission 420–650 nm. Due to limited sensitivity to signals produced by small particles (Gabey et al. Citation2010, Citation2011), data analysis was limited to fluorescent particles above 0.8 µm.
Background fluorescence signal was calculated following Savage et al. (Citation2017). Force-triggered sampling of filtered air was conducted for 5 min and the background signal, Ebackground,i, calculated using the following equation
(1)
(1)
where
is the average signal in channel i, for a force-triggered sample and
is the standard deviation of the force triggered sample signal. Ebackground,i was subtracted from each particle for each channel to yield the final fluorescence signal. Particles were grouped into types based upon their fluorescence signal in each channel using criteria defined in previous studies (Gabey et al. Citation2010; Perring et al. Citation2014; Wright et al. Citation2014) and summarized in Table S1.
2.3.2. Offline sample collection for in analysis
Ambient aerosols were sampled for offline INP measurements using impinger samplers (Willeke, Lin, and Grinshpun Citation1998, three-piece 5 mL impinger; SKC Inc. BioSampler®). Here, we provide a short overview. A full description of these methods can be found in the online supplementary information (SI). Ambient aerosols were impinged into 20 mL ultrapure water (HPLC Grade Submicron Filtered Water, Fisher Chemical Cat. No. W5-4) at a height of 1 m, and a flow rate of 12.5 L min−1 for ∼4 h. Field blanks, containing only the ultrapure water used to prepare the impinger, were generated for each sampling period. The ambient and field blank samples were immediately frozen after collection and thawed prior to analysis. INP concentrations of samples were measured using the NCSU Cold Stage (Hader, Wright, and Petters Citation2014; Wright and Petters Citation2013) with modifications described in (Yadav et al. Citation2019). Samples were divided into ∼200 1 µL volume drops onto hydrophobic glass cover slides (Siliconized Glass Square Cover Slides, Hampton Research Cat. No. HR3-215). The cover slides were placed on top of the cold stage, and droplets were cooled at a rate of 2 K min−1. Freezing events were detected using an optical change in the droplets’ brightness and recorded every 5 s using a digital camera. Freeze event detection was aided using automated event detection combined with human validation; the source code is freely available (Wright and Petters, Citation2019). Each sample was tested three times, INP concentrations were binned into 1 K temperature intervals and the mean concentration and 95% confidence interval reported. Points where ambient concentrations are less than the field blank INP concentrations are removed from the dataset.
3. Results and discussion
To facilitate the discrimination between dust and bioparticles, this study provides a detailed exploration of the single particle mass spectral differences. Section 3.1 reviews historical SPMS descriptions of dust and bioparticles. Section 3.2 provides the first description of cellular and dust particle spectra as a function of TPII. Section 3.3 gives a detailed review of ion markers in cellular particle standards analyzed both in this study and previous works. In Sec. 3.4, cellular particles are identified in an ATOFMS dataset from a coastal field study and compared against co-located bioparticle and INP measurements.
3.1. Common “biological” ion markers detected in dust particle spectra
Consistent with previous SPMS studies (Creamean et al. Citation2014; Schmidt et al. Citation2017; Silva, Carlin, and Prather Citation2000; Zawadowicz et al. Citation2017), 26CN−, 42CNO−, and 79PO3− ion signals were frequently detected in dust samples analyzed in this work (). Note that ATD are not directly comparable to the other dust spectra as ATD was analyzed by a different ATOFMS, but insight can still be gleaned from these samples by studying trends within the dataset. In agreement with previous SPMS dust analyses (Marsden et al. Citation2019; Schmidt et al. Citation2017), single particle mass spectra of soil dust samples, especially those collected from noted vegetation areas (Ethiopian soil dust, ESD; and Argentinian soil dust, ASD), generally had higher relative ion signals from organic nitrogen ion markers 26CN− and 42CNO− than other mineral dust samples (). Yet due to ion signal variations within each dust sample, there is limited ability to utilize these marker ions alone to definitively identify any single mass spectrum as originating from a relatively “organic-rich” soil dust particle. Furthermore, as 26CN− and 42CNO− are readily produced from mineral dust, as shown here (Figure S2) and in Zawadowicz et al. (Citation2017), there is no way to conclusively link the ion signals to whole or fragmented biological cells.
Figure 1. Distribution of relative ion signals for (a) 26CN−, (b) 42CNO−, (c) 79PO3− from a variety of soil and mineral dust samples. Warmer colors indicate higher relative intensities. The ATD sample was analyzed with a different ATOFMS than the other samples, and thus the relative ion distributions are not directly comparable.
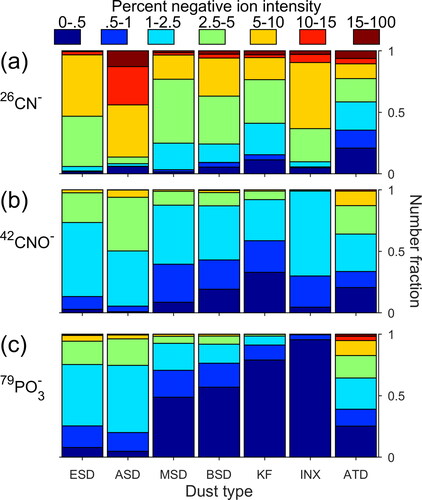
Figure 2. (a) Individual mass spectra for all cellular standards (red) and dust standards (black) plotted in 79PO3−/63PO2− versus 26CN−/42CNO− space. The blue box in the inset highlights a region of high overlap between the two particle types. Individual (b) ASD and (c) Ps mass spectra in 79PO3−/63PO2− versus 26CN−/42CNO− space. (d) Individual mass spectra for all Cell-type (red) and Dust-CW (black) particles plotted in 79PO3−/63PO2− versus 26CN−/42CNO− space. The red box in the inset highlights a region of high overlap between the two particle types. Individual (e) Dust-CW and (f) Cell-type mass spectra in 79PO3−/63PO2− versus 26CN−/42CNO− space. Warmer shades indicate higher total positive ion intensities.
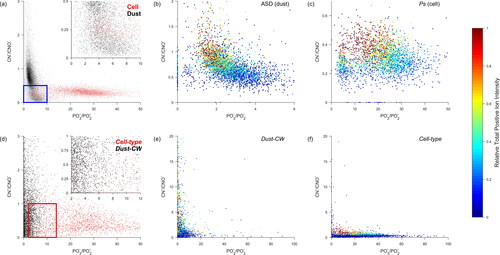
Zawadowicz et al. (Citation2017) made first use of analyzing spectra in 79PO3−/63PO2− versus 26CN−/42CNO− coordinate space to separate populations of inorganic and biological particles. In this article, the FIN-1 ATOFMS bacteria and dust spectra plotted in the 79PO3−/63PO2− versus 26CN−/42CNO− coordinate space exhibit similar trends as shown in Zawadowicz et al. (Citation2017; and S1). Generally, bacteria spectra exhibit a wide range of 79PO3−/63PO2− (∼10–100) ratios with 26CN−/42CNO− values limited to relatively low values (∼<1). For dust spectra, the 79PO3−/63PO2− ratio is relatively narrow and limited to low values (∼<10) with a broader 26CN−/42CNO− distribution when compared to the bacteria spectra. However, within the FIN-1 dataset there is also a region of high overlap between the bacteria and dust particle types (). Over 20% of all spectra for the BSD, MSD, KF, and INX dust samples and 14% of the Ps cell sample fall within the highlighted overlap region (see for a complete description of all samples). The lack of clear separation of ATOFMS-generated dust and bacteria spectra in 79PO3−/63PO2− versus 26CN−/42CNO space indicates utilization of this classification technique with any SPMS instrument first requires a careful study of an array of control samples.
3.2. Variations in total positive ion intensity for cellular and dust mass spectra
For particles of similar composition, the TPII of the mass spectra has been shown to generally increase with increasing laser pulse energy (Sultana, Collins, and Prather Citation2017; Thomson, Middlebrook, and Murphy Citation1997; Wade et al. Citation2008; Woods et al. Citation2002). Therefore, TPII may be utilized as a proxy for the photon flux experienced by the particle within the much larger laser desorption/ionization beam. For most SPMS, even when laser pulse energy is consistent, photon flux varies across the laser beam profile (Wenzel and Prather Citation2004). Within a dataset, examining TPII in tandem with ion signals helps disentangle the impact of ionization conditions on mass spectra compared to natural variances in particle composition. For the individual dust and biological particles in this study, their location in 26CN−/42CNO− versus 79PO3−/63PO2− space shifts toward lower 79PO3−/63PO2− and higher 26CN−/42CNO− values with increasing TPII (, and S1). This motivated a comprehensive investigation of dust and biological mass spectral trends in the dataset with respect to TPII. The following sections present a holistic discussion of this study’s results and trends contextualized by an array of previous dust and biological SPMS analyses.
3.2.1. Dust mass spectra and total positive ion intensity
Consistent with previous observations, most positive ion dust spectra are dominated by a combination of potassium, calcium, sodium, iron, and aluminum ion markers ( and S2). For more general characterizations of mineral and soil dust samples, readers are referred to Marsden et al. (Citation2019), Schmidt et al. (Citation2017), Silva, Carlin, and Prather (Citation2000), and Zawadowicz et al. (Citation2017). Here we focus on TPII-dependent systematic variations within the dust mass spectra.
Figure 3. Representative mass spectra for ASD (dust) with relatively low (a) and high (b) TPII. Representative mass spectra for Ps (cellular) with relatively low (c) and high (d) TPII.
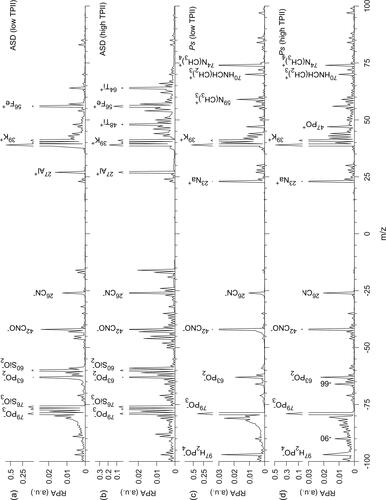
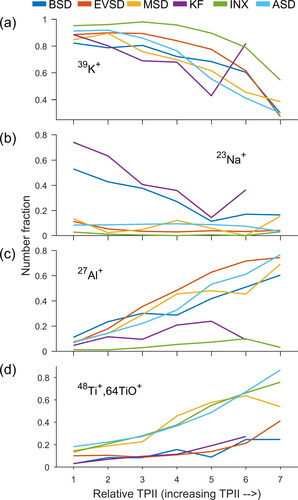
The relative intensity of potassium ion signal has historically been utilized as a key marker for both dust and biological spectra. The most consistent trend in the positive ion mass spectra across all dust samples was the decrease in 39K+ relative signal and the increase in 27Al+, 48Ti+, 64TiO+ and with increasing TPII ( and S2). Similar to 39K+, the relative 23Na+ signal also decreased with increasing TPII for the KF and BSD samples, the only samples with reported contributions from albite. As detailed below, these observed trends in relative positive ion signals with TPII are consistent with common paradigms applied to LDI.
It has been suggested that both the lattice energy of a compound and the ionization energy of an atomic species influence the generation of metallic cations (Gross et al. Citation2000; Thomson, Middlebrook, and Murphy Citation1997). Within soils, aluminum content is typically organized as sheets or in 3D crystal structures, though some soil particles can be contain disordered clay-like colloids (Engelbrecht et al. Citation2016). However, the aluminum in these colloids is still either tetrahedrally or octahedrally coordinated. Titanium can sometimes substitute for aluminum within these lattices. Unlike aluminum and titanium, interstitial ions, such as potassium in both K-feldspar and illite and sodium in albite, are not tightly bound in the lattice structures. Marsden et al. (Citation2019) suggested that weakly bound interstitial cations between clay sheets desorb and ionize before disintegration of the alumina lattices. Our results are consistent with this paradigm; the higher aluminum and titanium relative ion signals with increasing TPII is consistent with a higher expenditure of energy required to release them from lattice structures compared to potassium. However, potassium and sodium have lower first ionization energies than aluminum and titanium which could also contribute to their preferential detection in lower TPII mass spectra (Sansonetti and Martin Citation2005).
Changes in relative negative ion intensities as a function of TPII were more subtle compared to the positive ion signatures. Primarily, signals from a wide range of low m/z ion markers, roughly from m/z − 12 to −50, increase with increasing TPII, though most of these relative ion signals remain well below 1% of the total negative ion intensity (, and S2). Many of the low mass ion peaks, such as 24C2−, 25C2H−, and 26CN−, are attributed to fragmentation of organic species. Signal from 16O− and 17OH−, which could be a result of fragmentation of various mineral oxides or adsorbed water on the particles, also generated relatively intense signals at high TPII. While the growth of low m/z ions with increasing TPII may be unsurprising to SPMS users, to our knowledge this relationship is not documented in the literature. Mixed organic-dust particles can have enhanced IN-activity relative to mineral dust (Conen et al. Citation2011; O’Sullivan et al. Citation2014; Tobo et al. Citation2014), and are thus of great interest to atmospheric scientists. Yet this work highlights that key ion markers typically associated with “organic-rich” dust particles, such as 26CN− and 42CNO−, are also tied to the energy experienced by the particle during the LDI process and may be especially important to consider given the variation in photon flux across the LDI beam common to SPMS systems.
Figure 4. For each dust sample analyzed, number fraction of mass spectra with relative ion signals for (a) 39K+ > 0.25, (b) 23Na+ > 0.01, (c) 27Al+ > 0.05, (d) and 48Ti+,64TiO+ > 0.05.
3.2.2. Bioparticle mass spectra and total positive ion intensity
Consistent with Steele et al. (Citation2003, Citation2005), which examined the influence of laser pulse energy on biological spectra production and signatures, single particle mass spectra for the biological samples analyzed in this study show systematic variations with TPII. A handful of relatively low mass ions, notably 26CN−, 42CNO−, −66, and −90, increase in relative intensity with increasing TPII (Figures S2–S4). Prior results from SPMS studies of bacterial cells have shown an increase in 26CN−, 42CNO−, −58, and −66 ion markers with increasing laser pulse energy (Steele et al. Citation2003, Citation2005). Though these results were obvious in the figures presented by Steele et al. (Citation2003, Citation2005), they were not noted at all (Steele et al. Citation2003) or discussed only briefly as an increase in “negative low-mass peaks” (Steele et al. Citation2005).
In the positive spectra, fewer coherent trends were discovered across the biological samples studied. With increasing TPII, m/z + 59 and +74 signal consistently decreased (Sec. 3.3.4), and conversely inorganic cation signal, such as 23Na+ and 39K+, sometimes increased. Steele et al. (Citation2003, Citation2005) also showed in figures that m/z + 74 signal decreased markedly with increasing laser pulse energy, though this trend was only noted in the text by Steele et al. (Citation2005). In the Ps, Pf, and Cr samples, signals from potassium-containing cluster ions (Sec. 3.3.5) at m/z 104, 120, 141, 157, 175, 197, and 213 generally increased with increasing TPII, consistent with results from Sultana et al. (Citation2017), which noted an increase in m/z + 104 and +120 with TPII and laser pulse energy. For all cell types sampled in the UC San Diego microalgae study (2–6 μm Dva), an increase in TPII resulted in fragmentation of presumably high mass organic species, as indicated by relatively more intense lower m/z signals at intervals of 14 m/z in the region m/z + 350 to +625 (Figure S5). Also observed with increasing TPII was decreasing relative intensities for m/z − 794 and −820, which have been attributed previously to the [M-H]− ions of sulfoquinovosyldiacylglycerides (Cahill et al. Citation2015; Plouguerné et al. Citation2013), a lipid common to chloroplast membranes (Figure S5). These results and discussion highlight that when particles encounter high photon energy densities, organic species specific to bioparticles may be fragmented to nonspecific organic ions at lower m/z, complicating the identification of cellular aerosols within a complex aerosol population.
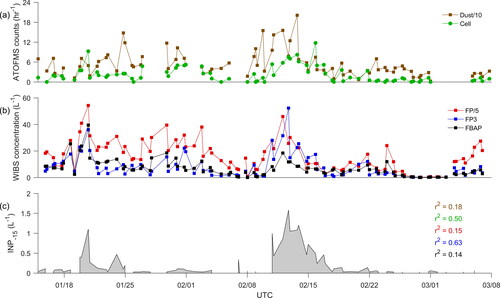
Figure 5. Temporal profiles of (a) ATOFMS hourly counts for Dust (divided by 10, brown) and Cell-type (green), (b) WIBS concentrations for FP (red, scaled by 1/5), FP3 (blue), and FBAP (black), and (c) INP-15 (L−1). Correlation coefficients (r2) between INP-15 and WIBS or ATOFMS particle types are shown in their respective colors.
3.3. Key ion markers for identification of cellular spectra
In addition to the influence of laser energy upon ion signatures, single bioparticle mass spectra have also been shown to vary with biological species, life cycle, and nutrient conditions (Cahill et al. Citation2015; Czerwieniec et al. Citation2005; Srivastava et al. Citation2005; Tobias et al. Citation2006). We have yet to determine any single ion marker which is both universally generated by aerosolized cells and also can reliably differentiate between cellular and dust mass spectra. Yet as shown by previous studies and supported by the results in this work, bioparticles do produce a range of distinguishing spectral signatures, broadly grouped as nucleobases, amino acids, quaternary amines, negative ion clusters containing phosphate, and positive ion potassium-containing clusters. The following sections briefly describe these ion markers, summarized in Table S2. An extended discussion is presented in Sec. S2. Ion signals from these species are often very low in intensity, causing them to be overlooked in some statistical and machine learning analyses applied to atmospheric datasets. However, by utilizing a combination of these markers, we propose that one should be able to confidently discriminate a fraction of the cellular spectra in a complex dataset. The following discussion could help build a new framework for the identification of bioparticles, divorced from common ion signals shared by bioparticles and dust, such as 26CN−, 42CNO−, 79PO3−, and 39K+.
We emphasize that the presence of signal at an m/z associated with a cellular ion marker discussed below is not necessarily indicative of a cellular spectra. Characteristics of the entire spectra must be considered when attempting to discriminate cellular spectra in atmospheric datasets. Researchers should still use historically established signatures and ion markers to identify other atmospheric particle types such as combustion, secondary organic, and sea spray aerosols. The discussion presented herein builds upon this existing foundation and presents supplemental tools to disentangle dust and biological spectra.
3.3.1. Nucleobases
Negative mass spectra of nucleobases are characterized by the [M-H]− ion (e.g., 150[Guanine-H]−, 134[Adenine-H]−, with further fragmentation of these species potentially yielding additional ion markers at m/z − 58, −71, −64 to −67, −90, −95, −106, −107, −108, −117, −131 to −134, −149, −150 (Smith, Schram, and Mccloskey Citation1983; Srivastava et al. Citation2005; Varmuza et al. Citation1999). These ion markers have been commonly observed in previous SPMS studies of bacterial cells (Czerwieniec et al. Citation2005; Srivastava et al. Citation2005; Steele et al. Citation2003; Tobias et al. Citation2006) and likely cell-containing sea spray aerosol (SSA; Sultana, Al-Mashat, and Prather Citation2017). In this work in the UC San Diego microalgae studies, nucleobase signatures were frequently observed at m/z − 90, −106 to −107, −117, −131 to −134, −149, and −150 (Figures S3 and S6a). With strong negative nucleobase ion signatures, positive ion signals were also commonly detected at m/z + 110, +135, and +152 (Figure S6b), likely a result of guanine ionization (Varmuza et al. Citation1999), and +185, not assigned at this time. In the FIN-1 bacteria studies weak signal at −90 was sometimes observed, however nucleobase ion markers above −90 were rare. Ion markers, potentially a result of extensive nucleoside fragmentation, at m/z − 58, −64 to −66, and −71, were observed in all the cellular samples examined here as well. Approximately 70% of all bacterial FIN-1 and microalgae negative spectra had relative signal at m/z − 66 above 0.005. Here and in the literature a signature from −64 to −67 m/z range is pervasive. Signal at m/z − 66 is almost always greater than m/z − 65 and −64, and signal at −67 is very low relative to all these three (Figure S6c). With increasing laser pulse energy (Steele et al. Citation2003, Citation2005) or TPII, as examined here, the relative intensities of these markers generally increase, with signal at m/z − 65 and −64 approaching the intensity of m/z − 66 (Figure S6d).
3.3.2. Amino acids
Ion markers which have been assigned to an array of amino acids (Czerwieniec et al. Citation2005; Schneider et al. Citation2011; Srivastava et al. Citation2005) have been widely noted in cellular single particle mass spectra (Fergenson et al. Citation2004; Srivastava et al. Citation2005; Tobias et al. Citation2006, Citation2005). Consistent with these previous studies, peaks which can be attributed to amino acid [M-CO2]+ ions (e.g., 70[Proline-CO2]+, 86[Leucine-CO2]+) frequently co-occurred in spectra for all biological species analyzed in this work. As has been previously observed (Czerwieniec et al. Citation2005), in this study signal at m/z + 84 was almost always detected in spectra when a relatively intense 86[Leucine-CO2]+ peak was also present. The amino acid markers 173[Arginine-H]−, 175[Arginine-H]+, and 146[Glutamic acid-H]− have also been noted in previous studies (Czerwieniec et al. Citation2005; Srivastava et al. Citation2005; Sultana et al. 2017). In this work signal at m/z 175 was detected in 32% of bacterial FIN-1 mass spectra, but m/z 173 and 146 were not noted in the FIN-1 or microalgae studies.
3.3.3. Negative ion clusters with phosphate
Signals from characteristic ion fragments of organophosphate species (Strzelecka et al. Citation2017) have been frequently noted in cellular single particle mass spectra (Fergenson et al. Citation2004; Srivastava et al. Citation2005; Tobias et al. Citation2006, Citation2005). Unfortunately, the two most common organophosphate ion markers in cellular spectra, 79PO3− and 63PO2−, are also generated by inorganic phosphates (Silva Citation2000; Zawadowicz et al. Citation2017). Signal at m/z −97 (97H2PO4−) has been noted in nearly every published SPMS cell analysis study and was also ubiquitous in the cellular particle types sampled here. Utilizing m/z − 97 as an identifier for ambient cellular particles is not possible because sulfates generated during atmospheric processing commonly result in the detection of 97HSO4−. However, a series of higher m/z phosphate-derived signals at m/z − 159, −199, −215, −261, −277, −381 characteristic of organophosphate species such as DNA (Strzelecka et al. Citation2017), has been reported for Bacillus species (Czerwieniec et al. Citation2005; Tobias et al. Citation2005). For both the bacterial FIN-1 and UC San Diego microalgae mass spectra, a similar series of phosphate-derived ions are repeatedly observed, with signal at some combination of the markers listed above in addition to m/z − 239 and −301 (Figure S6f). Out of these markers, a relatively intense signal at m/z − 159 is most frequently detected; 44% of bacterial FIN-1 and 59% of microalgae negative spectra had a relative signal above 1% of the total spectrum.
3.3.4. Quaternary amines
A number of SPMS cell studies have noted signal at m/z + 74, often accompanied by signal at m/z + 59 (Czerwieniec et al. Citation2005; Fergenson et al. Citation2004; Srivastava et al. Citation2005; Tobias et al. Citation2006, Citation2005). These marker ions have been attributed to the fragmentation of organic species with quaternary amines, such as trimethylglycine, (Srivastava et al. Citation2005). Mass spectra with relatively intense signals at m/z + 59 and +74 (Figure S6g) were common in the Ps, Pf, and Cr data sets, but were relatively rare in the UC San Diego microalgae study. Using m/z + 59 to identify cellular spectra in ambient datasets should be performed with care as isobaric contributions from 59Co+, in dust, as well as 59Na(H2O)2+, common to wet sea spray aerosol spectra, are possible. Also single particle measurements of amines (Angelino, Suess, and Prather Citation2001; Pratt, Hatch, and Prather Citation2009) and organic carbon (Cahill et al. Citation2012; Spencer and Prather Citation2006) have been shown to readily generate ion signal at +59.
3.3.5. Potassium-containing positive ion clusters
A series of relatively low intensity signals above m/z + 100, including +104, +120, +157, +141, +175, +197, and +213, have been noted in some SPMS studies of cells (Tobias et al. Citation2005), vegetative detritus (Silva Citation2000), and likely cell-containing SSA (Sultana et al. 2017). Silva (Citation2000) attributed these signals to potassium-cluster ions (Table S2) though this assignment is not treated as definitive. For instance, the ionization of amino acids arginine and phenylalanine can generate signals at +175 (Srivastava et al. Citation2005) and +120 (Czerwieniec et al. Citation2005). All of the potassium-cluster ions described by Silva (Citation2000) have distinct isotopic signatures with a X:X + 2 ratio (e.g., 157K2PO3+:159K2PO3+) within the range of 7:1 to 4:1. Isotopic signal at m/z X + 2 is apparent in the provided mass spectra within Sultana et al. (Citation2017) and Silva (Citation2000), indicating contributions from potassium-cluster ions, though many other cellular spectra with signal reported at m/z + 175 show no significant signal at +177. In this study, only Ps, Pf, and Cr generated spectra with at least some obvious contributions from potassium-cluster ions, as evidenced by ion signal at m/z X + 2 (Figure S6h). Using potassium-cluster ions to identify cellular spectra in ambient datasets should be utilized with care as other particle types are known to generate similar clusters. Silva (Citation2000) readily detected 141K2PO2+ and 157K2PO3+ ions from potassium phosphate standards, and biomass burning particles can also generate 104K2CN+, 120K2CNO+, 197K3SO3+, and 213K3SO4+ ions (Silva et al. Citation1999).
3.4. Bioparticles in ambient studies
Accurately distinguishing between externally mixed bioparticles and dust in the ambient atmosphere is important due to their dissimilar ice nucleating potentials (Pratt et al. Citation2009a; Sun and Ariya Citation2006 and references within). Dust particles typically have higher atmospheric concentrations and are broadly acknowledged as the most abundant source of INPs below −20 °C (Andreae and Rosenfeld Citation2008; Kanji et al. Citation2017). Certain bioparticle types can be effective ice nucleators at temperatures ≥ −5 °C (Vali et al. Citation1976), and may be the exclusive source of INPs at temperatures warmer than −15 °C, despite their rarity (DeMott and Prenni Citation2010).
In Secs. 3.1–3.3, mass spectral features were discussed that may be used to distinguish between dust and bioparticles, the possible identities of those mass spectral features, and the trends associated with variations in laser fluence. In the following sections, we utilize that information for the identification of bioparticles in a complex, ambient SPMS dataset collected during a field study at a coastal site in California. Once identified, the temporal trends in bioparticles are compared to bioparticle concentrations measured by the WIBS and INP concentrations measured by droplet freezing assays.
3.4.1. Cell-type classification
Using the information in Secs. 3.2 and 3.3, we developed a decision tree (Figure S7) in order to identify cellular particles (hereafter Cell-type particles) during the CalWater-2015 field campaign. A fuller description of the development of this decision tree is given in the SI. Cell-type particles were identified after other particle classes were assigned and this classification was assumed to take precedence. Our decision tree heavily weights low intensity ion peaks outside of those previously used to identify bioparticles and explicitly rules out internally mixed dust and bioparticles from the Cell-type classification. Thus, the identified Cell-type population does not necessarily contain all aerosol particles with spectra characteristic of cellular material. While we believe our process can be adapted to select for internally mixed dust/bioparticles, we have elected not to do so here. While our decision tree does not employ every potential bioparticle ion marker, it does use each class in the identification process. It should be noted that many of the steps taken in this process are unique to the context of these measurements and instrumental parameters. While we believe that the classification scheme utilized here can serve as a useful template for future endeavors, it should not be applied to other datasets indiscriminately. Rather, each dataset should be investigated independently for the presence of characteristic ion markers (Secs. 3.2 and 3.3), to identify bioparticles.
A total of 2528 Cell-type particles were identified out of 1,220,818 particles measured by the ATOFMS at during the CalWater-2015 study (0.2% of all particles) and is in line with previous SPMS measurements of bioparticle abundance (0.4–2%; (Zawadowicz et al. Citation2017, Citation2019). Figure S8 shows the average spectrum of Cell-type particles identified during CalWater-2015. In addition to intense signals from 39K+, 79PO3−, 26CN−, and 42CNO−, many of the mass spectral features noted in studies of control bioparticles, detailed in Table S2, were present in Cell-type spectra, including nucleobases (66−, 71−, 90−, 117−, 131–134−), negative phosphates (159H(PO3)2−, 199NaH2P2O7−), quaternary amines (59N(CH3)3+, 74N(CH3)4+), and positive potassium clusters (104K2CN+, 157K2PO3+, 175K2HSO4). These particles also contained ion markers that have been associated with amino acids (86+, 175+). While many Cell-type particles contained multiple of these bioparticle markers, no single spectrum contained all of them. Cell-type particles also showed similar trends with regards to increasing TPII (Figure S9) as those observed in lab studies of aerosolized controls (Figure S4). For instance, signals at +59 and +74 were relatively more intense at lower TPII, while signals from phosphate clusters (159H(PO3)2−, 199NaH2P2O7−) and potassium clusters (157K2PO3+, 175K2HSO4) increased with increasing TPII. To our knowledge this latter relationship has not previously been described in the literature. Our confidence that identified Cell-type particles are bioparticles is strengthened by the fact that they have TPII trends similar to our standards and those found in the literature. These results also highlight that understanding the full bioparticle mass spectral space is critical to identifying them as using just one or two of these ion markers to distinguish potential bioparticles would be insufficient as very few are consistently found across the entire TPII range.
A total of 65,534 Dust-CW particles were identified by the ATOFMS during the CalWater-2015 field campaign. When translated into CN−/CNO− versus PO3−/PO2− space, Dust-CW (more detail on the typing and classification of these particles can be found in Sec. 2.2) and Cell-type particles exhibited similar trends to dust and bioparticles analyzed during FIN-1 (). The PO3−/PO2− and CN−/CNO− values for Dust were primarily located between ∼0–20. Cell-type PO3−/PO2− ratios ranged broadly, from ∼2–50, and the CN−/CNO ratios were primarily below 2. As with the FIN-1 samples, identified Dust-CW and Cell-type particles are not well separated in CN−/CNO− versus PO3−/PO2− space. A region of particularly high overlap is highlighted by a red box in and contains 17.5% of all Dust-CW particles and 6.8% of Cell-type particles. The asymmetry between the relative number of Dust-CW and Cell-type means that even small numbers of misclassified particles can lead to a gross overestimate of the number of bioparticles. For instance, even just 5% of Dust-CW particles being misclassified as Cell-type would more than double the total number of Cell-type particles. However, the average spectra for the two types in this overlapping space have numerous distinct ion markers (Figure S10) which can be utilized for distinguishing between these two classes.
3.4.2. Comparisons of Cell-type particles with WIBS and INP concentrations
Hourly counts of Cell-type particles were compared to the WIBS particle concentrations typed using FP, FBAP, and FP3 particle classification schemes (Figure S11). We note that by using our ambient dataset to develop the classification methods we are unable to quantify the classification uncertainty in our method because we do not know the true identity of measured particles. However, methodologies that use only laboratory measurements to develop their classifiers are unable to account for factors affecting ambient particle composition such as atmospheric processing. As such, it is important to understand how our method compares with other bioparticle measurements. The FP type (a particle with fluorescence signal in any channel) is the broadest class of fluorescent particle and is most likely to contain non-biological aerosol due to the potential interference from weakly fluorescing materials such as polyaromatic hydrocarbons, soot, and mineral dust (Toprak and Schnaiter Citation2013) and correlated very poorly with Cell-type (r2=0.26). The FBAP class is defined by signal in channels FL1 and FL3 and has found to have less interference from weakly fluorescing, non-biological materials than the FP class (Gabey et al. Citation2010). We found a similarly poor correlation between FBAP concentrations and Cell-type particle counts (r2 = 0.26). Finally, the FP3 class was first described by Wright et al. (Citation2014) and is defined by its extremely high fluorescence in FL1 (broadly thought to correspond to tryptophan) and little signal in FL2 and FL3. These particles were hypothesized to be fungal spores, though to our knowledge their identity has not been confirmed in laboratory studies. This class has also shown a strong relationship with apparent biological INPs in field studies, and thus could be an important proxy for future studies (Suski et al. Citation2018; Wright et al. Citation2014). We found that the FP3 class correlated moderately well with Cell-type hourly particle counts (r2 = 0.54), suggesting that it may be comprised of a large population of whole or fragmented cells.
Measurements of WIBS particle classes and the Cell-type counts were also compared to INP concentrations measured using offline sampling methods. While the strongest predictor of INP-15 was FP3 concentrations (r2 of 0.63; ), Cell-type particle counts also correlated well (r2 of 0.50) and both of these particle classes may be useful proxies for high temperature INPs. Neither Dust-CW (r2 of 0.18), FP (r2 of 0.15), nor FBAP (r2 = 0.14) were good predictors of INP-15. This suggests that bioparticles (i.e., whole or fragmented cells) controlled warm INP concentrations during the CalWater-2015 study. Due to the scarcity of Cell-type particles in the ATOFMS dataset (0.2%), special care should be taken when identifying this particle type. Even small errors in classification can lead to large relative changes in number of particles, and the predictive utility of this particle type may be negated.
4. Conclusions
The study builds a foundation for researchers to distinguish biological particles in complex aerosol populations using SPMS techniques. The dependence of cellular and dust mass spectral fingerprints on the amount of laser energy absorbed by each particle, increases the difficulty in accurately identifying bioparticles utilizing only a handful of ion markers. This dependence on ionization conditions likely contributes to the relatively poor separation of cellular and dust spectra in 79PO3−/63PO2− versus 26CN−/42CNO− space, despite demonstrated success by researchers utilizing a different SPMS.
We propose common cellular ion markers from the ionization of biological species such as DNA and amino acids, can be carefully utilized to distinguish bioparticles from complex ambient single particle mass spectral datasets. These low-intensity but characteristic signals have been frequently documented in laboratory studies, but have yet to be leveraged in ambient studies which frequently utilize classification algorithms driven by high intensity peaks. Due to the variation in biological mass spectra with ionization conditions, to maximize the number of bioparticles accurately selected out of an ambient SPMS dataset, an array of characteristic biological signals should be utilized.
The characteristic ion markers discussed were utilized to identify Cell-type particles at a coastal site in California. The Cell-type particles showed similar mass spectral trends with TPII as bioparticles in laboratory studies, suggesting that our methods successfully identified cellular particles in an ambient dataset. While Cell-type particles only made up 0.2% of all ambient particle spectra, Cell-type particle counts correlated moderately well with the WIBS-derived FP3 subclass and INP concentrations at T = −15 °C. The correlation between Cell-type and the FP3 class is particularly interesting as the FP3 type has been strongly implicated for representing microbial INPs in field campaigns that measured INPs active at moderate supercooling (Suski et al. Citation2018; Wright et al. Citation2014). While INP composition was not directly measured, this evidence suggests that whole or fragmented cells were primary contributors to warm INPs during the CalWater-2015 field campaign. Due to the extreme rarity of ambient biological particles minimizing nonbiological particles from “cell-type” classification was crucial to attaining these results. This work illustrates that special care needs to be taken when identifying biological particles and that careful consideration of low intensity peaks, in tandem with understanding how these features vary with TPII, can improve the mass spectral identification of this important class of particles.
Authors’ contributions
GCC participated in field study measurements, analyzed data, and wrote the article. CMS analyzed data and helped write the article. HA analyzed lab standards. NER participated in field study. MDP analyzed, quality assessed, and compiled cold-stage experiments and WIBS data. KAP, ACM, PJD, OM, and MDP provided over-arching ideas for study, measurements, subsequent sample processing, and were the leads of the key research projects.
Supplemental Material
Download MS Word (6.8 MB)Acknowledgments
The authors also thank the UC Davis Bodega Marine Laboratory for the use of laboratory and office space and shipping and physical plant support while collecting data, as well as the California Air Resources Board for the trailer used for sampling. The authors also thank the organizers and other participants in the FIN-1 workshop, including the staff of the Aerosol Interaction and Dynamics in the Atmosphere (AIDA) facility at the Karlsruhe Institute of Technology for their assistance in sampling, and Dan Cziczo for his role in organizing the FIN-01 campaign. Hans Taylor, Kylie Hoffman, Mary Hester, Margaret Scott, Hannah Tekleab, Mark Wu, and Seth Goodnight are thanked for their assistance in performing the cold-stage experiments. Hans Taylor is thanked for his help during sample collection.
Additional information
Funding
References
- Andreae, M. O., and D. Rosenfeld. 2008. Aerosol-cloud-precipitation interactions. Part 1. The nature and sources of cloud-active aerosols. Earth. Sci. Rev. 89 (1–2):13–41. doi:10.1016/j.earscirev.2008.03.001.
- Angelino, S., D. T. Suess, and K. A. Prather. 2001. Formation of aerosol particles from reactions of secondary and tertiary alkylamines: Characterization by aerosol time-of-flight mass spectrometry. Environ. Sci. Technol. 35 (15):3130–8. doi:10.1021/es0015444.
- Atkinson, J. D., B. J. Murray, M. T. Woodhouse, T. F. Whale, K. J. Baustian, K. S. Carslaw, S. Dobbie, D. O’Sullivan, and T. L. Malkin. 2013. The importance of feldspar for ice nucleation by mineral dust in mixed-phase clouds. Nature 500 (7463):490– . doi:10.1038/nature12384.
- Cahill, J. F., K. Suski, J. H. Seinfeld, A. Zaveri, and A. Prather. 2012. The mixing state of carbonaceous aerosol particles in northern and southern California measured during CARES and CalNex 2010. Atmos. Chem. Phys. 12:10989–1002. doi:10.5194/acp-12-10989-2012.
- Cahill, J., T. K. Darlington, C. Fitzgerald, N. G. Schoepp, J. Beld, M. D. Burkart, and K. A. Prather. 2015. Online analysis of single cyanobacteria and algae cells under nitrogen-limited conditions using aerosol time-of-flight mass spectrometry. Anal. Chem. 87 (16):8039–46. doi:10.1021/acs.analchem.5b02326.
- Cahill, J. F., T. K. Darlington, X. Wang, J. Mayer, M. T. Spencer, J. C. Holecek, B. E. Reed, and K. A. Prather. 2014. Development of a high-pressure aerodynamic lens for focusing large particles (4–10 μm) into the aerosol time-of-flight mass spectrometer. Aerosol Sci. Technol. 48 (9):948–56. doi:10.1080/02786826.2014.947400.
- Carson, P. G., M. V. Johnston, and A. S. Wexler. 1997. Real-time monitoring of the surface and total composition of aerosol particles. Aerosol Sci. Technol. 26 (4):291–300. doi:10.1080/02786829708965431.
- Conen, F., C. E. Morris, J. Leifeld, M. V. Yakutin, and C. Alewell. 2011. Biological residues define the ice nucleation properties of soil dust. Atmos. Chem. Phys. 11 (18):9643–8. doi:10.5194/acp-11-9643-2011.
- Creamean, J. M., C. Lee, T. C. Hill, A. P. Ault, P. J. DeMott, A. B. White, Ralph, F. M., and K. A. A. Prather. 2014. Chemical properties of insoluble precipitation residue particles. J. Aerosol Sci. 76:13–27. doi:10.1016/j.jaerosci.2014.05.005.
- Creamean, J., K. Suski, D. Rosenfeld, A. Cazorla, P. DeMott, R. Sullivan, A. White, M. Ralph, P. Minnis, J. Comstock, et al. 2013. Dust and biological aerosols from the Sahara and Asia influence precipitation in the western U.S. Science 339 (6127):1572–8. doi:10.1126/science.1227279.
- Czerwieniec, G., S. Russell, H. Tobias, M. Pitesky, D. Fergenson, P. Steele, A. Srivastava, J. Horn, M. Frank, E. Gard, et al. 2005. Stable isotope labeling of entire Bacillus atrophaeus spores and vegetative cells using bioaerosol mass spectrometry. Anal. Chem. 77 (4):1081–7. doi:10.1021/ac0488098.
- DeMott, P. J., A. J. Prenni, X. Liu, S. M. Kreidenweis, M. D. Petters, C. H. Twohy, M. S. Richardson, T. Eidhammer, and D. C. Rogers. 2010. Predicting global atmospheric ice nuclei distributions and their impacts on climate. Proc. Natl. Acad. Sci. U. S. A. 107 (25):11217–22. doi:10.1073/pnas.0910818107.
- DeMott, P., O. Möhler, D. J. Cziczo, N. Hiranuma, M. D. Petters, S. S. Petters, F. Belosi, H. G. Bingemer, S. D. Brooks, C. Budke, M. Burkert-Kohn, K. N. Collier, A. Danielczok, O. Eppers, L. Felgitsch, S. Garimella, H. Grothe, P. Herenz, T. C. J. Hill, … J. Zenker. 2018. The Fifth International Workshop on Ice Nucleation phase 2 (FIN-02): Laboratory intercomparison of ice nucleation measurements. Atmos. Meas. Tech. 11 (11):6231–57. doi:10.5194/amt-11-6231-2018.
- DeMott, P., and A. J. Prenni. 2010. New Directions: Need for defining the numbers and sources of biological aerosols acting as ice nuclei. Atmos. Environ. 44 (15):1944–5. doi:10.1016/j.atmosenv.2010.02.032.
- Després, V. R., J. Alex Huffman, S. M. Burrows, C. Hoose, A. S. Safatov, G. Buryak, J. Fröhlich-Nowoisky, W. Elbert, M. O. Andreae, U. Pöschl, and R. Jaenicke. 2012. Primary biological aerosol particles in the atmosphere: A review. Tellus B: Chem. Phys. Meteorol. 64 (1):1–58. doi:10.3402/tellusb.v64i0.15598.
- Engelbrecht, J. P., H. Moosmüller, S. Pincock, R. K. M. Jayanty, T. Lersch, and G. Casuccio. 2016. Technical note: Mineralogical, chemical, morphological, and optical interrelationships of mineral dust re-suspensions. Atmos. Chem. Phys. 16 (17):10809–30. doi:10.5194/acp-16-10809-2016.
- Engelstaedter, S., I. Tegen, and R. Washington. 2006. North African dust emissions and transport. Earth. Sci. Rev. 79 (1–2):73–100. doi:10.1016/j.earscirev.2006.06.004.
- Fergenson, D., M. Pitesky, H. Tobias, P. Steele, G. Czerwieniec, S. Russell, C. Lebrilla, J. Horn, K. Coffee, A. Srivastava, et al. 2004. Reagentless detection and classification of individual bioaerosol particles in seconds. Anal. Chem. 76 (2):373–8. doi:10.1021/ac034467e.
- Fröhlich-Nowoisky, J., C. J. Kampf, B. Weber, J. A. Huffman, C. Pöhlker, M. O. Andreae, N. Lang-Yona, S. M. Burrows, S. S. Gunthe, W. Elbert, H. Su, P. Hoor, E. Thines, T. Hoffmann, V. R. Després, and U. Pöschl. 2016. Bioaerosols in the Earth system: Climate, health, and ecosystem interactions. Atmos. Res. 182:346–76. doi:10.1016/j.atmosres.2016.07.018.
- Gabey, A. M., M. W. Gallagher, J. Whitehead, J. R. Dorsey, P. H. Kaye, and W. R. Stanley. 2010. Measurements and comparison of primary biological aerosol above and below a tropical forest canopy using a dual channel fluorescence spectrometer. Atmos. Chem. Phys. 10 (10):4453–66. doi:10.5194/acp-10-4453-2010.
- Gabey, A. M., W. R. Stanley, M. W. Gallagher, and P. H. Kaye. 2011. The fluorescence properties of aerosol larger than 0.8 μ in urban and tropical rainforest locations. Atmos. Chem. Phys. 11 (11):5491–504. doi:10.5194/acp-11-5491-2011.
- Gard, E., J. E. Mayer, B. D. Morrical, T. Dienes, D. P. Fergenson, and K. A. Prather. 1997. Real-time analysis of individual atmospheric aerosol particles: Design and performance of a portable ATOFMS. Anal. Chem. 69 (20):4083–91. doi:10.1021/ac970540n.
- Gross, D. S., M. E. Gälli, P. J. Silva, and K. A. Prather. 2000. Relative sensitivity factors for alkali metal and ammonium cations in single-particle aerosol time-of-flight mass spectra. Anal. Chem. 72 (2):416–22. doi:10.1021/ac990434g.
- Hader, J. D., T. P. Wright, and M. D. Petters. 2014. Contribution of pollen to atmospheric ice nuclei concentrations. Atmos. Chem. Phys. 14 (11):5433–49. doi:10.5194/acp-14-5433-2014.
- Hill, T. C. J., P. J. Demott, Y. Tobo, J. Fröhlich-Nowoisky, B. F. Moffett, G. D. Franc, and S. M. Kreidenweis. 2016. Sources of organic ice nucleating particles in soils. Atmos. Chem. Phys. 16 (11):7195–211. doi:10.5194/acp-16-7195-2016.
- Hirst, E., P. H. Kaye, V. Foot, J. M. Clark, and P. B. Withers. 2004. An instrument for the simultaneous acquisition of size, shape, and spectral fluorescence data from single aerosol particles. Proc. SPIE, 5617:416–23. doi:10.1117/12.578269.
- Kanji, Z. A., L. A. Ladino, H. Wex, Y. Boose, M. Burkert-Kohn, D. J. Cziczo, and M. Krämer. 2017. Overview of ice nucleating particles. Meteorol. Monogr. 58:1.1–.33. doi:10.1175/AMSMONOGRAPHS-D-16-0006.1.
- Marsden, N. A., M. J. Flynn, J. D. Allan, and H. Coe. 2018. On-line differentiation of mineral phase in aerosol particles by ion formation mechanism using a LAAP-ToF single particle mass spectrometer. Atmos. Meas. Tech. 11 (1). doi:10.5194/amt-11-195-2018.
- Marsden, N. A., R. Ullrich, O. Möhler, S. Eriksen Hammer, K. Kandler, Z. Cui, P. I. Williams, M. J. Flynn, D. Liu, J. D. Allan, and H. Coe. 2019. Mineralogy and mixing state of North African mineral dust by on-line single-particle mass spectrometry. Atmos. Chem. Phys. 19 (4):2259–81. doi:10.5194/acp-19-2259-2019.
- Martin, A. C., G. C. Cornwell, S. A. Atwood, K. A. Moore, N. E. Rothfuss, H. Taylor, P. J. DeMott, S. M. Kreidenweis, M. D. Petters, and K. A. Prather. 2017. Transport of pollution to a remote coastal site during gap flow from California’s interior: Impacts on aerosol composition, clouds, and radiative balance. Atmos. Chem. Phys. 17 (2):1491–509. doi:10.5194/acp-17-1491-2017.
- O’Sullivan, D., B. J. Murray, T. L. Malkin, T. F. Whale, N. S. Umo, J. D. Atkinson, H. C. Price, K. J. Baustian, J. Browse, and M. E. Webb. 2014. Ice nucleation by fertile soil dusts: Relative importance of mineral and biogenic components. Atmos. Chem. Phys. 14 (4):1853–67. doi:10.5194/acp-14-1853-2014.
- Perring, A. E., J. P. Schwarz, D. G. Baumgardner, M. T. Hernandez, D. V. Spracklen, C. L. Heald, R. S. Gao, G. Kok, G. R. McMeeking, J. B. McQuaid, and D. W. Fahey. 2014. Airborne observations of regional variation in fluorescent aerosol across the United States. J. Geophys. Res.: Atmos. 120:1153–70. doi:10.1002/2014JD022495.
- Plouguerné, E., L. de Souza, G. Sassaki, J. F. Cavalcanti, M. T. Villela Romanos, B. da Gama, R. C. Pereira, and E. Barreto-Bergter. 2013. Antiviral sulfoquinovosyldiacylglycerols (SQDGs) from the Brazilian brown seaweed sargassum vulgare. Mar. Drugs. 11 (11):4628–40. doi:10.3390/md11114628.
- Pratt, K. A., P. J. Demott, J. R. French, Z. Wang, D. L. Westphal, A. J. Heymsfield, C. H. Twohy, A. J. Prenni, and K. A. Prather. 2009a. In situ detection of biological particles in cloud ice-crystals. Nat. Geosci. 2 (6):398–401. doi:10.1038/ngeo521.
- Pratt, K. A., L. E. Hatch, and K. A. Prather. 2009. Seasonal volatility dependence of ambient particle phase amines. Environ. Sci. Technol. 43 (14):5276–81. doi:10.1021/es803189n.
- Pratt, K., J. Mayer, J. Holecek, R. Moffet, R. Sanchez, T. Rebotier, H. Furutani, M. Gonin, K. Fuhrer, Y. Su, et al. 2009b. Development and characterization of an aircraft aerosol time-of-flight mass spectrometer. Anal. Chem. 81 (5):1792–800. doi:10.1021/ac801942r.
- Rebotier, T. P., and K. A. Prather. 2007. Aerosol time-of-flight mass spectrometry data analysis: A benchmark of clustering algorithms. Anal. Chim. Acta 585:38–54. doi:10.1016/j.aca.2006.12.009.
- Reinard, M. S., and M. V. Johnston. 2008. Ion formation mechanism in laser desorption ionization of individual nanoparticles. J. Am. Soc. Mass Spectrom. 19 (3):389–99. doi:10.1016/j.jasms.2007.11.017.
- Rogers, D. C., P. J. DeMott, S. M. Kreidenweis, and Y. Chen. 1998. Measurements of ice nucleating aerosols during SUCCESS. Geophys. Res. Lett. 25 (9):1383–6. doi:10.1029/97GL03478.
- Sansonetti, J. E., and W. C. Martin. 2005. Handbook of basic atomic spectroscopic data. J. Phys. Chem. Ref. Data 34 (4):1559–2259. doi:10.1063/1.1800011.
- Savage, N. J., C. E. Krentz, T. Könemann, T. T. Han, G. Mainelis, C. Pöhlker, and J. Alex Huffman. 2017. Systematic characterization and fluorescence threshold strategies for the wideband integrated bioaerosol sensor (WIBS) using size-resolved biological and interfering particles. Atmos. Meas. Tech. 10 (11):4279–302. doi:10.5194/amt-10-4279-2017.
- Schmidt, S., J. Schneider, T. Klimach, S. Mertes, L. P. Schenk, P. Kupiszewski, J. Curtius, and S. Borrmann. 2017. Online single particle analysis of ice particle residuals from mountain-top mixed-phase clouds using laboratory derived particle type assignment. Atmos. Chem. Phys. 17 (1):575–94. doi:10.5194/acp-17-575-2017.
- Schneider, J., F. Freutel, S. R. Zorn, Q. Chen, D. K. Farmer, J. L. Jimenez, S. T. Martin, P. Artaxo, A. Wiedensohler, and S. Borrmann. 2011. Mass-spectrometric identification of primary biological particle markers and application to pristine submicron aerosol measurements in Amazonia. Atmos. Chem. Phys. 11:11415–29. doi:10.5194/acp-11-11415-2011.
- Silva, P. J. 2000. Source profiling and apportionment of airborne particles: A new approach using aerosol time-of-flight mass spectrometry. Riverside: University of California. doi:10.16953/deusbed.74839.
- Silva, P. J., A. Carlin, and A. Prather. 2000. Single particle analysis of suspended soil dust from Southern California. Atmos. Environ. 34 (11):1811–20. doi:10.1016/S1352-2310(99)00338-6.
- Silva, P. J., D. Y. Liu, C. A. Noble, and K. A. Prather. 1999. Size and chemical characterization of individual particles resulting from biomass burning of local Southern California species. Environ. Sci. Technol. 33 (18):3068–76. doi:10.1021/es980544p.
- Silva, P., and K. Prather. 2000. Interpretation of mass spectra from organic compounds in aerosol time-of-flight mass spectrometry. Anal. Chem. 72 (15):3553–62. http://www.ncbi.nlm.nih.gov/pubmed/10952542. doi:10.1021/ac9910132.
- Smith, D. L., K. H. Schram, and J. A. Mccloskey. 1983. The negative ion mass spectra of selected nucleosides. Biomed. Mass Spectrom. 10 (4):269–75. doi:10.1002/bms.1200100407.
- Song, X. H., P. K. Hopke, D. P. Fergenson, and A. Prather. 1999. Classification of single particles analyzed by ATOFMS using an artificial neural network, ART-2A. Anal. Chem. 71 (4):860–5. doi:10.1021/ac9809682.
- Spencer, M. T., and A. Prather. 2006. Using ATOFMS to determine OC/EC mass fractions in particles. Aerosol Sci. Technol. 40:585–94. doi:10.1080/02786820600729138.
- Srivastava, A., M. Pitesky, P. Steele, H. Tobias, D. Fergenson, J. Horn, S. Russell, G. Czerwieniec, C. Lebrilla, E. Gard, et al. 2005. Comprehensive assignment of mass spectral signatures from individual Bacillus atrophaeus spores in matrix-free laser desorption/ionization bioaerosol mass spectrometry. Anal. Chem. 77 (10):3315–23. doi:10.1021/ac048298p.
- Steele, P., A. Srivastava, M. E. Pitesky, D. P. Fergenson, H. J. Tobias, E. E. Gard, and M. Frank. 2005. Desorption/ionization fluence thresholds and improved mass spectral consistency measured using a flattop laser profile in the bioaerosol mass spectrometry of single Bacillus endospores. Anal. Chem. 77 (22):7448–54. doi:10.1021/ac051329b.
- Steele, P., H. Tobias, D. Fergenson, M. Pitesky, J. Horn, G. Czerwieniec, S. Russell, C. Lebrilla, E. Gard, and M. Frank. 2003. Laser power dependence of mass spectral signatures from individual bacterial spores in bioaerosol mass spectrometry. Anal. Chem. 75 (20):5480–7. doi:10.1021/ac034419u.
- Strzelecka, D., S. Chmielinski, S. Bednarek, and J. Jemielity. 2017. Analysis of mononucleotides by tandem mass spectrometry: Investigation of fragmentation pathways for phosphate- and ribose-modified nucleotide analogues. Sci. Rep. 7(May):17–23. doi:10.1038/s41598-017-09416-6.
- Sultana, C. M., H. Al-Mashat, and K. A. Prather. 2017. Expanding single particle mass spectrometer analyses for the identification of microbe signatures in sea spray aerosol. Anal. Chem. 89 (19):10162–70. doi:10.1021/acs.analchem.7b00933.
- Sultana, C. M., D. B. Collins, and K. A. Prather. 2017. The effect of structural heterogeneity in chemical composition on online single particle mass spectrometry analysis of sea spray aerosol particles. Environ. Sci. Technol. 51 (7):3660–8. doi:10.1021/acs.est.6b06399.
- Sultana, C. M., G. C. Cornwell, P. Rodriguez, and K. A. Prather. 2017. FATES: A flexible analysis toolkit for the exploration of single-particle mass spectrometer data. Atmos. Meas. Tech. 10 (4):1323–34. doi:10.5194/amt-10-1323-2017.
- Sun, J., and P. A. Ariya. 2006. Atmospheric organic and bio-aerosols as cloud condensation nuclei (CCN): A review. Atmos. Environ. 40 (5):795–820. doi:10.1016/j.atmosenv.2005.05.052.
- Suski, K. J., T. C. J. Hill, E. J. T. Levin, A. Miller, P. J. DeMott, and S. M. Kreidenweis. 2018. Agricultural harvesting emissions of ice-nucleating particles. Atmos. Chem. Phys. 18 (18):13755–71. doi:10.5194/acp-18-13755-2018.
- Thomson, D. S., A. M. Middlebrook, and D. M. Murphy. 1997. Thresholds for laser-induced ion formation from aerosols in a vacuum using ultraviolet and vacuum-ultraviolet laser wavelengths. Aerosol Sci. Technol. 26 (6):544–59. doi:10.1080/02786829708965452.
- Tobias, H. J., M. E. Pitesky, D. P. Fergenson, P. T. Steele, J. Horn, M. Frank, and E. E. Gard. 2006. Following the biochemical and morphological changes of Bacillus atrophaeus cells during the sporulation process using Bioaerosol Mass Spectrometry. J. Microbiol. Methods. 67 (1):56–63. doi:10.1016/j.mimet.2006.03.001.
- Tobias, H. J., M. P. Schafer, M. Pitesky, D. P. Fergenson, J. Horn, M. Frank, and E. E. Gard. 2005. Bioaerosol mass spectrometry for rapid detection of individual airborne mycobacterium tuberculosis H37Ra particles bioaerosol mass spectrometry for rapid detection of individual airborne mycobacterium tuberculosis H37Ra particles. Appl. Environ. Microbiol. 71 (10):6086–95. doi:10.1128/AEM.71.10.6086.
- Tobo, Y., P. J. Demott, T. C. J. Hill, A. J. Prenni, N. G. Swoboda-Colberg, G. D. Franc, and S. M. Kreidenweis. 2014. Organic matter matters for ice nuclei of agricultural soil origin. Atmos. Chem. Phys. 14 (16):8521–31. doi:10.5194/acp-14-8521-2014.
- Toprak, E., and M. Schnaiter. 2013. Fluorescent biological aerosol particles measured with the Waveband Integrated Bioaerosol Sensor WIBS-4: Laboratory tests combined with a one year field study. Atmos. Chem. Phys. 13 (1):225–43. doi:10.5194/acp-13-225-2013.
- Twohy, C. H., G. R. McMeeking, P. J. DeMott, C. S. McCluskey, T. C. J. Hill, S. M. Burrows, G. R. Kulkarni, M. Tanarhte, D. N. Kafle, and D. W. Toohey. 2016. Abundance of fluorescent biological aerosol particles at temperatures conducive to the formation of mixed-phase and cirrus clouds. Atmos. Chem. Phys. 16 (13):8205–25. doi:10.5194/acp-16-8205-2016.
- Vali, G., M. Christensen, R. W. Fresh, E. L. Gaylan, L. R. Maki, and R. C. Schnell. 1976. Biogenic ice nuclei. Part II. Bacterial sources. J. Atmos. Sci. 33:1565–70.
- Varmuza, K., W. Werther, F. R. Krueger, J. Kissel, and E. R. Schmid. 1999. Organic substances in cometary grains: Comparison of secondary ion mass spectral data and californium-252 plasma desorption data from reference compounds. Int. J. Mass Spectrom. 189:79–92.
- Wade, E. E., G. R. Farquar, P. T. Steele, E. L. McJimpsey, C. B. Lebrilla, and D. P. Fergenson. 2008. Wavelength and size dependence in single particle laser aerosol mass spectra. J. Aerosol Sci. 39 (8):657–66. doi:10.1016/j.jaerosci.2008.03.007.
- Wenzel, R. J., and K. A. Prather. 2004. Improvements in ion signal reproducibility obtained using a homogeneous laser beam for on-line laser desorption/ionization of single particles. Rapid Commun. Mass Spectrom. 18 (13):1525–33. doi:10.1002/rcm.1509.
- Wex, H., S. Augustin-Bauditz, Y. Boose, C. Budke, J. Curtius, K. Diehl, A. Dreyer, F. Frank, S. Hartmann, N. Hiranuma, E. Jantsch, Z. A. Kanji, A. Kiselev, T. Koop, O. Möhler, D. Niedermeier, B. Nillius, M. Rösch, D. Rose, … F. Stratmann. 2015. Intercomparing different devices for the investigation of ice nucleating particles using Snomax® as test substance. Atmos. Chem. Phys. 15 (3):1463–85. doi:10.5194/acp-15-1463-2015.
- Willeke, K., X. Lin, and S. A. Grinshpun. 1998. Improved aerosol collection by combined impaction and centrifugal motion. Aeros. Sci. Technol. 28 (5):439–56. doi:10.1080/02786829808965536.
- Woods, E., G. D. Smith, R. E. Miller, and T. Baer. 2002. Depth profiling of heterogeneously mixed aerosol particles using single-particle mass spectrometry. Anal. Chem. 74 (7):1642–9. doi:10.1021/ac0110909.
- Wright, T. P., J. D. Hader, G. R. McMeeking, and M. D. Petters. 2014. High relative humidity as a trigger for widespread release of ice nuclei. Aerosol Sci. Technol. 48 (11):i–v. doi:10.1080/02786826.2014.968244.
- Wright, T. P., and M. D. Petters. 2013. The role of time in heterogeneous freezing nucleation. J. Geophys. Res. Atmos. 118 (9):3731–43. doi:10.1002/jgrd.503652013.
- Wright, T. P. and M. D. Petters. 2019. mdpetters/Drop-Freezing-Detection: v1 (Version v1). Zenodo. doi:10.5281/zenodo.3271562.
- Yadav, S., R. E. Venezia, R. W. Paerl, and M. D. Petters. 2019. Characterization of ice nucleating particles over Northern India. J. Geophys. Res. Atmos. 124:10467–82. doi:10.1029/2019JD030702.
- Yamaguchi, N., T. Ichijo, A. Sakotani, T. Baba, and M. Nasu. 2012. Global dispersion of bacterial cells on Asian dust. Sci. Rep. 2 (November 2010):525–6. doi:10.1038/srep00525.
- Zawadowicz, M. A., K. D. Froyd, D. M. Murphy, and D. J. Cziczo. 2017. Improved identification of primary biological aerosol particles using single-particle mass spectrometry. Atmos. Chem. Phys. 17 (11):7193–212. doi:10.5194/acp-17-7193-2017.
- Zawadowicz, M. A., K. D. Froyd, A. E. Perring, D. M. Murphy, D. V. Spracklen, C. L. Heald, P. R. Buseck, and D. J. Cziczo. 2019. Model-measurement consistency and limits of bioaerosol abundance over the continental United States. Atmos. Chem. Phys. 19 (22):13859–70. doi:10.5194/acp-19-13859-2019.
- Zender, C. S. 2004. Quantifying mineral dust mass budgets: Terminology, constraints, and current estimates. EOS 85 (48):509–12. doi:10.1029/2003JD003483.