
 ?Mathematical formulae have been encoded as MathML and are displayed in this HTML version using MathJax in order to improve their display. Uncheck the box to turn MathJax off. This feature requires Javascript. Click on a formula to zoom.
Abstract
High-throughput, laboratory units for generation of aircraft-like soot are needed to quantify and understand the impact of such emissions on public health and climate change due to the high costs and limited access to aircraft engines. Enclosed spray combustion of jet fuel is used here to generate high soot concentrations, up to 255 mg/m3, three orders of magnitude higher than those typically obtained by widely used soot generators that use vapor-fed flames. This is attributed mostly to the use of real jet fuels. The large mass concentrations enable routine characterization of the soot specific surface area (SSA) and pore size distribution (PSD) by N2 adsorption. The geometric mean mobility diameter, of soot agglomerates was systematically varied from 15 to 180 nm by varying the equivalence ratio (EQR) at constant fuel feed rates, while the organic to total carbon (OC/TC) ratio is low (<20%) at all conditions. The geometric mean primary particle (PP) diameter,
standard deviation, σg,p, and mass-mobility exponent, Dfm, were hardly altered in that EQR range. These measured Dfm and σg,p indicate that soot PPs were sinter-bonded by surface growth, in agreement with aircraft emissions literature. Most importantly, soot made at EQR ≤ 1.34 has mainly small pores (<2 nm) and similar morphology (Dfm = 2.52 ± 0.17), SSA (160 − 239 m2/g), OC/TC (< 20%),
(15 − 61 nm) and
(14 nm) with those from high-thrust aircraft emissions.
EDITOR:
1. Introduction
Aviation is a significant source of ultrafine soot (dm < 100 nm) in the atmosphere (Westerdahl et al. Citation2008). These particles are most concerning as they have greater and more systemic inflammatory and cytotoxic responses than fine (dm < 2.5 µm) and coarse (dm < 10 µm) particulate emissions (Cassee et al. Citation2013). The SSA which is important for assessing the toxicity of such nanoparticles (Schmid and Stoeger Citation2016) along with the PSD (Marcolli, Mahrt, and Kärcher Citation2021) of soot also determine the rate of its atmospheric aging (Zhang et al. Citation2008), direct radiative forcing and propensity to act as cloud condensation nuclei. Thus, determination of SSA and PSD of aircraft soot emissions is essential to understand and quantify their impact on climate and public health. This is not trivial as there are hardly any laboratory generators of soot to provide sufficient quantities for its SSA and PSD characterization.
The size, morphology and composition of aircraft soot emissions vary significantly with the applied thrust of their engines (Elser et al. Citation2019): 80 − 100% thrust is used at take-off (Koudis et al. Citation2017), 85% while climbing, 60% during cruise (Elser et al. Citation2019), 30% during approach and 7% during taxi/idle (ICAO Citation2008). These landing and take-off points are referenced to maximum sea-level-static thrust (ICAO Citation2008), which may differ when not at sea-level such as at cruise (Abegglen et al. Citation2015). During aircraft engine operation at high thrust (> 50%), small agglomerates of soot nanoparticles are emitted having ranging from 11 (Boies et al. Citation2015) up to 61 nm (Abegglen et al. Citation2015) and
ranging from 10 nm at 50% thrust (Boies et al. Citation2015) to 18 nm at maximum thrust (100%; Liati et al. Citation2014). The morphology of these agglomerates is quantified by their Dfm that ranges from 2.6 to 2.8 at high-thrust levels (Abegglen et al. Citation2015). The organic (OC) to total carbon (TC) mass ratio of soot emitted from high-thrust aircraft engines is consistently small (< 25%; Marhaba et al. Citation2019). The mass concentration of soot within an aircraft plume is rather high ranging from 0.3 to 18’200 μg/m3 (Agarwal et al. Citation2019). These soot emissions are sampled at 16 − 25 L/min (Lobo et al. Citation2015). Accurate characterization of soot SSA and PSD by N2 adsorption requires a total sample surface area of at least 5 m2 (Karg et al. Citation2008). Given that the SSA of carbonaceous nanoparticles is 24 − 807 m2/g (Ouf et al. Citation2019), aircraft soot emissions should be sampled for 1 − 24 h. This is beyond the common sampling times of about 10 − 20 min allowed for aircraft engine tests (Lobo et al. Citation2015). So, the mass concentration of aircraft soot emissions is not high enough to enable the characterization of their SSA and PSD by N2 adsorption and other techniques. Typically, the SSA of high-thrust aircraft soot has been determined indirectly with large uncertainty by microscopy (Bourrous et al. Citation2018), mass-mobility and laser induced incandescence measurements ranging from 255 to 1339 m2/g (Boies et al. Citation2015). These techniques cannot provide though the PSD and total (internal and external) SSA of aircraft soot. Furthermore, the large uncertainty regarding the SSA of aviation emissions can be attributed to the porosity and necking between soot PPs that is not accounted for by the above methods (Eggersdorfer et al. Citation2012). So, benchmarking the SSA obtained from such techniques with the total SSA measured from N2 adsorption is essential to limit the uncertainty regarding the impact of aircraft soot on public health and climate.
In this regard, laboratory generators of aircraft-like soot emissions (Durdina et al. Citation2016) can assist in their characterization and determine their climate and public health impact. However, most of the currently available generators cannot produce particles with both small and low OC/TC that are typical for high-thrust aircraft emissions (Durdina et al. Citation2016). For example, the Argonaut Scientific burner produces soot with low OC/TC (≤ 12%) but large
(≥ 89 nm; Kazemimanesh et al. Citation2019). The McKenna burner typically produces soot with
< 50 nm that contains rather large amounts of organic carbon (≥ 30%; Maricq Citation2014). The miniCAST generator is a good source of low-thrust aircraft-like soot having
between 11 and 88 nm and OC/TC ≥ 50% (Moore et al. Citation2014). Despite the recent synthesis of soot nanoparticles with low OC/TC using miniCAST with an air pre-mix and lean flame, their
was still well above 50 nm (Ess and Vasilatou Citation2019) and the
range commonly measured for aircraft soot (Durdina et al. Citation2016). The above generators rely on combustion of propane (Ess and Vasilatou Citation2019) or ethylene (Kazemimanesh et al. Citation2019) that much differ from the heavy hydrocarbons in jet fuels (Saggese et al. Citation2019). Just doping ethylene flames with 13 wt % of vaporized jet fuel tripled the soot mass concentration (Saggese et al. Citation2019). Still, the impact of the jet fuel droplet formation and vaporization that is present in real aircraft engines (Mueller and Pitsch Citation2013) is not accounted for in gaseous flames (Saggese et al. Citation2019). Recently, jet fuel spray combustion was used to produce soot with similar dm and OC content to that from high-thrust aircraft emissions (Kholghy and DeRosa Citation2021). None of the above generators, however, can produce high mass concentrations of aircraft-like soot with
≤ 50 nm, to the best of our knowledge. So, such generators need to be operated for several hours (e.g., at least 5 h for the latest miniCAST generator by Ess and Vasilatou Citation2019) to collect enough soot for determination of its SSA and PSD (Ouf et al. Citation2019).
Here, enclosed and nitrogen-quenched spray combustion (Teleki et al. Citation2008) of jet fuel is used for high-throughput synthesis of high-thrust aircraft-like soot enabling routine measurement of its SSA and PSD. Enclosing the spray flame prevents uncontrolled soot oxidation by air entrainment and enhances the emitted soot mass concentration. This enables the offline characterization of soot by N2 adsorption and other techniques that are not possible by conventional spray combustion of jet fuel (Kholghy and DeRosa Citation2021). By varying the EQR, the of soot is controlled and its morphology is characterized by the measured Dfm and compared to theoretical power laws for agglomerates (Sorensen Citation2011) and aggregates (Kelesidis, Goudeli, and Pratsinis Citation2017b). The goal of this work is the high-throughput generation of soot having properties similar to that of aviation emissions as running actual aircraft engines for soot generation is too cumbersome and expensive. This is essential for the calibration of laser diagnostics to assist the accurate detection, characterization (Durdina et al. Citation2016) and filtration (Mader, Flagan, and Seinfeld Citation2001) of such emissions, as well as for determination of their impact on public health (Schmid and Stoeger Citation2016) and climate (Lohmann et al. Citation2020). The burner used here can be readily implemented similar to those marketed by ParteQ. Data from such burners can be used to support policy discussions related to sustainable aviation fuels (SAFs; Chao et al. Citation2019), as well as to investigate the effect of transitioning from aromatic-containing jet A1 to paraffinic or cycloparaffinic SAFs (Huq et al. Citation2021) on soot production and particle properties.
2. Experimental
2.1. Particle production
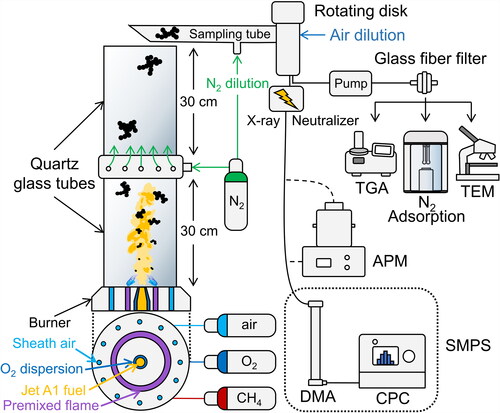
shows a schematic of the experimental set-up. Soot was produced by jet A1 fuel (Birrfeld Airport, Lupfig, Switzerland) spray combustion using an external-mixing, twin fluid nozzle (Mädler et al. Citation2002) enclosed in two, 30 cm long quartz glass tubes (each with a 42 mm inner diameter) in series (Teleki et al. Citation2008). The spray was ignited and sustained by a supporting premixed methane/oxygen flame (CH4 = 1.25 L/min, O2 = 2.25 L/min). Here, 4.5 mL/min of fuel flowed through a capillary (0.413 mm inner diameter) using a syringe pump (Teledyne 1000 D) and was dispersed into a fine spray with 1.5 − 3.0 L/min of O2 to vary the equivalence ratio (EQR) from 1.59 to 1.25, as calculated accounting for both fuels (i.e., CH4 and jet A1) and all three O2 sources (i.e., supporting premixed flame, dispersion gas and sheath air streams) in the supporting information (SI). Increasing EQR beyond 1.59 results in too large soot agglomerates (e.g., = 180 nm, Figure S1a) that are beyond the scope of this work while EQR below 1.25 results in too low soot concentrations for SSA and PSD determination. Sheath air was fed through 12 evenly spaced holes surrounding the spray flame at 20 L/min. A torus ring with 12 jet outlets between the two tubes was used to introduce 20 L/min of N2 in an upward swirled pattern to quench the flame and dilute the exhaust aerosol (Teleki et al. Citation2009). Maximum axial temperatures, T = 1500 and 1730 K are measured here at EQR = 1.59 and 1.34, respectively, at the centerline of the spray flame. The T = 1730 K obtained at EQR = 1.34 that gives soot with similar characteristics (OC/TC,
) to aircraft emissions at high-thrust (Marhaba et al. Citation2019) is consistent with the maximum T = 1850 K measured at the centerline of a gas turbine combustor (Meier et al. Citation2011).
Figure 1. Schematic of experimental set-up with spray combustion (not to scale) enclosed in two 30 cm long quartz glass tubes with 20 L/min of nitrogen added between the tubes with a torus ring (Teleki et al. Citation2009). Particles are sampled (Goudeli, Gröhn, and Pratsinis Citation2016) after the second glass tube and diluted with nitrogen. Most of the flow is then sent through a glass fiber filter for offline N2 adsorption analysis, thermogravimetric analysis (TGA) and transmission electron microscopy (TEM) of the collected soot. The remaining flow is further diluted with a rotating disk dilution system and sent through an X-ray neutralizer followed by a differential mobility analyzer (DMA) and condensation particle counter (CPC), which typically make up a scanning mobility particle sizer (SMPS). Broken lines represent tubing which was added only temporarily for tandem aerosol particle mass (APM) APM–SMPS measurements.
2.2. Particle sampling and on-line characterization
A straight tube (Goudeli, Gröhn, and Pratsinis Citation2016) was used to sample 12 L/min of soot aerosol at the top of the second tube (i.e., ∼63 cm above the burner) while 10 L/min of N2 dilution were added directly to the sampling tube downstream of its inlet. A rotating disk diluter (MD 19-1E, Matter Engineering AG) further diluted the aerosol by a factor of 1000 with clean air. The diluted aerosol is directed to an X-ray neutralizer (TSI 3087) and a differential mobility analyzer (DMA, TSI 3081) coupled with a condensation particle counter (CPC, TSI 3775) that commonly make up a scanning mobility particle spectrometer (SMPS). This was used to measure the mobility size distribution, as well as the dm of rather monodisperse (σg,m ∼ 1.18) soot agglomerates with mass, m, selected by an aerosol particle mass (APM) analyzer (Eggersdorfer et al. Citation2012). The latter dm was obtained only for singly charged soot agglomerates that have the largest number-based fraction in the dm distribution (Wiedensohler Citation1988). The number of PPs per agglomerate, np, is related to m and dm by (Eggersdorfer et al. Citation2012):
(1)
(1)
where km is the mass-mobility prefactor, and
is the geometric mean PP mass.
2.3. Offline analysis
The sampled soot that by-passes the rotating disk diluter was collected on a glass fiber filter for offline analyses. In particular, the OC/TC of soot was obtained by thermogravimetric analysis (TGA) (Klingshirn et al. Citation2019). Modifying the protocol of Klingshirn et al. (Citation2019), the samples were first placed in N2 to volatilize OC and then in air to oxidize the elemental carbon (EC). The sample heating begun at 30 °C in N2 and was ramped up to 900 °C at 20 °C/min. The temperature was held at 900 °C for 10 min before dropping back to 30 °C at 20 °C/min. The same temperature profile was then repeated in air. From the TGA mass loss (Figure S2), the OC/TC was estimated as the ratio of mass lost under N2 divided by the total mass lost in both stages. A small amount of inorganics (1 − 7 wt %) could not be oxidized. This was attributed to glass fibers from the collection filters and was not included in the calculation of OC/TC. OC/TC was also determined by thermal optical analysis (TOA) using an OCEC Carbon Aerosol Analyzer (Sunset Laboratory, Model 3) following the modified EUSAAR2 protocol (Cavalli et al. Citation2010).
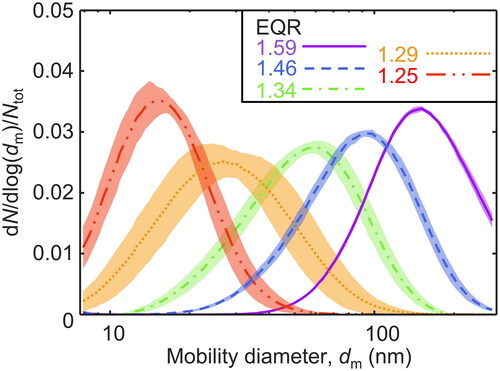
Figure 2. Normalized soot number concentration, dN/dlog(dm)/Ntot, as a function of mobility diameter, dm, at various equivalence ratios (EQR). The shaded areas represent one standard deviation between, at least, 9 measurements.
The specific surface area, SSA, of 20 − 30 mg soot samples degassed for 1 h at 200 °C was determined by N2 adsorption (Micrometrics Tristar II Plus) at relative pressures, p/po, from approximately 0 to 0.3 using the Brunauer, Emmett and Teller (BET) method (Brunauer, Emmett, and Teller Citation1938). Furthermore, the PSD of soot was derived based on its isotherms during N2 adsorption using the Barrett, Joyner and Halenda (BJH) method (Barrett, Joyner, and Halenda Citation1951). Both BET and BJH analysis methods are applied using the Tristar II Plus software.
Soot PPs selected from the entire, polydisperse soot agglomerate population deposited and collected from the glass fiber filter were imaged with transmission electron microscopy (TEM, FEI Tecnai F30 FEG). That way, the dp distribution obtained here can be compared consistently to those measured similarly from aircraft engines (Liati et al. Citation2014). In particular, powder samples were dispersed in ethanol and ultrasonicated to break up large agglomerates. Then, a drop of ethanol was placed and dried on the TEM grid (Strobel et al. Citation2004). The dp was determined by manually placing ellipses over the PPs in ImageJ (Schneider, Rasband, and Eliceiri Citation2012) and calculating the area-equivalent diameter. The soot measured by TEM levels off after counting 200 PPs (Figure S3), consistent with microscopy analysis of premixed flame soot (Kelesidis et al. Citation2020) and TiO2 (Tsantilis, Kammler, and Pratsinis Citation2002). The SSATEM also can be calculated from TEM-counted
assuming nanoparticles in point contact (Rissler et al. Citation2013):
(2)
(2)
where ρ = 1800 kg/m3 is the mature soot bulk density (Bond and Bergstrom Citation2006).
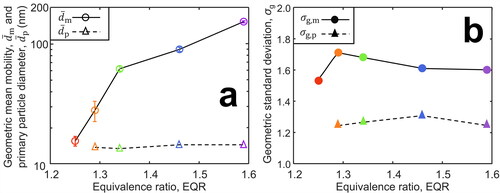
Figure 3. (a) The geometric mean mobility, (open circles), and PP diameter,
(open triangles), as well as (b) the geometric standard deviation of the mobility, σg,m (filled circles), and PP size distributions, σg,p (filled triangles), as a function of EQR. Error bars represent the standard deviation between, at least, 9 measurements.
3. Results and discussion
3.1. Impact of EQR on soot 
shows the normalized agglomerate number concentration, dN/dlog(dm)/Ntot, as a function of mobility diameter, dm, of soot made at EQR = 1.25 (double dot-broken line), 1.29 (dotted line), 1.34 (dot-broken line), 1.46 (broken line) and 1.59 (solid line). Shade around each line represents the standard deviation between, at least, 9 individual size distribution measurements at that EQR.
Clearly, increasing EQR shifts the mobility size distribution to larger dm. shows the as a function of EQR (open circles) with error bars representing the standard deviation between at least 9 individual measurements. Increasing EQR from 1.25 to 1.59, increases
from 15 to 153 nm, due to increasing soot mass concentration with EQR (Glassman and Yetter Citation2007) that leads to larger agglomerates (Kelesidis, Goudeli, and Pratsinis Citation2017a). The
of soot made at EQR ≤ 1.34 is in good agreement with those typically measured from aircraft engines at high (> 50%) thrust. For example, Abegglen et al. (Citation2015) obtained
between 45 and 61 nm at 65 and 100% thrust, respectively. Boies et al. (Citation2015) measured soot with
= 11 − 28 nm at thrusts above 50%. The good agreement between the
of soot produced here at EQR ≤ 1.34 and that of aircraft emissions can be attributed to the high T (1730 K) of the enclosed spray flame that is consistent with that (1850 K) measured in aircraft combustors (Meier et al. Citation2011). In contrast, the maximum T drops to 1540 K at EQR > 1.34 resulting in soot with larger
than that of aircraft emissions. It should be noted though that soot coagulates at high pressures (> 1 bar) and short residence times in aircraft combustors (Jones, Marquis, and Vogiatzaki Citation2014). Soot nanoparticles formed at atmospheric pressures can attain similar dm distributions with those produced at high pressures by coagulation at long residence times (Kelesidis and Goudeli Citation2021: Figure S4). So, the long residence times that are present during enclosed spray combustion of jet fuel enable the synthesis of soot nanoparticles with similar
and σg,m with those measured from aircraft engines.
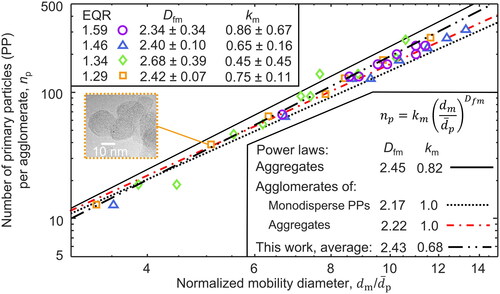
Figure 4. The number of soot PPs per agglomerate, np, as a function of their normalized mobility diameter, dm/ produced at various EQR and measured by APM-SMPS (symbols and double dot-broken line). Power laws derived for aggregates (Kelesidis, Goudeli, and Pratsinis Citation2017b; solid line) and agglomerates of monodisperse PPs in point contact (Sorensen Citation2011; dotted line) or aggregates of polydisperse and chemically bonded PPs (Kelesidis, Goudeli, and Pratsinis Citation2017a; dot-broken line) are shown also. The inset shows an exemplary TEM image of soot made at EQR = 1.29.
The width of the mobility size distribution is quantified by the geometric standard deviation, σg,m (; filled circles), that hardly changes from 1.53 up to 1.71. The σg,m measured here at all EQR is smaller than the self-preserving σg,m = 2.03 for agglomerates of PPs in point contact in the free molecular regime (Goudeli, Eggersdorfer, and Pratsinis Citation2015). This can be attributed to formation of aggregates (by surface reactions and condensation) that narrow the self-preserving size distribution (Kelesidis, Goudeli, and Pratsinis Citation2017b). Soot agglomerates formed at EQR > 1.25 coagulate largely in the transition regime. Then the σg,m of 1.68 and 1.71 of soot made at EQR = 1.34 and 1.29 are consistent with the σg,m = 1.66 (Abegglen et al. Citation2015) up to σg,m = 1.80 (Lobo et al. Citation2015) measured from high-thrust aircraft engine emissions at comparable to those from Abegglen et al. (Citation2015) and Lobo et al. (Citation2015).
The soot PP size distribution was obtained from microscopy images at all EQR (Figure S4). shows (a; open triangles) and geometric standard deviation of the PP size distribution, σg,p (b; filled triangles) as a function of EQR. Unlike
the
obtained from the entire soot agglomerate population is hardly affected by EQR and ranges from 13.3 to 14.3 nm. This is consistent with the small
variation in fuel rich miniCAST reactors operating at EQR = 1.12 − 1.33 (Saffaripour et al. Citation2017). Most importantly, the
= 13.9 ± 0.5 nm averaged over all EQR is consistent with the
measured for high-thrust aircraft soot from 10 (Boies et al. Citation2015) to 18 nm (Liati et al. Citation2014) with a mean value of 15.8 ± 2.1 nm (Marhaba et al. Citation2019; Boies et al. Citation2015; Liati et al. Citation2014). Figure S5 shows the distribution of dp from Liati et al. (Citation2014) and Marhaba et al. (Citation2019) and the lognormal fittings of the data to obtain the
for comparison.
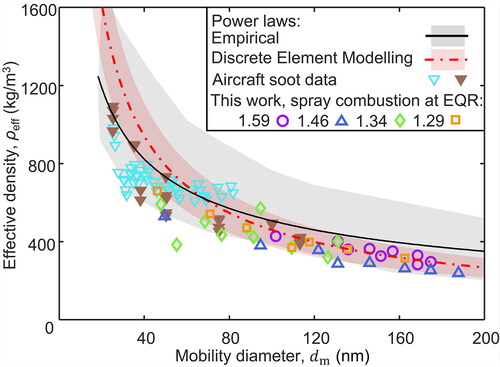
Figure 5. Effective density, ρeff, as a function of dm of soot from enclosed spray combustion at EQR = 1.59 (circles), 1.46 (triangles), 1.34 (diamonds) and 1.29 (squares) in comparison to data from an airplane (Johnson et al. Citation2015; open inverse triangles) and a helicopter engine (Olfert et al. Citation2017; filled inverse triangles). The measured soot ρeff are compared also to those obtained from a power law derived by DEM for surface growth and agglomeration (Kelesidis, Goudeli, and Pratsinis Citation2017b; red dot-broken line and red shaded area), as well as an empirical power law extracted from engine data (Olfert and Rogak Citation2019; black solid line and gray shaded area).
Similarly, the σg,p is rather constant at all EQR, ranging from 1.25 to 1.30 and also well below its self-preserving size distribution value of 1.45 (Goudeli, Eggersdorfer, and Pratsinis Citation2015) indicating again the significance of surface growth during coagulation. The σg,p measured here is consistent with those from open premixed (σg,p = 1.25; Kelesidis et al. Citation2020) and spray flames (σg,p = 1.25; Kholghy and DeRosa Citation2021) as well as with those estimated by discrete element modeling (DEM) for surface growth and agglomeration (σg,p = 1.2; Kelesidis, Goudeli, and Pratsinis Citation2017a).
The variation of soot dp with its dm (that is equivalent to the projected-area diameter at these conditions; Rogak, Flagan, and Nguyen Citation1993) is also elucidated by interfacing mass-mobility data from enclosed spray combustion at EQR = 1.59 (Figure S6; circles), 1.46 (triangles), 1.34 (diamonds) and 1.29 (squares) with a power law (Kelesidis et al. Citation2020). As the dm of single soot agglomerates increases from 50 to 100 nm, their dp increases from 10.8 ± 2.2 nm to about 15.2 ± 1.1 nm. This indicates that large soot agglomerates (e.g., dm = 100 nm) formed at long residence times are mixed with small soot agglomerates (e.g., dm = 50 nm) produced at short residence times with limited surface growth during enclosed spray combustion (Olfert and Rogak Citation2019). Further increasing of dm does not affect the soot dp. The variation of dp with dm measured here for soot from enclosed spray combustion is in excellent agreement with that from open one (Kholghy and DeRosa Citation2021; inverse triangles) and consistent with an empirical power law from engine soot (Olfert and Rogak Citation2019; solid line and shaded area).
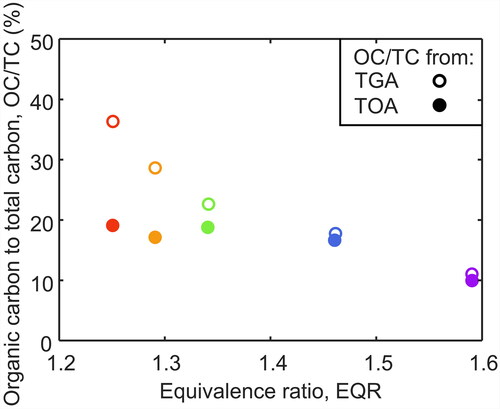
Figure 6. The present OC/TC of soot from TGA (open symbols) and TOA (filled symbols) as a function of EQR.
3.2. Soot morphology
A tandem APM-SMPS was used to quantify the mass-mobility relationship of soot. The np distribution was obtained using EquationEquation (1)(1)
(1) and the APM-SMPS data. shows the np as a function of normalized mobility diameter,
/
of soot made at EQR 1.59 (circles), 1.46 (triangles), 1.34 (diamonds) and 1.29 (squares). No data are shown for EQR = 1.25 as APM cannot analyze accurately particles with dm < 50 nm (Tajima et al. Citation2013). The average Dfm and km for all EQR were 2.43 ± 0.1 and 0.68 ± 0.16 (double dot-broken line, EquationEquation (1)
(1)
(1) ), respectively.
The average km of 0.68 (symbols) is on par with the km = 0.68 from partially compacted, flame-made soot agglomerates (Kelesidis et al. Citation2018). This small km indicates that the present soot agglomerates are rather asymmetric and contain only a few branches, consistent with TEM as shown in (Figure S4) (Heinson, Sorensen, and Chakrabarti Citation2010). All APM-SMPS data are bracketed largely between the mass-mobility relationships for agglomerates of monodisperse PPs in point contact with Dfm = 2.17 ± 0.1 and km = 1.0 (Sorensen Citation2011; dotted line, EquationEquation (1)(1)
(1) ) and aggregates of PPs made by agglomeration and surface growth with Dfm = 2.45 ± 0.05 and km = 0.82 (Kelesidis, Goudeli, and Pratsinis Citation2017b; solid line, EquationEquation (1)
(1)
(1) ). Agglomeration seems to be the primary growth mechanism, but surface reactions also contribute as they result in formation of polydisperse and chemically bonded PPs. In this regard, np, measured for soot from enclosed spray combustion (; symbols) is described best by a DEM-derived power law for agglomerates of polydisperse and chemically bonded PPs (Kelesidis, Goudeli, and Pratsinis Citation2017b; EquationEquation (1)
(1)
(1) with Dfm = 2.22 and km = 1; dot-broken line). As the data lean largely to the latter relationship, this further indicates that soot grows by surface reactions and agglomeration, consistent with its necking in TEM images (; inset). High-thrust aircraft engines typically produce soot with Dfm from 2.62 (Olfert et al. Citation2017) to 2.79 (Abegglen et al. Citation2015), similar to Dfm of soot made here at EQR = 1.34.
compares the soot effective density, ρeff, measured here from enclosed spray combustion (circles, triangles, diamonds and squares) to those obtained from various engines summarized by Olfert and Rogak (Citation2019; solid line and gray shaded area). In particular, the ρeff of soot from enclosed spray combustion is at the lower end of the average engine soot ρeff, but in excellent agreement with that measured from an airplane (Johnson et al. Citation2015; open inverse triangles) and a helicopter engine (Olfert et al. Citation2017; filled inverse triangles). In this regard, the ρeff of aircraft (open and filled inverse triangles) and enclosed spray flame combustion (circles, triangles, diamonds and squares) soot is in good agreement with that estimated by a DEM-derived power law (Kelesidis, Goudeli, and Pratsinis Citation2017b; dot-broken line and red shaded area). So, the ρeff of soot formed during jet fuel combustion in enclosed spray flames and aircraft engines seems to be determined by surface growth and agglomeration.
3.3. Organic carbon content of soot
shows the soot OC/TC measured by TOA (filled symbols) and TGA (open symbols) as a function of EQR. The OC/TC derived by TOA (; filled symbols) decreases from 19 to 10% as EQR increases from 1.25 to 1.59. Across the same range, the TGA-derived OC/TC (; open symbols) drops from 36 to 11%. The reduction of OC/TC with increasing EQR and can be attributed to the increasing degree of soot maturation and oxidation at such conditions, corroborating DEM simulations (Kelesidis, Bruun, and Pratsinis Citation2021). The TOA- (filled symbols) and TGA-derived (open symbols) OC/TC are practically identical for soot formed at EQR > 1.34. At EQR ≤ 1.34 though, the TGA-derived OC/TC is up to 17% larger than that obtained by TOA. This is consistent with TGA measurements of aircraft soot that resulted in 20% larger OC/TC than that measured by TOA (Klingshirn et al. Citation2019; ). The difference between the TOA- and TGA-derived OC/TC can be attributed to the larger temperature used in the latter analysis (650 vs. 900 °C) that may result in charring or desorption of semi-volatile organic compounds (Schauer et al. Citation2003). This disparity could also indicate the presence of inorganic volatile compounds in soot formed at EQR ≤ 1.34 that are not accounted for by TOA (Corbin et al. Citation2020).
Table 1. The OC/TC of soot from various aircraft engines, as well as from enclosed spray combustion at EQR = 1.25 – 1.34 measured by TOA and/or TGA.
It should be noted that soot made at EQR > 1.34 has larger than that measured from aircraft emissions (Abegglen et al. Citation2015). In contrast, soot made at EQR ≤ 1.34 has similar
(15 − 61 nm; Abegglen et al. Citation2015), TOA- (Delhaye et al. Citation2017; Elser et al. Citation2019; Marhaba et al. Citation2019; Klingshirn et al. Citation2019) and TGA-derived (Klingshirn et al. Citation2019) OC/TC with those obtained from aircraft soot, as shown in . Furthermore, the OC/TC = 17 − 19% measured here by TOA for soot from enclosed spray combustion of jet fuel at EQR = 1.25 − 1.34 is within the SAE ARP6320A requirements of TOA-derived OC/TC < 20% for calibration of aircraft emission instrumentation (Lobo et al. Citation2015).
3.4. Soot mass concentrations
compares the produced soot mass concentration as a function of from enclosed (circles) and open spray combustion units (Kholghy and DeRosa Citation2021; squares) as well as a 5201 miniCAST with low organic carbon content (≤ 25%; Ess and Vasilatou Citation2019; triangles). The mass concentrations of miniCAST soot shown in (triangles) have been corrected to eliminate the impact of dilution (Ess and Vasilatou Citation2019). The soot mass concentrations from spray combustion are measured directly by APM-SMPS. Enclosing the spray combustion unit substantially increased the soot production rate and mass concentration of soot with
≤ 50 nm in comparison to open units (Kholghy and DeRosa Citation2021) and miniCAST soot generators (Ess and Vasilatou Citation2019). The mass concentrations from the latter were originally determined indirectly with an aethalometer using a mass absorption cross-section, MAC, of 7.77 m2/g for a wavelength of 880 nm (Ess and Vasilatou Citation2019; Figure S7; filled triangles). This MAC is much larger than the typically accepted value of 4.69 m2/g at 880 nm for mature soot (Bond and Bergstrom Citation2006). The presence of organic carbon can further reduce the MAC of soot (Kelesidis, Bruun, and Pratsinis Citation2021). Here, the soot mass concentrations from a miniCAST generator (Ess and Vasilatou Citation2019) are obtained using the latter MAC that accounts for the realistic organic carbon content of soot made at these conditions (triangles). Accounting for the realistic soot composition increased the miniCAST mass concentrations by a factor of 2.4 (Figure S7; filled triangles), consistent with similar analysis for premixed flames (Kelesidis and Pratsinis Citation2021).
Figure 7. The mass concentration, M, of soot produced from enclosed (circles) and open spray combustion units (Kholghy and DeRosa Citation2021; squares) as a function of as well as a 5201 miniCAST (Ess and Vasilatou Citation2019; triangles) with its data corrected with a realistic MAC.
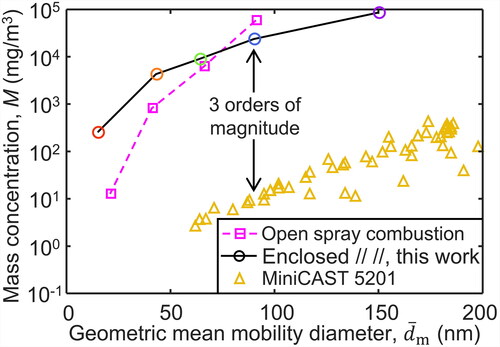
For all soot generators, the emitted mass concentration increases with as expected. The spray combustion units systematically produce much more soot than the miniCAST. For example, the soot mass concentrations with
= 65 nm from enclosed spray combustion were three orders of magnitude higher than the miniCAST, while the molar flow rate (calculated in the SI) in the enclosed unit (0.02 mol/min; circles) was only an order of magnitude higher than that in the miniCAST (0.003 mol/min; triangles). This is consistent with laser induced incandescence measurements (Saggese et al. Citation2019) revealing that doping a diffusion ethylene flame with 13 wt % of jet fuel tripled the maximum soot mass concentration. The large increase of soot mass concentrations by combusting jet fuel instead of propane or ethylene could be attributed to the fast evaporation of jet fuel droplets resulting in high molecular weight hydrocarbons that enhance soot nucleation and its mass concentration (Saggese et al. Citation2019). So, combustion of sprays facilitates soot formation as liquid jet fuel is composed of heavier hydrocarbons (Saffaripour et al. Citation2011) than common gaseous hydrocarbons used in current lab soot generators (Ess and Vasilatou Citation2019).
The enclosed spray combustion unit is able to produce up to 20 times higher mass concentrations of aircraft-like soot with < 50 nm than the open one. This is despite the nearly thrice lower fuel flow rate used here (4.5 mL/min) than in the open one (12 mL/min). The latter has a lean EQR of 0.35 (Kholghy and DeRosa Citation2021), while the enclosed unit has a rich EQR (1.25 − 1.59). Increasing EQR increases the emitted soot volume fraction and mass concentration (Maricq, Harris, and Szente Citation2003). Furthermore, enclosing the unit prevents the entrainment of atmospheric air in the flame (Waser et al. Citation2014) and limits soot oxidation. The N2 injection through the torus ring at HAB = 30 cm of the enclosed unit reduces the flame temperature (Teleki et al. Citation2009) and further mitigates soot oxidation.
3.5. Soot pore size distribution (PSD) and specific surface area (SSA)
The increased mass concentrations from the enclosed spray combustion unit enable the collection of enough soot (≥ 10 mg) for N2 adsorption and determination of PSD and SSA. So, the SSA of soot made at various EQR in have been obtained from N2 adsorption (Figure S8). The external SSATEM of soot based on the measured () using EquationEquation (2)
(2)
(2) is shown also in . The SSATEM from aircraft soot was calculated based on
reported in the literature from 10 (Boies et al. Citation2015) to 18 nm (Liati et al. Citation2014) which results in SSATEM from 333 to 185 m2/g, respectively, bracketing the present range of SSATEM from enclosed spray combustion soot. This indicates that the SSA and PSD measured here for enclosed spray combustion soot are equivalent to those of real aircraft soot. At EQR > 1.34 the SSATEM is smaller than the SSA suggesting that internal pores contribute also to the total SSA of soot.
Figure 8. Specific pore surface area concentration, dA/dlog(w), as a function of pore width, w, of soot made at EQR = 1.59 (solid line), 1.46 (broken line), 1.34 (dot-broken line) and 1.29 (dotted line) using the Barrett-Joyner-Halenda (BJH) method.
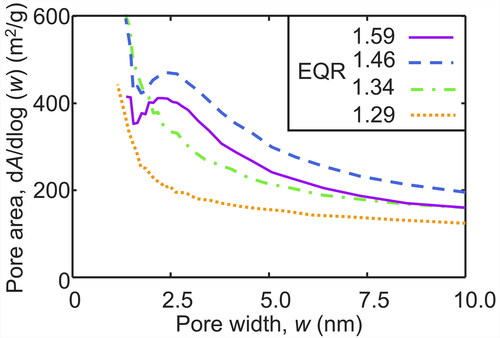
Table 2. The specific surface area spray combustion soot at four EQR by the N2 adsorption, SSA, and with transmission electron microscopy (TEM), SSATEM. The from the literature is used to estimate the SSATEM of aircraft soot from
= 10 (Boies et al. Citation2015) to 18 nm (Liati et al. Citation2014).
The presence of internal pores in the spray combustion soot at EQR > 1.29 was further investigated by deriving the PSD from the full N2 adsorption isotherm using the BJH method. shows the specific pore surface area concentration, dA/dlog(w), as a function of the pore width, w, derived for soot made at EQR = 1.59 (solid line), 1.46 (broken line), 1.34 (dot-broken line) and 1.29 (dotted line). At all EQR there is a sharp increase in the area concentration of pores with w = 1.4 nm, i.e., the lower detection limit of the N2 adsorption instrument used here. However, at EQR of 1.46 and 1.59, there are also peaks of the surface area concentration at about w = 2.5 nm. These pores can explain the larger SSA than SSATEM measured at these conditions (). These pores can be caused by internal oxidation which occurs at low temperatures (< 1100 K) (Kelesidis and Pratsinis Citation2019). Rich flames with high EQR exhibit lower temperatures than lean flames, as the peak flame temperature is attained at near stoichiometric conditions (Glassman and Yetter Citation2007). This could explain the enhanced internal porosity measured here at EQR = 1.46 and 1.59.
4. Conclusions
An enclosed jet A1 fuel spray combustion unit is used to produce soot with controlled geometric mean mobility diameter, from 15 to 153 nm by varying the combustion equivalence ratio (EQR). The morphology of the resulting soot agglomerates quantified by their mass-mobility exponent, Dfm = 2.43 ± 0.1 and prefactor, km = 0.68 ± 0.16 as well as the PP diameter,
= 13.9 nm, are largely constant regardless of EQR. These Dfm and km indicated necked soot agglomerates by surface growth, consistent with microscopy images and in agreement with data from aircraft emissions. Specifically, soot agglomerates made here at EQR ≤ 1.34 have similar morphology,
and
with those from high-thrust aircraft emissions.
The produced mass concentrations were, at least, three orders of magnitude larger than those obtained by the widely used miniCAST soot generator and for soot with = 30 nm more than 20 times larger than those attained by an open spray combustion unit using 2 − 3 times higher jet A1 fuel feed rates. The large production rates attained here facilitated the collection of soot to determine its specific surface area (SSA) and PSD. Thus, enclosed units can be used to produce large mass concentrations of aircraft-like soot, enabling the offline characterization of its SSA and PSD. Last but probably not least, the SSA of soot produced at EQR ≥ 1.46 is enhanced through the presence of pores with 2 − 4 nm width formed by internal oxidation. The SSA and PSD measured here for aircraft-like soot, for the first time to the best of our knowledge, can assist to determine the atmospheric aging rate of aviation emissions (Marcolli, Mahrt, and Kärcher Citation2021) and thus their atmospheric implications. The SSA of aviation emissions is also essential to derive robust soot oxidation rates (Kelesidis and Pratsinis Citation2019) and optimize the engine performance. Furthermore, the soot generator developed here based on enclosed spray combustion of liquid fuels can be used also to inform current policy-relevant discussions related to sustainable aviation fuels (SAFs; Chao et al. Citation2019) and to better understand how transitioning from aromatic-containing jet A1 to paraffinic or cycloparaffinic SAFs (Huq et al. Citation2021) would change soot particle production and particle properties.
Supplemental Material
Download ()Acknowledgments
We gratefully acknowledge Dr. F. Krumeich for the TEM imaging and the Environmental and Health Protection Laboratory of Zurich (UGZ) for OC/TC measurements. We also acknowledge stimulating discussions with Dr. L. Durdina (Zurich University of Applied Sciences) and Dr. K. Wegner, as well as help from Mr. M. Pereira Martins with the particle production.
Additional information
Funding
References
- Abegglen, M., L. Durdina, B. T. Brem, J. Wang, T. Rindlisbacher, J. C. Corbin, U. Lohmann, and B. Sierau. 2015. Effective density and mass – mobility exponents of particulate matter in aircraft turbine exhaust: Dependence on engine thrust and particle size. J. Aerosol. Sci. 88:135–47. doi:10.1016/j.jaerosci.2015.06.003.
- Agarwal, A., R. L. Speth, T. M. Fritz, S. D. Jacob, T. Rindlisbacher, R. Iovinelli, B. Owen, R. C. Miake-Lye, J. S. Sabnis, and S. Barrett. 2019. SCOPE11 method for estimating aircraft black carbon mass and particle number emissions. Environ. Sci. Technol. 53 (3):1364–73. doi:10.1021/acs.est.8b04060.
- Barrett, E. P., L. G. Joyner, and P. P. Halenda. 1951. The determination of pore volume and area distributions in porous substances. I. Computations from nitrogen isotherms. J. Am. Chem. Soc. 73 (1):373–80. doi:10.1021/ja01145a126.
- Boies, A. M., M. Stettler, J. J. Swanson, T. J. Johnson, J. S. Olfert, M. Johnson, M. L. Eggersdorfer, T. Rindlisbacher, J. Wang, K. Thomson, et al. 2015. Particle emission characteristics of a gas turbine with a double annular combustor. Aerosol. Sci. Technol. 49 (9):842–55. doi:10.1080/02786826.2015.1078452.
- Bond, T. C., and R. W. Bergstrom. 2006. Light absorption by carbonaceous particles: An investigative review. Aerosol. Sci. Technol. 40 (1):27–67. doi:10.1080/02786820500421521.
- Bourrous, S., Q. Ribeyre, L. Lintis, J. Yon, S. Bau, D. Thomas, V. Cécile, and F.-X. Ouf. 2018. A semi-automatic analysis tool for the determination of primary particle size, overlap coefficient and specific surface area of nanoparticles aggregates. J. Aerosol Sci. 126:122–32. doi:10.1016/j.jaerosci.2018.09.001.
- Brunauer, S., P. H. Emmett, and E. Teller. 1938. Adsorption of gases in multimolecular layers. J. Am. Chem. Soc. 60 (2):309–19. doi:10.1021/ja01269a023.
- Cassee, F. R., M. E. Héroux, M. E. Gerlofs-Nijland, and F. J. Kelly. 2013. Particulate matter beyond mass: Recent health evidence on the role of fractions, chemical constituents and sources of emission. Inhal. Toxicol. 25 (14):802–12. doi:10.3109/08958378.2013.850127.
- Cavalli, F., M. Viana, K. E. Yttri, J. Genberg, and J.-P. Putaud. 2010. Toward a standardised thermal-optical protocol for measuring atmospheric organic and elemental carbon: the EUSAAR protocol. Atmos. Meas. Tech. 3 (1):79–89. doi:10.5194/amt-3-79-2010.
- Chao, H., D. B. Agusdinata, D. DeLaurentis, and E. B. Stechel. 2019. Carbon offsetting and reduction scheme with sustainable aviation fuel options: Fleet-level carbon emissions impacts for U.S. airlines. Transp. Res. Part D Transp. Environ 75:42–56. doi:10.1016/j.trd.2019.08.015.
- Corbin, J. C., A. Moallemi, F. Liu, S. Gagné, J. S. Olfert, G. J. Smallwood, and P. Lobo. 2020. Closure between particulate matter concentrations measured ex situ by thermal–optical analysis and in situ by the CPMA–electrometer reference mass system. Aerosol Sci. Technol. 54 (11):1293–309. doi:10.1080/02786826.2020.1788710.
- Delhaye, D., F. X. Ouf, D. Ferry, I. K. Ortega, O. Penanhoat, S. Peillon, F. Salm, X. Vancassel, C. Focsa, C. Irimiea, et al. 2017. The MERMOSE project: Characterization of particulate matter emissions of a commercial aircraft engine. J. Aerosol Sci. 105:48–63. doi:10.1016/j.jaerosci.2016.11.018.
- Durdina, L., P. Lobo, M. B. Trueblood, E. A. Black, S. Achterberg, D. E. Hagen, B. T. Brem, and J. Wang. 2016. Response of real-time black carbon mass instruments to mini-CAST soot. Aerosol Sci. Technol. 50 (9):906–18. doi:10.1080/02786826.2016.1204423.
- Eggersdorfer, M. L., A. J. Gröhn, C. M. Sorensen, P. H. McMurry, and S. E. Pratsinis. 2012. Mass-mobility characterization of flame-made ZrO2 aerosols: Primary particle diameter and extent of aggregation. J. Colloid Interface Sci. 387 (1):12–23. doi:10.1016/J.JCIS.2012.07.078.
- Elser, M., B. T. Brem, L. Durdina, D. Schönenberger, F. Siegerist, A. Fischer, and J. Wang. 2019. Chemical composition and radiative properties of nascent particulate matter emitted by an aircraft turbofan burning conventional and alternative fuels. Atmos. Chem. Phys. 19 (10):6809–20. doi:10.5194/acp-19-6809-2019.
- Ess, M. N., and K. Vasilatou. 2019. Characterization of a new miniCAST with diffusion flame and premixed flame options: Generation of particles with high EC content in the size range 30 nm to 200 nm. Aerosol Sci. Technol. 53 (1):29–44. doi:10.1080/02786826.2018.1536818.
- Glassman, I., and R. A. Yetter. 2007. Combustion. Burlington, MA: Academic Press.
- Goudeli, E., M. L. Eggersdorfer, and S. E. Pratsinis. 2015. Coagulation-agglomeration of fractal-like particles: Structure and self-preserving size distribution. Langmuir 31 (4):1320–7. doi:10.1021/la504296z.
- Goudeli, E., A. J. Gröhn, and S. E. Pratsinis. 2016. Sampling and dilution of nanoparticles at high temperature. Aerosol Sci. Technol 50 (6):591–604. doi:10.1080/02786826.2016.1168922.
- Gröhn, A. J., S. E. Pratsinis, and K. Wegner. 2012. Fluid-particle dynamics during combustion spray aerosol synthesis of ZrO2. Chem. Eng. J. 191:491–502. doi:10.1016/j.cej.2012.02.093.
- Heinson, W. R., C. M. Sorensen, and A. Chakrabarti. 2010. Does shape anisotropy control the fractal dimension in diffusion-limited cluster-cluster aggregation? Aerosol Sci. Technol. 44 (12):i–iv. doi:10.1080/02786826.2010.516032.
- Huq, N. A., G. R. Hafenstine, X. Huo, H. Nguyen, S. M. Tifft, D. R. Conklin, D. Stück, J. Stunkel, Z. Yang, J. S. Heyne, et al. 2021. Toward net-zero sustainable aviation fuel with wet waste–derived volatile fatty acids. Proc. Natl. Acad. Sci. 118:1–11. doi:10.1073/pnas.2023008118.
- International Civil Aviation Organization. 2008. Environmental protection: international standards and recommended practices – Annex 16 to the convention on international civil aviation, vol. II, 3rd ed., Montreal, QC: Taylor & Francis.
- Johnson, T. J., J. S. Olfert, J. Symonds, M. Johnson, T. Rindlisbacher, J. J. Swanson, A. M. Boies, K. Thomson, G. Smallwood, D. Walters, et al. 2015. Effective density and mass-mobility exponent of aircraft turbine particulate matter. J. Propuls. Power 31 (2):573–80. doi:10.2514/1.B35367.
- Jones, W. P., A. J. Marquis, and K. Vogiatzaki. 2014. Large-eddy simulation of spray combustion in a gas turbine combustor. Combust. Flame 161 (1):222–39. doi:10.1016/j.combustflame.2013.07.016.
- Karg, E., G. A. Ferron, G. Schumann, and O. Schmid. 2008. Specific BET surface area measurement of low-mass-samples. In 12th ETH Conference on combustion generated nanoparticles, Zürich, Switzerland.
- Kazemimanesh, M., R. Dastanpour, A. Baldelli, A. Moallemi, K. A. Thomson, M. A. Jefferson, M. R. Johnson, S. N. Rogak, and J. S. Olfert. 2019. Size, effective density, morphology, and nano-structure of soot particles generated from buoyant turbulent diffusion flames. J. Aerosol Sci. 132:22–31. doi:10.1016/j.jaerosci.2019.03.005.
- Kelesidis, G. A., C. A. Bruun, and S. E. Pratsinis. 2021. The impact of organic carbon on soot light absorption. Carbon 172:742–9. doi:10.1016/j.carbon.2020.10.032.
- Kelesidis, G. A., F. M. Furrer, K. Wegner, and S. E. Pratsinis. 2018. Impact of humidity on silica nanoparticle agglomerate morphology and size distribution. Langmuir 34 (29):8532–41. doi:10.1021/acs.langmuir.8b00576.
- Kelesidis, G. A., and E. Goudeli. 2021. Self-preserving size distribution and collision frequency of flame-made nanoparticles in the transition regime. Proc. Combust. Inst 38 (1):1233–40. doi:10.1016/j.proci.2020.07.147.
- Kelesidis, G. A., E. Goudeli, and S. E. Pratsinis. 2017a. Flame synthesis of functional nanostructured materials and devices: Surface growth and aggregation. Proc. Combust. Inst 36 (1):29–50. doi:10.1016/j.proci.2016.08.078.
- Kelesidis, G. A., E. Goudeli, and S. E. Pratsinis. 2017b. Morphology and mobility diameter of carbonaceous aerosols during agglomeration and surface growth. Carbon 121:527–35. doi:10.1016/j.carbon.2017.06.004.
- Kelesidis, G. A., M. R. Kholghy, J. Zuercher, J. Robertz, M. Allemann, A. Duric, and S. E. Pratsinis. 2020. Light scattering from nanoparticle agglomerates. Powder Technol. 365:52–9. doi:10.1016/j.powtec.2019.02.003.
- Kelesidis, G. A., and S. E. Pratsinis. 2019. Estimating the internal and surface oxidation of soot agglomerates. Combust. Flame 209:493–9. doi:10.1016/j.combustflame.2019.08.001.
- Kelesidis, G. A., and S. E. Pratsinis. 2021. Determination of the volume fraction of soot accounting for its composition and morphology. Proc. Combust. Inst 38 (1):1189–96. doi:10.1016/j.proci.2020.07.055.
- Kholghy, M. R., and V. G. DeRosa. 2021. Morphology, composition and optical properties of jet engine-like soot made by a spray flame. Combust. Flame 231:111480. doi:10.1016/j.combustflame.2021.111480.
- Klingshirn, C. D., Z. J. West, M. J. DeWitt, A. Higgins, J. Graham, and E. Corporan. 2019. Quantification of elemental and total carbon in combustion particulate matter using thermal-oxidative analysis. J. Air Waste Manag. Assoc. 69 (8):1003–13. doi:10.1080/10962247.2019.1630025.
- Koudis, G. S., S. J. Hu, A. Majumdar, R. Jones, and M. Stettler. 2017. Airport emissions reductions from reduced thrust takeoff operations. Transp. Res. Part D Transp. Environ 52:15–28. doi:10.1016/j.trd.2017.02.004.
- Liati, A., B. T. Brem, L. Durdina, M. Vögtli, Y. Dasilva, P. D. Eggenschwiler, and J. Wang. 2014. Electron microscopic study of soot particulate matter emissions from aircraft turbine engines. Environ. Sci. Technol. 48 (18):10975–83. doi:10.1021/es501809b.
- Lobo, P., L. Durdina, G. J. Smallwood, T. Rindlisbacher, F. Siegerist, E. A. Black, Z. Yu, A. A. Mensah, D. E. Hagen, R. C. Miake-Lye, et al. 2015. Measurement of aircraft engine non-volatile PM emissions: Results of the Aviation-Particle Regulatory Instrumentation Demonstration Experiment (A-PRIDE) 4 campaign. Aerosol Sci. Technol 49 (7):472–84. doi:10.1080/02786826.2015.1047012.
- Lohmann, U., F. Friebel, Z. A. Kanji, F. Mahrt, A. A. Mensah, and D. Neubauer. 2020. Future warming exacerbated by aged-soot effect on cloud formation. Nat. Geosci. 13 (10):674–80. doi:10.1038/s41561-020-0631-0.
- Mader, B. T., R. C. Flagan, and J. H. Seinfeld. 2001. Sampling atmospheric carbonaceous aerosols using a particle trap impactor/denuder sampler. Environ. Sci. Technol. 35 (24):4857–67. doi:10.1021/es011059o.
- Mädler, L., H. K. Kammler, R. Mueller, and S. E. Pratsinis. 2002. Controlled synthesis of nanostructured particles by flame spray pyrolysis. J. Aerosol Sci 33 (2):369–89. doi:10.1016/S0021-8502(01)00159-8.
- Marcolli, C., F. Mahrt, and B. Kärcher. 2021. Soot PCF: Pore condensation and freezing framework for soot aggregates. Atmos. Chem. Phys. 21 (10):7791–843. doi:10.5194/acp-21-7791-2021.
- Marhaba, I., D. Ferry, C. Laffon, T. Z. Regier, F. Ouf, and P. Parent. 2019. Aircraft and MiniCAST soot at the nanoscale. Combust. Flame 204:278–89. doi:10.1016/j.combustflame.2019.03.018.
- Maricq, M. M. 2014. Examining the relationship between black carbon and soot in flames and engine exhaust. Aerosol Sci. Technol 48 (6):620–9. doi:10.1080/02786826.2014.904961.
- Maricq, M. M., S. J. Harris, and J. J. Szente. 2003. Soot size distributions in rich premixed ethylene flames. Combust. Flame 132 (3):328–42. doi:10.1016/S0010-2180(02)00502-3.
- Meier, U., J. Heinze, S. Freitag, and C. Hassa. 2011. Spray and flame structure of a generic injector at aeroengine conditions. Proc. ASME Turbo Expo 3:61–72. doi:10.1115/GT2011-45282.
- Moore, R. H., L. D. Ziemba, D. Dutcher, A. J. Beyersdorf, K. Chan, S. Crumeyrolle, T. M. Raymond, K. L. Thornhill, E. L. Winstead, and B. E. Anderson. 2014. Mapping the operation of the miniature combustion aerosol standard (Mini-CAST) soot generator. Aerosol Sci. Technol 48 (5):467–79. doi:10.1080/02786826.2014.890694.
- Mueller, M. E., and H. Pitsch. 2013. Large eddy simulation of soot evolution in an aircraft combustor. Phys. Fluids 25 (11):110812. doi:10.1063/1.4819347.
- Olfert, J. S., M. Dickau, A. Momenimovahed, M. Saffaripour, K. Thomson, G. Smallwood, M. Stettler, A. Boies, Y. Sevcenco, A. Crayford, et al. 2017. Effective density and volatility of particles sampled from a helicopter gas turbine engine. Aerosol Sci. Technol 51 (6):704–14. doi:10.1080/02786826.2017.1292346.
- Olfert, J., and S. Rogak. 2019. Universal relations between soot effective density and primary particle size for common combustion sources. Aerosol Sci. Technol 53 (5):485–92. doi:10.1080/02786826.2019.1577949.
- Ouf, F.-X., S. Bourrous, C. Vallières, J. Yon, and L. Lintis. 2019. Specific surface area of combustion emitted particles: Impact of primary particle diameter and organic content. J. Aerosol Sci 137:105436. doi:10.1016/j.jaerosci.2019.105436.
- Rissler, J., M. E. Messing, A. I. Malik, P. T. Nilsson, Z. Erik, M. Bohgard, M. Sanati, J. H. Pagels, J. Rissler, M. E. Messing, et al. 2013. Effective density characterization of soot agglomerates from various sources and comparison to aggregation theory effective density characterization of soot agglomerates from various sources and comparison to aggregation theory. Aerosol Sci. Technol. 47 (7):792–805. doi:10.1080/02786826.2013.791381.
- Rogak, S. N., R. C. Flagan, and H. V. Nguyen. 1993. The mobility and structure of aerosol agglomerates. Aerosol Sci. Technol 18 (1):25–47. doi:10.1080/02786829308959582.
- Saffaripour, M., L. L. Tay, K. A. Thomson, G. J. Smallwood, B. T. Brem, L. Durdina, and M. Johnson. 2017. Raman spectroscopy and TEM characterization of solid particulate matter emitted from soot generators and aircraft turbine engines. Aerosol Sci. Technol 51 (4):518–31. doi:10.1080/02786826.2016.1274368.
- Saffaripour, M., P. Zabeti, M. Kholghy, and M. J. Thomson. 2011. An experimental comparison of the sooting behavior of synthetic jet fuels. Energy Fuels 25 (12):5584–93. doi:10.1021/ef201219v.
- Saggese, C., A. V. Singh, X. Xue, C. Chu, M. R. Kholghy, T. Zhang, J. Camacho, J. Giaccai, J. H. Miller, M. J. Thomson, et al. 2019. The distillation curve and sooting propensity of a typical jet fuel. Fuel 235:350–62. doi:10.1016/j.fuel.2018.07.099.
- Schauer, J. J., B. T. Mader, J. T. Deminter, G. Heidemann, M. S. Bae, J. H. Seinfeld, R. C. Flagan, R. A. Cary, D. Smith, B. J. Huebert, et al. 2003. ACE-Asia intercomparison of a thermal-optical method for the determination of particle-phase organic and elemental carbon. Environ. Sci. Technol. 37 (5):993–1001. doi:10.1021/es020622f.
- Schmid, O., and T. Stoeger. 2016. Surface area is the biologically most effective dose metric for acute nanoparticle toxicity in the lung. J. Aerosol Sci. 99:133–43. doi:10.1016/j.jaerosci.2015.12.006.
- Schneider, C. A., W. S. Rasband, and K. W. Eliceiri. 2012. NIH Image to ImageJ: 25 years of image analysis. Nat. Methods. 9 (7):671–5. doi:10.1038/nmeth.2089.
- Sorensen, C. M. 2011. The mobility of fractal aggregates: A review. Aerosol Sci. Technol. 45:755–69. doi:10.1080/02786826.2011.560909.
- Strobel, R., F. Krumeich, W. J. Stark, S. E. Pratsinis, and A. Baiker. 2004. Flame spray synthesis of Pd/Al2O3 catalysts and their behavior in enantioselective hydrogenation. J. Catal 222 (2):307–14. doi:10.1016/j.jcat.2003.10.012.
- Tajima, N., H. Sakurai, N. Fukushima, and K. Ehara. 2013. Design considerations and performance evaluation of a compact aerosol particle mass analyzer. Aerosol Sci. Technol. 47 (10):1152–62. doi:10.1080/02786826.2013.827323.
- Teleki, A., B. Buesser, M. C. Heine, F. Krumeich, M. K. Akhtar, and S. E. Pratsinis. 2009. Role of gas - aerosol mixing during in situ coating of flame-made titania particles. Ind. Eng. Chem. Res. 48 (1):85–92. doi:10.1021/ie800226d.
- Teleki, A., M. C. Heine, F. Krumeich, M. K. Akhtar, and S. E. Pratsinis. 2008. In situ coating of flame-made TiO2 particles with nanothin SiO2 films. Langmuir 24 (21):12553–8. doi:10.1021/la801630z.
- Tsantilis, S., H. K. Kammler, and S. E. Pratsinis. 2002. Population balance modeling of flame synthesis of Titania nanoparticles. Chem. Eng. Sci. 57 (12):2139–56. doi:10.1016/S0009-2509(02)00107-0.
- Waser, O., A. J. Groehn, M. L. Eggersdorfer, and S. E. Pratsinis. 2014. Air entrainment during flame aerosol synthesis of nanoparticles. Aerosol Sci. Technol. 48 (11):1195–206. doi:10.1080/02786826.2014.969800.
- Westerdahl, D., S. A. Fruin, P. L. Fine, and C. Sioutas. 2008. The Los Angeles International Airport as a source of ultrafine particles and other pollutants to nearby communities. Atmos. Environ. 42 (13):3143–55. doi:10.1016/j.atmosenv.2007.09.006.
- Wiedensohler, A. 1988. An approximation of the bipolar charge distribution for particles in the submicron size range. J. Aerosol Sci. 19 (3):387–9. doi:10.1002/bit.260310104.
- Zhang, R., A. F. Khalizov, J. Pagels, D. Zhang, H. Xue, and P. H. McMurry. 2008. Variability in morphology, hygroscopicity, and optical properties of soot aerosols during atmospheric processing. Proc. Natl. Acad. Sci. USA. 105 (30):10291–6. doi:10.1073/pnas.0804860105.