
 ?Mathematical formulae have been encoded as MathML and are displayed in this HTML version using MathJax in order to improve their display. Uncheck the box to turn MathJax off. This feature requires Javascript. Click on a formula to zoom.
Abstract
The principal objective of this article is to calculate rate of below-cloud scavenging of dust by rain along the Libyan coastline during an extraordinary dust storm that occurred early in March, 2004. A numerical investigation of wet deposition of four dust particles including clay, small silt, large silt and sand was performed using a regional meteorological model (Eta) coupled with the module describing desert dust cycle. For correct estimation of below-cloud wet deposition, explicit information about cloud and precipitation water at all model levels was used. An amount of 1764 mgr/m2, which was simulated at El Khoms, Ajdabia and Benina stations, was the maximum calculated rate of clay in the study area. An amount estimated at 7848 mgr/m2 of small silt particles and 3058 mgr/m2 of large silt particles were found in Masrata region. Compared to other sediment types, deposited silts were found to be much bigger across the affected regions during the studied event, with small silt quantities being the highest. The sand component seems to be the least deposited aerosol through the entire studied region. The highest quantity of 1187 mgr/m2 of sand materials was simulated in Zawara and Azzawia regions. The obtained results show that Libyan coastal areas have considerable dust wet deposition during the study period; however, the concentration rates are highly variable in space.
Copyright © 2022 American Association for Aerosol Research
EDITOR:
1. Introduction
Occurrence of the North African Sahara dust storms and their intensities are increasing (Middleton Citation2019; Engelstaedter, Tegen, and Washington Citation2006). Several hundred millions of tons of eolian Saharan dust are transported away from their source regions yearly (Koren et al. Citation2006; Callot, Marticorena, and Bergametti Citation2000) due to a combination of strong winds and loose dry soil surfaces in arid and semiarid areas (Shao Citation2008). Once injected into the atmosphere, desert dust particles may travel over long distances under favorable meteorological conditions before they deposit on the land or on the sea surfaces (Kallos et al. Citation2007) through two deposition mechanisms (wet or dry), which are the ways of examining air atmospheric pollution (Wu et al. Citation2018). Numerous elements affect the deposition fluxes such us geographical location and properties of sediment particles (Figgis et al. Citation2018; Knippertz and Fink Citation2006).
Wet deposition is the mass flux process of atmospheric dust particles that are collected or scavenged by hydrometer and then carried back to the earth surface by both inside-cloud and below-cloud precipitation (Zhang, Zhou, and Yang Citation2019; Gong, Stroud, and Zhang Citation2011). This mechanism is one of the most important sink processes of dust aerosol particles. Wet atmospheric deposition fluxes, among other deposition mechanisms, have become an increasing concern among governments and international airborne dust communities (Wu et al. Citation2018; Lao et al. Citation2018; O’Hara, Clarke, and Elatrash Citation2006), due to their various detrimental effects on human health, air quality and many other socio-economic sectors. For example, desert dust deposition contributes significantly to the ecosystems through biogeochemical cycle that may change microphysical properties and promote surface chemical as well damage caused to infrastructure and transport (Middleton Citation2019; Zhang et al. Citation2016).
Precipitation, among other factors, plays a critical role in the removal of atmospheric particulate matter via wet deposition mechanism (Gong, Stroud, and Zhang Citation2011). This below cloud scavenging or washout refers to the event where aerosols below clouds are collected with either rain droplets or snow crystals (Moore et al. Citation2020; Tsarpalis et al. Citation2018). Hence, this scavenged mechanism depends on atmospheric aerosol diameters and raindrop size distributions (Zhang, Zhou, and Yang Citation2019; Pierce et al. Citation2015; Mahowald et al. Citation2014). Wet dust removal can be detected only in the presence of precipitation (Zhang, Zhou, and Yang Citation2019; Moore et al. Citation2020), as it is required to moderate particular dust sources (O’Hara, Clarke, and Elatrash Citation2006; Şen and Eljadid Citation1999; Eddenjal Citation2015). Precipitation scavenging mainly becomes huge in spring months, which are characterized by a high frequency of desert dust and sand storms in large parts of northern Africa. These storms are associated with strong synoptic scale disturbances produced by Saharan cyclonic storms (such as Atlas lee depressions) that are accompanied with well-defined cold fronts (Knippertz and Fink Citation2006; Knippertz and Stuut Citation2014; Eddenjal Citation2015; Liu et al. Citation2004; Shao, Fink, and Klose Citation2010).
Libya is located on the path of desert sand and dust storms, especially during spring months (O’Hara, Clarke, and Elatrash Citation2006; Eddenjal Citation2015; Elatrash Citation2004). Dust plumes are transported by strong winds to the north and northeast (Kubilay et al. Citation2000). It is noteworthy to indicate that intense winds are often associated with cold fronts pushing across the Mediterranean region (Knippertz and Fink Citation2006). Eddenjal (Citation2015) and Elatrash (Citation2004) suggest that local emissions in the coastal regions of Libya represent one of the most intense dust emission areas of the Sahara. Moreover, numerous papers (e.g., O’Hara, Clarke, and Elatrash Citation2006; Elatrash Citation2004; Adelsberger and Smith Citation2009) have documented the annual dust deposition rate in North Africa. Also, O’Hara, Clarke, and Elatrash (Citation2006) suggested that Libya has the highest dust aerosols deposition rate which represents one-third to one-half of total Saharan dust that deposit during the first 2000 km downwind of its source regions. They assessed the annual cycle of dust deposition in Libya and found that the deposition values range between 38.6 and 311.0 gm−2year−1, with an average of 129.1 gm−2year−1. Furthermore, they suggested that Libya acts not only as a major dust producing region but also as an atmospheric dust sink.
Saharan dust storm in the North Africa during the early March of 2004 was extremely investigated and analyzed by the international dust community, including researchers and historians, mainly due to its widespread, severity and impacts imposed on different sectors (e.g., Knippertz and Fink Citation2006; Douaiba et al. Citation2014; Shao, Fink, and Klose Citation2010; Gläser, Knippertz, and Heinold Citation2012). Cyclones that are accompanied by frontal systems usually produce cloudy and heavy rainy weather (Shao Citation2008; Knippertz and Fink Citation2006). According to this enhanced instability, Libyan areas were cooled by evaporation of frontal rainfall during the studied dust episode (O’Hara, Clarke, and Elatrash Citation2006). As such, a significant amount of wet dust deposition above the Libyan coastline was expected. However, to our knowledge, no scientific work has been published that provides a systematic study and quantification of wet aerosols deposition over Libya. To this end, for calculating blow-cloud dust deposition processes along the coastal regions of Libya, the Saharan dust episode in the period of 3–5 March 2004 is analyzed and their major characteristics are discussed. The context of this work is mainly based on the study of the synoptic and dynamic conditions of this dust episode; its spatial and temporal variability, and estimating the rates at which dust particles are removed by the observed rainfall amounts.
Modeling the atmospheric dust cycle is one of the approaches, which can provide a better tool to calculate wet dust deposition. Moreover, the usage of precipitation scavenging models at the regional scale contributes to better understanding of the causes contributing to wet deposition. Several studies worldwide have been performed in this context (e.g., Tegen Citation2003; Cassola, Ferrari, and Mazzino Citation2015). The regional Eta model coupled with the module describing the cycle of desert dust (Nickovic et al. Citation2001; Nickovic et al. Citation1998; Kallos Citation1997) is used in this study to calculate wet deposition rates throughout the period of 3–5 March 2004 along the Libyan coast. However, the process by which particles were washed out through a collection of rainfall only was considered in this work. As ground-based instrumental measurements of the wet dust deposition were not conducted during the period in question, and because the wet deposited dust is often estimated as a function of precipitation scavenging and the airborne of dust concentration (Moore et al. Citation2020; Tsarpalis et al. Citation2018), the washout process was considered when rainfall amount was larger than 1 mm during the sampling period under the static conditions, such as cloud water amount (Kallos Citation1997; Desboeufs et al. Citation2018).
This article aims to estimate the removal of dust particles, including clay, small silt, large silt, and sand from the atmosphere by precipitation along the Libyan coastline. Furthermore, knowledge of the evolution and characteristics of wet deposition of dust particles and their relation to meteorological conditions (wind velocity, clouds and accumulation precipitation) is very important to understand the impaction of contribution of Libya soil to desert dust cycle.
2. Study area
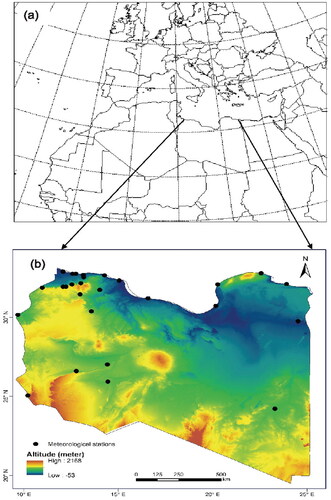
Libya, most of which is a sandy desert, comprises a geographical area estimated at roughly 1.760 million square Km with 90.5% of the region is classified as extremely arid, 7.5% arid and 1.5% is semi-arid (Ben-Mahmoud Citation1995). Study area, Libyan coast, is located in the southern border of the Mediterranean Sea; with a coastline approximately 1900 Km long extending from Tunisia in the west to the Egypt in the east (see ). It encompasses the saline Jefara plain, scattered with sand dunes, extends along the Mediterranean shoreline from the western Libya–Tunisia border to El Khoms city, and is bounded from the south by Jabal Nafousa Mountains. In the eastern part of the area of study, on the other hand, Al Jabal Al Akhdar Mountain (east of Benghazi), which is located in the eastern coast, and a great mass of sand, which lies parallel to the Mediterranean coast, form the main features of the region. The Great Sand Sea occupies most of the northeastern part of the Libyan Desert, and extends south to the west of Kufra region (Ogilbee and Tarhuni Citation1962; El-Takhtiet Citation1978). From Sirt to Benghazi, the Gulf of Sidra, which is mostly desert, is dominated by scattered lagoons, sabkha, and coastal saltmarsh.
Figure 1. (a) Geographical domain used for the simulation of Saharan dust wet deposition by precipitation, the model domain has a horizontal Arakawa E grid, ranges from 24.2° W to 51.8° E and between 12.9° to 53.4° N, (b) employed weather stations are marked by black dots.
3. Materials and methods
Different meteorological data and products came from diverse official sources are used in this effort to study the below cloud scavenging phenomenon (). These data include: Instrumental and visual meteorological observations obtained from the land SYNOP messages (3-hourly surface synoptic observations), which were gathered from the Libyan National Meteorological Center (LNMC) as well as 24 hourly reanalysis data that were obtained from the European Center for Medium-Range Weather Forecasts (ECMWF) ERA5 reanalysis Archives. Moreover, daily data from 27 synoptic weather stations, situated in Libya have been collected (see and ). These stations have been identified based on their geographical locations, where the passage of cold air mass reaching from Northern Europe toward Libya, resulted the responsible synoptic weather systems that are favorable to wet deposition mechanism. In order to monitor the evolution of the dust front as well as cloud bands, satellite images were exploited during the study period.
Table 1. Characteristics of the four dust particles (adapted from Jung and Shao Citation2006).
Table 2. Metadata of synoptic and climatic stations in Libya whose weather reports were used in this study.
As a driving tool for airborne wet dust deposition calculations, the regional Eta model coupled with the module describing the desert dust cycle was used (Kallos Citation1997; Desboeufs et al. Citation2018). shows the domain of the Eta model. The coarse version of this model has a horizontal Arakawa E grid (Nickovic et al. Citation1998) and increments of 0.24∘ resolution, while the geographical extension of the model domain ranges from 24.2° W to 51.8° E and between 12.9° to 53.4°N (Nickovic et al. Citation2001; Kallos and Katsafados Citation2008). The model has two essential parts: The atmospheric modeling system and the dust concentration module described by a set of independent Euler type. However, the dust module integrates all the essential phases of the life cycle of atmospheric desert dust, such as dust emission, diffusion, advection, and removal processes. It should be noted that the schemes process of dust cycle, such as dust emission and dry deposition are detailed in (Nickovic et al. Citation2001, Kallos Citation1997, Desboeufs et al. Citation2018, Shao et al. Citation2011) and not repeated here.
Four particle size schemes were implemented (see ) to simulate more precisely the size dependent processes, such as wet deposition estimations. The wet removal process of Sahara dust particles was calculated sequentially from a model column top (=1) to surface down (
denotes lowest model) using the model precipitation water. For each model box, the rate of dust scavenged by precipitation is computed via:
(1)
(1)
Where
denotes the rate of dust concentration (mgr.m−2) removed by precipitation, and
is the model precipitation rate, and
(fixed to 5 × 10⁵) is the washout parameter value.
The deposition on the surface is calculated by:
(2)
(2)
Where
is the depth of the lowest model layer.
In this model, scavenging is defined as the removal of dust from the grid cell. However, wet dust scavenging due to precipitation is calculated separately for a grid scale and convective precipitation. Wet dust deposition scheme is embedded in the model in order to calculate the dust scavenging rate by precipitation through both inside and below cloud mechanisms, when the raindrop size is larger than 1 mm (Tsarpalis et al. Citation2018; Desboeufs et al. Citation2018; Jung and Shao Citation2006; Brandt, Christensen, and Frohn Citation2002). However, in-cloud scavenging process is outside the scope of this study. The standard cloud and precipitation schemes of this model are the grid-scale cloud microphysical scheme (Ferrier et al. Citation2002) and the convective adjustment scheme of BMJ (Betts-Miller-Janjic) (Kallos Citation1997; Janjic Citation1994).
3.1. Grid scale precipitation and cloud physics
In this study, the precipitation scheme is computed as described in refs (Nickovic et al. Citation1998; García et al. Citation2011; Ferrier et al. Citation2002). Moreover, basic microphysics processes are involved in order to keep the computational efficiency of the scheme reasonable. The microphysical processes incorporated in the precipitation scheme are described by:
(3)
(3)
Where
is the liquid phase wet deposition flux of dust bin
at level
is the liquid phase wet deposition flux of dust arriving at level
from above (i.e., from level
).
is the input flux of scavenged dust at level
is the fraction of precipitation flux lost into the air column due to evaporation of precipitation, and
(fixed to 0.5) is a tuning factor to account for the fact that not all of the rain droplets may evaporate. According to Slinn (Citation1984), below cloud scavenging for rain
is computed by:
(4)
(4)
Where
= 3/2,
is the liquid precipitation rate,
is the capture efficiency of water droplets,
is the diameter of raindrop and
is the airborne dust diameter.
is the dust mass loading for bin
in the grid cell. The efficiency of the wet deposition depends on many factors, such as particle and raindrop size distributions and their chemical properties (Wu et al. Citation2018; Moore et al. Citation2020; Tsarpalis et al. Citation2018). According to Slinn (Citation1984), model scavenging efficiencies of water droplets integrate interception
inertial impaction
and Brownian diffusion
as well as parameters that characterize the behavior of suspended dust particles in a fluid flow, and that are deposited to the ground, such as the Reynolds, Schmidt and Stokes numbers.
(5)
(5)
(6)
(6)
(7)
(7)
(8)
(8)
Where, the Reynolds number of raindrops
is calculated as:
(9)
(9)
The Stokes parameter of the collected particles
and the critical Strokes number
are expressed as:
(10)
(10)
(11)
(11)
Where, the characteristic relaxation time of the particle
is determined by
(12)
(12)
The Schmidt number for collected particle is given by
(13)
(13)
The Brownian diffusivity is:
(14)
(14)
Where, the term
defines the Cunningham slip factor
(15)
(15)
Where
and
are the viscosities of air and water respectively,
and
are the densities of air and particle respectively,
is the Boltzmann constant,
is the absolute temperature, and
and
are terminal velocities of raindrops and dust particles respectively (Desboeufs et al. Citation2018; García et al. Citation2011). Assuming that the wet deposition was considered only when a raindrop diameter
is larger than 1 mm, the terminal velocity of raindrops is estimated by:
(16)
(16)
3.2. Convective precipitation
The BMJ scheme of convective precipitation (Betts Citation1986; Janjic Citation1994) applies deep convective cloud that uses vertical profiles of temperature and humidity as a reference. Consequently, the convective processes adjust the vertical humidity and aerosols concentration profiles (Shao Citation2008; Jung and Shao Citation2006). However, the shallow convective is expressed according to transformation of moisture and heat by using the second law of thermodynamics. The changes of specific humidity and temperature within a convection time setup are expressed by q and
T, which can be calculated as:
(17)
(17)
(18)
(18)
As Janjic (Citation1994) suggested, is the cloud efficiency that is in line with the time setup of cloud temperature and precipitation, where the superscripts
indicate the initial values of specific humidity and temperature, while the subscripts
signify reference values of the same thermodynamic factors.
In accordance with the scheme of BMJ and García et al. (Citation2011) suggestion, the wet deposition of desert dust particles is vertically mixed alike to scavenging by convective precipitation type. Therefore, there was proportionality between removing dust aerosols and deep convective cloud. During the convection time step the change of dust concentration
is estimated by:
(19)
(19)
is the initial dust concentration, and
is the condition of the total mass loading of the dust reference profile.
4. Results and discussion
In order to understand the evolution of wet removal of Saharan mineral dust, which is produced by below-cloud precipitation, an unusual desert dust storm, which affected North African coastline during the early March 2004, associated with widespread dust emissions and extreme dust wet deposition was investigated. Synoptic background for this large-scale dust event was also described. This included the analysis of sea level pressure and upper air patterns, air temperatures, wind fields, clouds, precipitation and visibility measurements. This dust event was associated with a penetration of a cold front that progressed toward the northern Sahara coming from Europe. Cold front system was interspersed with rain clouds, which covered Libya as a result of strong evaporation cooling (O’Hara, Clarke, and Elatrash Citation2006).
The calculation of below cloud wet deposition of four dust particles, including clay, small silt, large silt, and sand was performed using the Eta model coupled with a desert dust cycle module (https://forecast.uoa.gr/), (Nickovic et al. Citation2001; Nickovic et al. Citation1998; Kallos Citation1997). The obtained results were compared with the synoptic atmospheric conditions favorable for rising dust.
4.1. Evolution of the main synoptic weather features and climatology development
Frontal surface depressions associated with upper-air troughs that transfer cold airflow toward the Mediterranean and North Africa regions are one of the most causes of widespread and intense Saharan dust storms. The intensification of high pressure across the subtropical Atlantic Ocean may strengthen such dust storms by contributing to windier weather conditions. Cyclogenesis occurred over the northern Sahara desert, which is associated with a frontal system and a strong Azores anticyclone across the subtropical Atlantic Ocean. This is the main characteristic that distinguishes the initial stage of the studied dust episode of early the March 2004 (see ). Moreover, as a result of the explosive of cyclogenesis over southwestern of the Iberian Peninsula (see ), a cold northerly airflow hit North Africa (Shao Citation2008; Knippertz and Fink Citation2006; Shao, Fink, and Klose Citation2010). The heading of surface cold front into the northwest Africa Sahara desert caused the enhancement of wind speed and rainfall episodes (Knippertz and Fink Citation2006).
Figure 2. ECMWF ERA5 reanalysis data of (a) geopotential heights contours in gpm of the 500 hpa isobars (grey solid lines) for 3 March 2004 at 0000 UTC, (b) isobars in hpa of the mean sea level pressure chart (grey solid lines) for 3 March 2004 at 0000 UTC, (c) isotherms in °C at 500 hpa (blue dashed lines) for 3 March 2004 at 0000 UTC, (d), (e) and (f) same as (a), (b) and (c) respectively, but for 4 March 2004 at 0000 UTC, (g), (h) and (i) same as (a), (b) and (c) respectively, but for 5 March 2004 at 0000 UTC. (Copernicus Climate Change Service (C3S) of the Global Climate Citation2017).
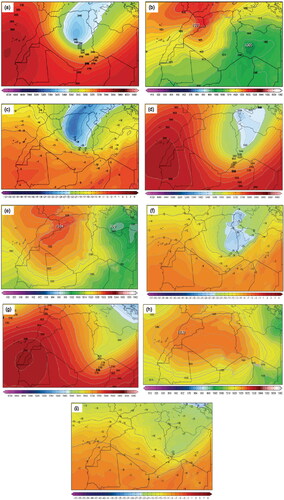
displays the reanalysis barometric pressure (mean sea level pressure) and 500 hpa charts for the period 3–5 March 2004. As can be seen, in the studied episode, the Saharan surface depression moved eastwards along the coastline of Libya, and then on 5 March to northeastward to southeastern Europe. On 3 March, a high pressure centered over central Western Europe with its ridge affecting northwestern Africa. A cyclonic area with a cold front system developed over southwestern Libya; moreover, another cold front hit southeastern Algeria. At the same time, an upper air trough brought cold air mass toward these regions, with temperatures ranged between −20 °C and −25 °C at 500 hpa over westernmost Libya (see ). It is noteworthy to indicate that during cold front movement and associated instability, vertical air movements increase turbulence, which is conducive for rising dust (Shao, Fink, and Klose Citation2010). By 0000 UTC on 3 March, a mature surface low-pressure system, which was fed by low level cold air centered over western Libya. Such a low pressure extended deep into the atmosphere and can be clearly identified at 500 hpa chart (see ).
This synoptic condition created windy, cloudy and continued wet weather, mostly during the study period across many Libya synoptic stations. lists accumulated rainfall quantities during the first five days of March 2004, their monthly (March) rainfall totals and climatology (based on data availability) for the 22 meteorological stations in Libya that experience precipitation event as well as observed maximum wind speed. As indicated, El Ghariat recorded the highest rainfall amounts of 142.5 mm followed by 107.7 mm at Masrata station during the three subsequent days (2–4 March). These rainfall amounts were almost eighty and four times the climatology of March rainfall (1981–2010) there, respectively. Furthermore, all western coastal stations recorded much above climatology of March rainfall values. In addition, the above-mentioned rainfall amount (107.7 mm) at Masrata rain gauge was about 0.9 times of the March rainfall total (113.6 mm) in 2004. Additionally, amounts of 41.2, 25.4, and 75 mm were reported at Tripoli Airport, Sorman and El Khoms stations, respectively on 3 March. From 2 to 4 March, Gharian, Rojban, Assbeaa, Mezda, Ben Walid and Ghadames stations recorded rainfall amounts of 83.6, 80.4, 55.1, 62.2, 47 and 3 mm respectively. Mezda station also reported hail event. This reported precipitation type explains cold upper air advection toward western Libya (see ). Moreover, Yefren rain gauge recorded 84 and 7 mm on 3 and 4 March respectively. Much lesser rainfall amounts were observed in the northeastern part of the country. By 5 March, rainfall was restricted to some stations of the northeastern coast and Sirt. In Tobruk, 7.4 mm was recorded, whereas 1.4 mm was observed in Sirt.
Table 3. Accumulated 1–5 March 2004 rainfall amounts, rainfall climatology based on 1981–2010 period, with exception to stations marked by✶, at which climatology was calculated for shorter periods based on data availability, March rainfall totals and the highest wind speeds recorded during the studied period at some synoptic and climatic stations in Libya.
shows the absorbing aerosol index (AI) from Probe TOMS (Total Ozone Mapping Spectrometer) which measure the relative amount of dust layers. Dust mobilization across Libya as well as total cloud cover for the period 3–5 March 2004 are also presented. A TOMS aerosols index of 0.1 indicates clear skies with a maximum visibility, while a value of 4 TOMS aerosol index displays the presences of thick dust clouds (Torres et al. Citation2002). depicts airborne dust from TOMS’s satellite images over North Africa. On 3 March 2004, high absorbing aerosols within the dust storm were detected by TOMS with maximum values of 1.9 to 2.3 at the Libyan coast. The whole Libya experienced cloudy skies with generally medium- and high-level clouds on the period of 3–5 March 2004. Thus expected of most dust plumes over these regions were hidden by such clouds. However, NASA EOSDIS-WORLDVIEW satellite imageries captured a dense dust plume extending from the eastern coast of Libya (Benghazi and surrounded regions) toward the Mediterranean Sea (see ). However, the dense, low clouds cover west Libya, while the high cloud swept the eastern regions for the same period. Nonetheless, the relative clouds position corresponding to TOMS’s aerosol index presented in . AI values reduced to 1.1 to 1.9 (see ), as dust clouds moved to the east on 4 March 2004. The current dust coincides by the low cloud over the last regions, where the high cloud dominates the east region, as mentioned in the . Moreover, as shown in , lower values of 0.7–1.1 of AI were detected over Libya on 5 March 2004. It appears that the passage of the dust plume was from North Libya to southeast Europe, as illustrated in . It is evident that this dust storm injected huge aerosol particles into southeast Europe, where the dust concentration of dust over Libya have been diminished. During this time high cloud was covered Libya coastal and east region (see ).
Figure 3. (a) Earth Probe TOMS version 8 absorbing aerosol index for 03 March 2004 [http://acd-ext.gsfc.nasa.gov], (b) cloud cover and detected dust mobilization by NASA satellite snapshots, EOSDIS-WORLDVIEW for 3 March 2004 at 1800 UTC [https://worldview.earthdata.nasa.gov], (c) simulation of total cloud cover on 3 March 2004 at 1800 UTC. Graphs (d), (e) and (f) same as (a), (b) and (c) respectively, but for 4 March 2004 at 1800 UTC. Graphs (g), (h) and (i) same as (a), (b) and (c) respectively, but for 5 March 2004 at 1800 UTC.
![Figure 3. (a) Earth Probe TOMS version 8 absorbing aerosol index for 03 March 2004 [http://acd-ext.gsfc.nasa.gov], (b) cloud cover and detected dust mobilization by NASA satellite snapshots, EOSDIS-WORLDVIEW for 3 March 2004 at 1800 UTC [https://worldview.earthdata.nasa.gov], (c) simulation of total cloud cover on 3 March 2004 at 1800 UTC. Graphs (d), (e) and (f) same as (a), (b) and (c) respectively, but for 4 March 2004 at 1800 UTC. Graphs (g), (h) and (i) same as (a), (b) and (c) respectively, but for 5 March 2004 at 1800 UTC.](/cms/asset/232a2831-9689-492f-9e1a-6d7eca0e4301/uast_a_2074289_f0003_c.jpg)
4.2. Dust load
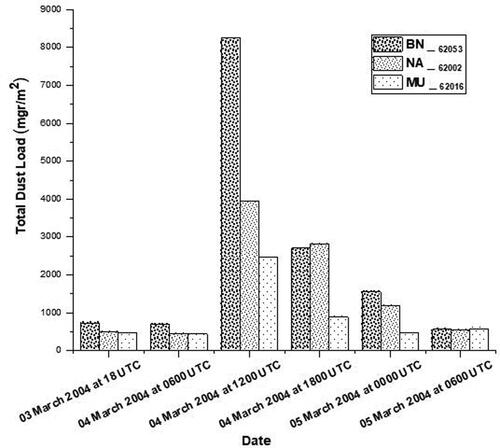
The dust cycle involves dust emission, transport and deposition (Shao et al. Citation2011). To simulate below-cloud scavenging of dust by rain, dust emissions should first be estimated. Dust emission rate, which is vertical mass flux of dust at the surface, is highly sensitive to wind velocity (Steven et al. Citation2021). shows modeling of total dust load amounts at Benina, Nalut and Masrata. Those stations were selected based on their recorded high winds (see ). The highest amounts of total dust load were 8259 mgr/m2, 3942 mgr/m2 and 2460 mgr/m2, which were calculated at Benina, Nalut and Masrata, respectively. The pick of dust load is clearly remarked at 1200 UTC 4 March 2004. During the study period, the highest total amount of rainfall (107 mm) was recorded at Masrata station, which was accompanied by the smallest quantity (2460 mgr/m2) of dust load when it is compared with the other two stations. Furthermore, the highest amount of 8259 mgr/m2 was calculated at Benina station, where only 4.4 mm of rain and maximum wind speed of 38 knots were registered. Thus, the vertical mass flux of dust can be greatly affected by both wind speed and rainfall amounts simultaneously. However, it is difficult to link those high values of dust load with the recorded rainfall amounts and wind speeds at the above-mentioned stations when every day is considered individually. This might be explained by territorial nature of rainfall in Libya and high space variability.
Figure 4. Modeling of total dust load of Benina, Nalut and Masrata (from left to right). These stations were chosen based on their recorded high winds during the studied period (see ). The maximum simulated amounts of total dust load were 8259 mgr/m2, 3942 mgr/m2 and 2460 mgr/m2, which were found at Benina, Nalut and Masrata respectively on 4 March, 1200 UTC.
4.3. Wet deposition
displays characteristics of a range of dust aerosols which are simulated in this effort. These elements include clay particles that have an average diameter of 1.46 μm, silt particles with diameters ranging from 12.2 to 36.0 μm, and sand particles which have an average diameter of 76 μm. As there were no wet dust deposition measurements in Libya during the studied period, and because the wet deposited dust is scavenged by rainfall, this study used measured and calculated rainfall quantities to calculate wet deposition values along the coastline of Libya. Recorded rainfall values at the Libyan synoptic and climatic stations (see ) were also used for comparison with the wet deposition rates of dust from the model simulation.
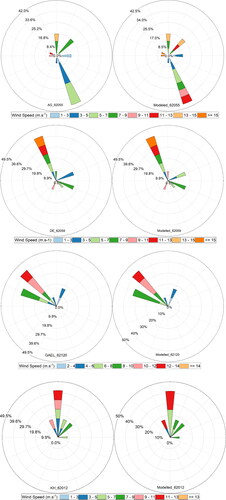
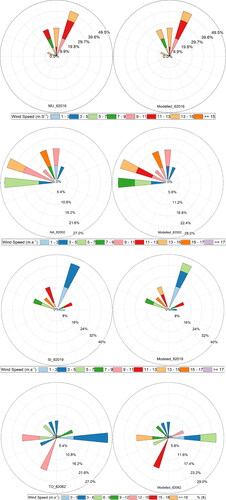
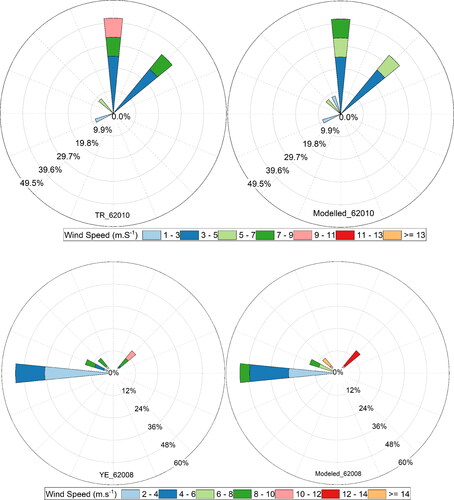
shows the created wind roses by the observed values of wind directions and speeds and that was calculated by the Eta model with 6-hourtime intervals for the period extends between 06 UTC 1 March till 18 UTC 5 March 2004 of the 10 deployed Libya meteorological stations. All plots display 16 cardinal directions. The length of each spoke is proportional to the fractional frequency of the first 5 days of March (hourly average data). It can be seen from the figure that the simulated winds are, to some extent, close to the observations. This finding can identify that the model has a capability to produce wind regime during the studied period and that such well captured of wind observations can help justify the Eta model results.
Figure 5. Wind roses use 16 cardinal directions of observed wind frequency distributions against modeled wind frequency of 6-hour time intervals for 0600 UTC 1 March till 1800 UTC 5 March 2004 of the 10 deployed Libyan stations, the stations are Ajdabia (62055), Sirt (62019), Tripoli Airport (62010), Masrata (62016), El Khoms (62012), EL Ghariat (62120), Yefren (62008), Tobruk (62062), Derna (62059), Nalut (62002).
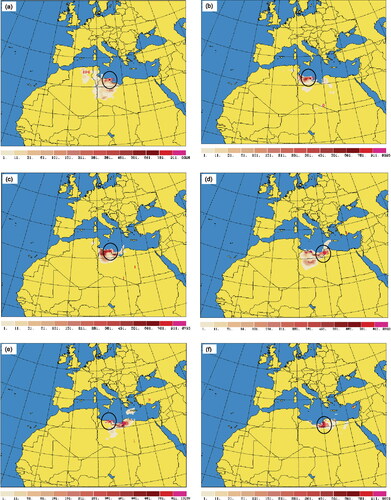
illustrates 6-hour wet dust deposition (mgr/m2) of clay particles for the period of 1800 UTC 3 March till 0600 UTC 5 March 2004. On 3 March, scavenging amount of clay particles via rainfall at the northwestern coast of Libya was about 784 mgr/m2 (Highlighted by a black circle in the figure). The quantities of deposited clay further increased in the following periods 1800 UTC 3 March till 0600 UTC 4 March and 0600-1200 UTC 4 March reaching about 1268 mgr/m2 in the same region. The weather associated with these deposition rates, as discussed above, was characterized by strong near surface winds, southwesterly upper-air flow and high rainfall amounts in the northwestern part of the studied region (see ). The simulated clay aerosols was restricted mainly at the eastern coast during the period from 1200 UTC 4 March till the end of the study period due to the eastward propagation of the cyclonic system and associated front as well as upper air trough (see ). The calculated values of clay through the 6-hour increments during the period from 1200 UTC 4 March to 0600 UTC 5 March were 1764, 1322, and 1471 mgr/m2 respectively. The 1764 mgr/m2 amount, which was simulated at El Khoms, Ajdabia and Benina stations was the maximum calculated rate of clay in the study area.
Figure 6. 6-hour wet dust deposition (mgr/m2) of clay particles. Black circles denote the maximum quantity of deposited clay, (a) 784.2 mgr/m2 on 3 March 2004 at 1800 UTC, (b) 1267 mgr/m2 on 4 March 2004 at 0600 UTC, (c) 1268 mgr/m2 on 4 March 2004 at 1200 UTC, (d) 1764 mgr/m2 on 4 March 2004 at 1800 UTC, (e) 1322 mgr/m2 on 5 March 2004 at 0000 UTC, (f) 1471 mgr/m2 on 5 March 2004 at 0600 UTC.
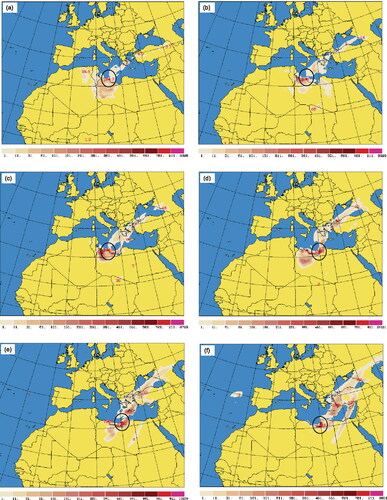
It should be noted that the Sahara dust particles are usually dry when first emitted into the atmosphere (Douaiba et al. Citation2014). Moreover, clay particles have low settling velocities and can be more effectively transported into higher altitudes due to turbulence when they are compared with coarse particles such as sand and large silt particles. However, when the moisture content of dust cloud increases, they become more effective at scavenging (Tsarpalis et al. Citation2018; Kallos and Katsafados Citation2008). The distance traveled by dust particles depends upon many factors, including wind speed and turbulence, dust grain characteristics and their settling velocities. The latter determined by the mass and shape of each aerosol particle (Kallos et al. Citation2007). These factors are controlled by the synoptic conditions that generate the wet deposition process. Based on , deposited clay particles were also simulated in Greece, Turkey and even the black sea. Southwesterly upper-air flow might be responsible for the transportation of such Saharan clay aerosols to these regions.
displays 6-hour wet Saharan dust deposition (mgr/m2) of small silt particles for the same period as in . The simulated small silt deposition quantity across Masrata and El Khoms areas was 3149 mgr/m2 in the period 1200–1800 UTC on 3 March. The simulated values further increased and extended along the entire northwestern regions during the following 6-hour intervals with a maximum of 7848 mgr/m2 at Masrata. High small silt deposited amounts were also calculated over Ajdabia and Benina during the periods 1200–1800 UTC 4 March and 1800 UTC 4 March until 0000 UTC 5 March. The deposited small silt quantities were restricted to eastern coast in the 6-hour increment ended at 0600 UTC 5 March with a value of 5840 mgr/m2. According to Elatrash (Citation2004), soil in Libya is rich in salt particles. This characteristic may explains the high quantities of small silt particle scavenged from the atmosphere. The highest quantity of wet dust deposition during the entire studied period was dominated by small silt, and it was recorded in Masrata region.
Figure 7. 6-hour wet dust deposition (mgr/m2) of small silt particles, black circles denote the maximum quantity of wet dust deposition, (a) 3149 mgr/m2 on 3 March 2004 at 1800 UTC, (b) 5057 mgr/m2 on 4 March 2004 at 0600 UTC, (c) 5420 mgr/m2 on 4 March 2004 at 1200 UTC, (d) 6850 mgr/m2 on 4 March 2004 at 1800 UTC, (e) 7848 mgr/m2 on 5 March 2004 at 0000 UTC, (f) 5840 mgr/m2 on 5 March 2004 at 0600 UTC.
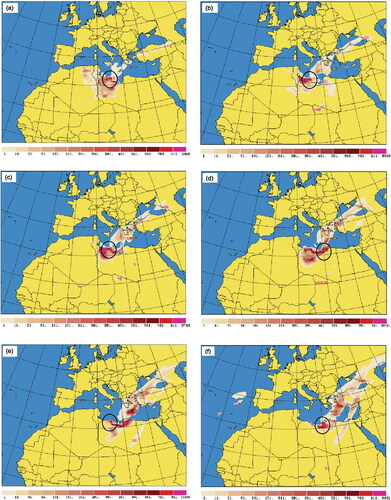
describes 6-hour wet deposition (mgr/m2) of large silt particles for the same period as and . During the first 6-hour increments ending at 1200 UTC 4 March, 1985 to 2201 mgr/m2 amounts were calculated in the northwestern of Libya, especially in Masrata region. The values of deposited large silt further increased to reach its maximum of 3058 mgr/m2 in Masrata areas in the period 1800 UTC 4 March until 0000 UTC 5 March. High values were also deposited in Ajdabia and Benina regions in the 18 h period ending at 0600 UTC 5 March with deposited values ranging between 2105 and 3045 mgr/m2. Lesser to zero values were calculated at the rest of the Libyan coast. It is noteworthy that small and large silts were simulated in Masrata region almost through the entire studied period and with their deposited maxima in the same area.
Figure 8. 6-hour wet dust deposition (mgr/m2) of large silt particles, black circles denote the maximum amount of wet dust deposition, (a) 1985 mgr/m2 on 3 March 2004 at 1800 UTC, (b) 2079 mgr/m2 on 4 March 2004 at 0600 UTC, (c) 2201 mgr/m2 on 4 March 2004 at 1200 UTC, (d) 3045 mgr/m2 on 4 March 2004 at 1800 UTC, (e) 3058 mgr/m2 on 5 March 2004 at 0000 UTC, (f) 2105 mgr/m2 on 5 at March 2004 at 0600 UTC.
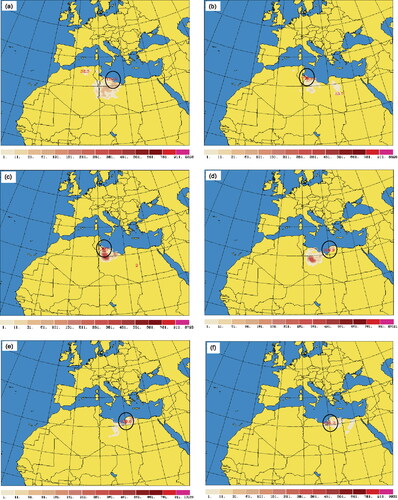
depicts wet Saharan dust depositions (mgr/m2) of sand particles that were recorded in 6-hour increments during the same period as in . As can be seen from the figure, higher values of sand particles of 776.4 and 1187 mgr/m2 were simulated in Zawara and Zawia regions during the periods 0000–0600 UTC and 0600–1200 UTC respectively on 4 March. Lesser values were also recorded in Sorman and mountainous regions (Jabal Nafousa). Moreover, simulated wet sand deposition reaching about 300 mgr/m2 was restricted almost over northeastern coast in the period of 12 h ending at 0600 UTC on 5 March. As the soil in most of the Jafara Plain is largely sandy (Ogilbee, Vorbis, and Russo Citation1962), higher amounts of sand particles were calculated in the regions from Zawara to Zawia.
Figure 9. 6-hour wet dust deposition (mgr/m2) of sand particles, black circles denote the maximum amount of wet dust deposition, (a) 126.9 mgr/m2 on 3 March 2004 at 1800 UTC, (b) 776.4 mgr/m2 on 4 March 2004 at 0600 UTC, (c) 1187 mgr/m2 on 4 March 2004 at 1200 UTC, (d) 302.9 mgr/m2 on 4 March 2004 at 1800 UTC, (e) 309.6 mgr/m2 on 5 March 2004 at 0000 UTC, and (f) 214.2 mgr/m2 on 5 March 2004 at 0600 UTC.
5. Conclusions
Based on SYNOP reports, surface and upper air analysis synoptic charts and satellite imageries, the synoptic situation of a massive dust outbreak over the western and northern Africa Sahara desert in early March 2004 was investigated. It was characterized by the influence of a combination of a low pressure area in central and southern Libya and a ridge of Azores high extending from the Atlantic Ocean to western Africa gradually covering the entire Libya. Strong isobaric gradient and frontal cyclonic conditions contributed to continued wet, windy and cloudy conditions over most of western and northern Libya. Sky obscured, suspended dust, and rising sand as well as dust storms were experienced at numerous stations. Moreover, this extreme episode resulted in much above climatology quantities of rainfall in the central and northern Libya even in the arid regions, however much less amounts were observed at northeastern coastal stations.
The general pattern of simulated wet dust deposition that affected northern Libya from 3–5 March, 2004 revealed that wet deposition in the coastal regions were dominated by the four soil components which include clay, small and large silt and sand materials. This finding is consistent with the outcomes of the field study that was conducted by O’Hara, Clarke, and Elatrash (Citation2006). The maximum wet removal process of clay and sand particles were identified in the north-western part of the Libyan coast during the period of 1200 until 1800 UTC on 3 March, and the two 6-hour increments during 0000 until 1200 UTC on 4 March, and at the eastern coast through late March 4 and early March 5 (see and ). These spatial distributions of deposition rates, coincident with the eastward movement of weather systems that were accompanied by high quantities of rainfall particularly at the central and western coastal areas, strong surface winds and upper-air trough (see ) during these periods of time. On the other hand, the highest dust wet deposition rates that were dominated by silts (small and large silt components) minerals were experienced during most of the study period (see and ). These largest wet deposition values were mainly true of the western coastal regions and through most of the entire study period, especially at Masrata station, however, large amounts also recorded at eastern stations during late 4 and early 5 March. Relative to the other soil components, deposited silts quantities were found to be greater across the entire coastal regions, with small silt quantities being the greatest. The highest quantities of 7848 mgr/m2 and 3058 mgr/m2 of small and large silts respectively were calculated in Masrata regions at 0000 UTC on 5 March, with lesser amounts were found in areas of Sirt, Ajdabia and Benina. The characteristics of natural Libyan soil which is rich in quartz (Elatrash Citation2004), can be attributed to largest values of such component sediment types.
Libya, including its coastal regions, is considered to be both a main dust source and dust sink (e.g., O’Hara, Clarke, and Elatrash Citation2006; Tsarpalis et al. Citation2018). Furthermore, from a climatic point of view, Libya, in spring season, is also known as major desert dust-transport routes (O’Hara, Clarke, and Elatrash Citation2006; Eddenjal Citation2015). Additionally, linking these deposited quantities of soil components with movement of responsible synoptic weather systems during such extreme springtime Saharan event that was accompanied by storm wind speeds over the study region, it suggests that the calculated sediments were likely to be partly locally derived. However, upper-air south-westerly flow (see ) might also be contributed to these wet deposition rates across the affected areas. Thus, wet deposited values can be correlated with synoptic systems movement and associated strong near surface wind speeds. Therefore, the estimation of blow cloud scavenging by rain strongly depends on dust load quantities.
The maximum wet removal process of clay and sand particles, as mentioned earlier, was identified at the eastern coast through late on the day on 4 March to early 5 March (see and ). However, there were lesser amounts of precipitation recorded along these coastal regions at that time compared to the recorded rainfall quantities across the central and northwestern Libya where the maximum wet removal process of clay and sand particles registered during the period of 1200 until 1800 UTC on 3 March. Thus, rainfall amounts cannot only be considered as the dominant factor affecting such calculated wet deposition rates. When rain falls through dust clouds, the process of scavenging occurs, whereby dust particles are collected within the raindrops and fell to the surface. Consequently, higher wet rates are also driven by dust loading (airborne dust concentration) and particle size.
As stated above, high contribution of quartz to Libya soil and the drastic synoptic situation, the peak amounts of wet deposition were reached by silts particles during this study while sand component seem to be the least deposited aerosols through the entire studied region. However, the simulated data are very important to estimate the quantity of dust wet deposition due to unavailability of measurements of deposited wet sediment in Libya.
Authors’ contributions
All authors contributed to the study conception and design. Material preparation, data collection and analysis were performed by [Benaouda Douaiba] and [Ali Eddenjal]. The first draft of the manuscript was written by [Benaouda Douaiba] and [Ali Eddenjal]. All authors commented on previous versions of the manuscript. All authors read and approved the final manuscript.
Declarations of interest statement
The authors confirm that there is no conflict of interest.
Acknowledgments
We acknowledge the Libyan National Meteorological Center for providing us the climatological data. We gratefully thank the weather observers (named Salem Moftah & Mohamed Ayob) who helped us in interpreting the SYNOP messages. We would also like to thank Mr. Husayn Ahmeed who provided us rainfall climatology and monthly rainfall totals. We gratefully acknowledge the use of imagery from NASA’s Worldview (EOSDIS) application and NASA’s Ozone Processing Team in providing the TOMS data. We are indebted to the ECMWF for providing ERA-5 data.
A special thanks to Prof. G. Kallos and the Atmospheric Modeling and Weather Forecasting Group of the University of Athens for providing the desert dust cycle module used in this work. We wish also to thank Prof. Peters Knipperz for providing us documentations and his orientations of this work. Last but not least, we thank Dr. Ahmed El Kenawy for comment on the manuscript.
References
- Adelsberger, K. A., and J. R. Smith. 2009. Desert pavement development and landscape stability on the Eastern Libyan Plateau. Egypt Geomorphol. 107 (3–4):178–94. doi:10.1016/j.geomorph.2008.12.005.
- Ben-Mahmoud, K. 1995. The Libyan soil; composition, classification, properties, and agricultural potential (in Arabic). National Authority for Scientific Research, Benghazi, Libya.
- Betts, A. K. 1986. A new convective adjustment scheme. Part 1: Observational and theoretical basis. Q. J. Roy. Meteor. Soc. 112 (473):677–91. doi:10.1002/qj.49711247307.
- Brandt, J., J. H. Christensen, and L. M. Frohn. 2002. Modelling transport and deposition of caesium and iodine from the Chernobyl accident using the DREAM model. Atmos. Chem. Phys. 2:397–417. doi:10.5194/acpd-2-825-2002.
- Callot, Y., B. Marticorena, and G. Bergametti. 2000. Geomorphologic approach for modelling the surface features of arid environments in a model of dust emissions: application to the sahara desert. Geodinam. Acta. 13 (5):245–70. doi:10.1080/09853111.2000.11105373.
- Cassola, F., F. Ferrari, and A. Mazzino. 2015. Numerical simulations of Mediterranean heavy precipitation events with the WRF model: A verification exercise using different approaches. Atmos. Res. 164–165:210–25. doi:10.1016/j.atmosres.2015.05.010.
- Copernicus Climate Change Service (C3S) of the Global Climate. 2017. ERA5: Fifth generation of ECMWF atmospheric reanalysis. Copernicus climate change service climate data store (CDS), date of access. https://cds.climate.copernicus.eu/cdsapp#!/home.
- Desboeufs, K., E. Bon Nguyen, S. Chevaillier, S. Triquet, and F. Dulac. 2018. Fluxes and sources of nutrient and trace metal atmospheric deposition in the northwestern Mediterranean. Atmos. Chem. Phys. 18 (19):14477–92. doi:10.5194/acp-18-14477-2018.
- Douaiba, B., A. Azzi, A. Khorsi, and A. Benlefki. 2014. Dry deposition from Sahara sources regions of western Africa. Adv. Meteorol. 2014:1–17. doi:10.1155/2014/419838.
- Eddenjal, A. S. 2015. Dust/sand storms over Libya: Spatial distribution, frequency and seasonality. Technical Report. World Meteorological Organization (WMO). WMO. SDS-WAS Barcelona, (19 pp), SDS-WAS-2015-001.
- Elatrash, M. S. 2004. Aeolian dust emission, transport and deposition in Western Libya. Doctoral diss., University of Nottingham.
- El-Takhtiet, A. 1978. National atlas of Libya, Tripoli, Libya.
- Engelstaedter, S., I. Tegen, and R. Washington. 2006. North African dust emissions and transport. Earth. Sci. Rev. 79 (1-2):73–100. doi:10.1016/j.earscirev.2006.06.004.
- Ferrier, B. S. Y. Jin, Y. Lin, T. Black, E. Rogers, and G. DiMego. 2002. Implementation of a new grid-scale cloud and precipitation scheme in the NCEP Eta Model. Proceedings of the 15th Conference on Numerical Weather Prediction, 12–16 August 2002. San Antonio, TX, Amer. Meteor. Soc., 280–3.
- Figgis, B., B. Guo, W. Javed, S. Ahzi, and Y. Rémond. 2018. Dominant environmental parameters for dust deposition and resuspension in desert climates. Aerosol Sci. Technol. 52 (7):788–98. doi:10.1080/02786826.2018.1462473.
- García, P., C. Pando, K. Haustein, O. Jorba Casellas, Z. Janjic, N. Huneeus, J. M. Baldasano Recio, and J. P. Perlwitz. 2011. Atmospheric dust modeling from meso to global scales with the online NMMB/BSC-Dust model–Part 1: Model description, annual simulations and evaluation. Atmos. Chem. Phys. 11 (24):13001–27.
- Gläser, G., P. Knippertz, and B. Heinold. 2012. Orographic effects and evaporative cooling along a subtropical cold front: The case of the spectacular Saharan dust outbreak of March 2004. Monthly Weather Rev. 140 (8):2520–33. doi:10.1175/MWR-D-11-00315.1.
- Gong, W., C. Stroud, and L. Zhang. 2011. Cloud processing of gases and aerosols in air quality modeling. Atmosphere. 2 (4):567–616. doi:10.3390/atmos2040567.
- Janjic, Z, 1994. The step-mountain eta coordinate model: further developments of the convection, viscous sublayer, and turbulence closure schemes. Mon. Weather Rev. 122:927–45.
- Jung, E., and Y. Shao. 2006. An intercomparison of four wet deposition schemes used in dust transport modeling. Global Planet. Change. 52 (1–4):248–60. doi:10.1016/j.gloplacha.2006.02.008.
- Kallos, G. 1997. The regional weather forecasting system SKIRON: a general overview. In Proceedings of the Symposium on Regional Weather Prediction on Parallel Computer Environments, Athens, Greece.
- Kallos, G., M. Astitha, P. Katsafados, and C. Spyrou. 2007. Long-range transport of anthropogenically and naturally produced particulate matter in the mediterranean and north atlantic: current state of knowledge. J. Appl Meteor. Climatol. 46 (8):1230–51. doi:10.1175/JAM2530.1.
- Kallos, G., and P. Katsafados. 2008. Desert dust uptake-transport and deposition mechanisms-impacts of dust on radiation, clouds and precipitation. In Fluid mechanics of environmental interfaces, 113–44. Leiden, The Netherlands: Taylor and Francis e-Library.
- Knippertz, P., and A. H. Fink. 2006. Synoptic and dynamic aspects of an extreme springtime Saharan dust outbreak. Q J. R Meteorol. Soc. 132 (617):1153–77. doi:10.1256/qj.05.109.
- Knippertz, P, and J. B. W. Stuut. 2014. Mineral dust: A key player in the earth system. Dortdrecht, The Netherland: Springer (509 pp).
- Koren, I., Yoram, J. Kaufman, R. Washington, M. C. Todd, Y. Rudich, M. J. Vanderlei, and D. Rosenfeld. 2006. The Bodele depression: a single spot in the Sahara that provides most of the mineral dust to the Amazon forest. Environ. Res. Lett. 1 (1):014005. doi:10.1088/1748-9326/1/1/014005.
- Kubilay, N., S. Nickovic, C. Moulin, and F. Dulac. 2000. An illustration of the transport and deposition of mineral dust onto the eastern Mediterranean. Atmos. Environ. 34 (8):1293–303. doi:10.1016/S1352-2310(99)00179-X.
- Lao, Q., L. Jiao, F. Chen, L. Chen, and X. Sun. 2018. Influential factors and dry deposition of polychlorinated biphenyls (PCBs) in atmospheric particles at an Isolated Island (Pingtan Island) in Fujian Province, China. Atmosphere 9 (2):59. doi:10.3390/atmos9020059.
- Liu, X., Z. Y. Yin, X. Zhang, and X. Yang, 2004. Analyses of the spring dust storm frequency of northern China in relation to antecedent and concurrent wind, precipitation, vegetation, and soil moisture conditions. J. Geophys. Res. Atmosph. 109 (D16):D16210.1–16. doi:10.1029/2004JD004615.
- Mahowald, N., S. Albani, J. F. Kok, S. Engelstaeder, R. Scanza, D. S. Ward, and M. G. Flanner. 2014. The size distribution of desert dust aerosols and its impact on the Earth system. Aeolian Res. 15:53–71. doi:10.1016/j.aeolia.2013.09.002.
- Middleton, N. J. 2019. Variability and trends in dust storm frequency on decadal timescales: climatic drivers and human impacts. Geosciences 9 (6):261. doi:10.3390/geosciences9060261.
- Moore, R. A., R. Hanlon, C. Powers, D. G. Schmale, and B. C. Christner. 2020. Scavenging of sub-micron to micron-sized microbial aerosols during simulated rainfall. Atmosphere 11 (1):80. doi:10.3390/atmos11010080.
- Nickovic, S., G. Kallos, A. Papadopoulos, and O. Kakaliagou. 2001. A model for prediction of desert dust cycle in the atmosphere. J. Geophys. Res. 106 (D16):18113–29. doi:10.1029/2000JD900794.
- Nickovic, S. D. Mihailovic, B. Rajkovic, and A. Papadopoulos. 1998. The weather forecasting system SKIRON: Description of the model. In Fluid mechanics of environmental interfaces, ed. C. Gualtieri and D. T. Mihailovic, 2nd ed. Novo Sad: Taylor & Francis.
- O’Hara, S. L., M. L. Clarke, and M. S. Elatrash. 2006. Field measurements of desert dust deposition in Libya. Atmos. Environ. 40 (21):3881–97. doi:10.1016/j.atmosenv.2006.02.020.
- Ogilbee, W, and H. A. Tarhuni. 1962. Ground water resources of the Qarahbulli Area, Tripolitania, United Kingdom of Libya, U. S. Geological Survey, 97 pp.
- Ogilbee, W. R. C. Vorbis, and A. Russo. 1962. Ground water resources of the Sorman Area, Tripolitania, United Kingdom of Libya, Department of the Interior, United States, Geological Survey.
- Pierce, J. R., B. Croft, J. K. Kodros, S. D. D’Andrea, and R. V. Martin. 2015. The importance of interstitial particle scavenging by cloud droplets in shaping the remote aerosol size distribution and global aerosol-climate effects. Atmosph. Chem. Phys. Discuss. 15 (11):6147–58.
- Şen, Z., and A. G. Eljadid. 1999. Rainfall distribution function for Libya and rainfall prediction. J. Hydrol. Sci. 44 (5):665–80. doi:10.1080/02626669909492266.
- Shao, Y. 2008. Physics and modelling of wind erosion. 2nd ed. Dordrecht: Springer.
- Shao, Y., A. H. Fink, and M. Klose. 2010. Numerical simulation of a continental-scale Saharan dust event. J. Geophys. Res. 115:D13205. doi. doi:10.1029/2009JD012678.
- Shao, Y., K.-H. Wyrwoll, A. Chappell, J. Huang, Z. Lin, G. H. McTainsh, M. Mikami, T. Y. Tanaka, X. Wang, and S. Yoon. 2011. Dust cycle: An emerging core theme in Earth system science. Aeolian Res. 2 (4):181–204. doi:10.1016/j.aeolia.2011.02.001.
- Slinn, W. G. N. 1984. Precipitation scavenging. Atmospheric Science and Power Production.
- Steven, S.-K K., J. S. Fu, X. Dong, M.-T. Chuang, M. C. Gee Ooi, W.-S. Huang, S. M. Griffith, S. Kumar Pani, and N.-H. Lin. 2021. Sensitivity analysis of the dust emission treatment in CMAQv5.2.1 and its application to long-range transport over East Asia. Atmos. Environ. 257:118441. doi:10.1016/j.atmosenv.2021.118441.
- Tegen, I. 2003. Modeling the mineral dust aerosol cycle in the climate system. Quat. Sci. Rev. 22 (18-19):1821–34. doi:10.1016/S0277-3791(03)00163-X.
- Torres, O., P. K. Bhartia, J. R. Herman, A. Sinyuk, P. Ginoux, and B. Holben. 2002. A long-term record of aerosol optical depth from TOMS observations and comparison to AERONET measurements. J. Atmos. Sci. 59 (3):398–413. doi:10.1175/1520-0469(2002)059<0398:ALTROA>2.0.CO;2.
- Tsarpalis, K., A. Papadopoulos, N. Mihalopoulos, C. Spyrou, S. Michaelides, and P. Katsafados. 2018. The implementation of a mineral dust wet deposition scheme in the GOCART-AFWA module of the WRF model. Remote Sensing 10 (10):1595. doi:10.3390/rs10101595.
- Wu, Y., J. Liu, J. Zhai, L. Cong, Y. Wang, W. Ma, Z. Zhang, and C. Li. 2018. Comparison of dry and wet deposition of particulate matter in near-surface waters during summer. PLoS One. 13 (6):e0199241. doi:10.1371/journal.pone.0199241.
- Zhang, X., L. Zhao, D. Tong, G. Wu, M. Dan, and B. Teng. 2016. A systematic review of global desert dust and associated human health effects. Atmosphere 7 (12):158. doi:10.3390/atmos7120158.
- Zhang, Z., W. Zhou, and L. Yang. 2019. Analysis of dust wet deposition in the mid-latitudes of the Northern Hemisphere. Air Qual. Atmos. Health. 12 (2):217–27. doi:10.1007/s11869-018-0652-7.