
 ?Mathematical formulae have been encoded as MathML and are displayed in this HTML version using MathJax in order to improve their display. Uncheck the box to turn MathJax off. This feature requires Javascript. Click on a formula to zoom.
Abstract
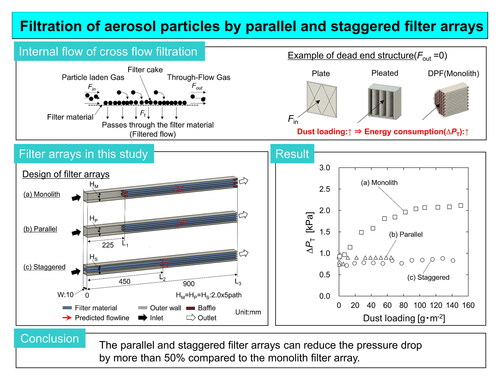
We report a simple paper filter-based cross flow filtration method for air purification. We have examined a monolith filter array with a cross flow ratio of 1.0 and parallel and staggered filter arrays with a cross flow ratio of about 0.7 in terms of pressure drop and collection efficiency. The monolith filter array shows a monotonic increase in pressure drop from approximately 0.9 to 2.1 kPa. The parallel and staggered filter arrays reduce the increase in pressure drop, which can be maintained as low as 0.8 kPa over the entire range of dust loadings examined. The monolith filter array shows the highest collection efficiency, which is more than 95% over the entire range of dust loadings examined. The collection efficiency of the parallel and staggered filter arrays is initially as high as 70% and decreases to 30% when the dust loading increases to 40 and 100 g m−2, respectively. In particular, collected particles are more uniformly distributed on the staggered filter array than on the parallel filter array, resulting in the initial collection efficiency of 70% being sustained for a longer time. This uniform distribution in the staggered filter array may prevent a rapid increase in local pressure drop. This study provides insight into the development of filtration systems using simple paper filters without increasing the pressure drop and decreasing the collection efficiency.
Copyright © 2022 American Association for Aerosol Research
Graphical abstract
EDITOR:
1. Introduction
Air filtration of fine particles is an economical air-purification technology and is widely used in general and industrial applications (Kanaoka Citation2019). Air filters are also an important component in mask technology (Zangmeister et al. Citation2020). High particle collection efficiencies by filters have been demonstrated in a number of studies. For example, Choi et al. (Citation2017), Omori et al. (Citation2019), and Kim et al. (Citation2020) reported that using nanofibers can greatly enhance particle collection on a filter to achieve a high particle collection efficiency (e.g., >99.9%). However, the high collection efficiency of particles is always accompanied by a high-pressure drop across a filter (Thomas et al. Citation2019). Because a high-pressure drop leads to high energy consumption, achieving a low-pressure drop without substantially reducing the particle collection efficiency is crucial in filter technology.
Pleated filters (Feng and Long Citation2016), diesel particulate filters (DPFs) (Konstandopoulos and Johnson Citation1989), and cross flow filtration methods (Wang et al. Citation2017) can be used to collect particles with a low-pressure drop. These filter systems have filters installed parallel to the particle-laden flow. The pleated filter and DPF have a dead-end structure in which the inlet and outlet of a particle-laden flow are alternately closed with the filter between them. In the dead-end structure, all fluid passes through the filter. To close the inlet and outlet alternately, pleated filters use bends in the filter, and DPFs have baffles to control flow. Feng and Long (Citation2016) evaluated the pressure drop in a pleated filter folded into a rectangle. Particles heterogeneously accumulate on surfaces in a pleated filter. Kanaoka (Citation2019) reports that nonuniform fluid resistance causes an increase in pressure drop. Konstandopoulos and Johnson (Citation1989) evaluated the pressure drop in a DPF and found an increase in pressure drop at the filter outlet. A dead-end structure in a filter system generally causes nonuniform accumulation of particles on the outlet side, which causes an increase in pressure drop as particles are collected (Kanaoka Citation2019). An increase in pressure drop across a filter can be delayed using another filter (i.e., prefilter) installed before the main filter to reduce the amount of particles collected (Tian et al. Citation2019).
To prevent the increase in pressure drop occurring in a dead-end structure, cross flow filtration can be used while maintaining a high collection efficiency (e.g., 99.9%) (Wang et al. Citation2017). The particle collection efficiency in cross flow filtration is controllable by the cross flow ratio, which is defined as the ratio of the amount of fluid perpendicular to the filter to the total amount of fluid (Wang et al. Citation2017). A cross flow ratio of 1.0 is comparable to a dead-end structure, such as a pleated filter or DPF. Sibanda, Greenwood, and Seville (Citation2001) examined the pressure drop and collection efficiency of 5 μm particles in a cross flow filtration system with a cylindrical filter with an inner diameter of 40 mm. The pressure drop of 6.0 kPa at a cross flow ratio of 0.6 was reduced to 1.0 kPa at a cross flow ratio of 0.1. However, the collection efficiency was as low as 2% at a cross flow ratio of 0.1. Wang et al. (Citation2017) studied cross flow filtration for the collection of ultrafine particles of <100 nm. The collection efficiency at a cross flow ratio of 0 was >99%, but the pressure drop was 5.0 kPa, which is 2.5 times higher than the operating pressure drop of 2.0 kPa of the widely used bug filter. Hence, its application is limited (Andersen, Nielsen, and Walther Citation2016). In addition, both studies used cylindrical filters for cross flow filtration, which may result in a more complicated fabrication process than simple paper filters.
In this study, we examine three filter arrays with a cross flow ratio of 1.0 or about 0.7 using four layers of a simple paper filter for particle collection at a low-pressure drop. Note that the crossflow ratios were not controlled, but estimated from the experimental results. We evaluate the pressure drop and collection efficiency of particles as a function of dust loading in the filter arrays. Then, we discuss the internal filter pressure drop and filter flow resistance that determine the filtered flow. The results obtained in this study may provide useful insights for the development of arrays using simple paper filter materials that can reduce the pressure drop without significantly reducing the collection efficiency.
2. Experimental
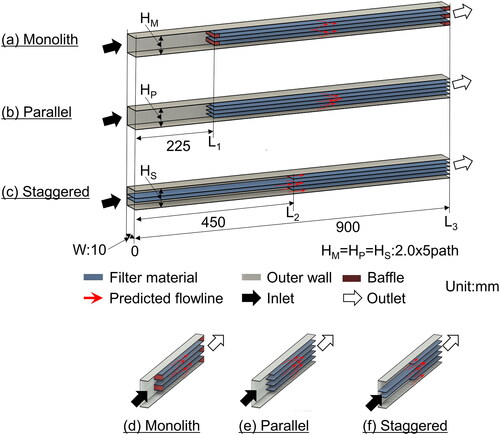
We assembled three filter arrays of different configurations that had four parallel layers of medium performance filter (TR091614, CAMBRIDGE FILTER JAPAN LTD) to examine the effect of the array configuration on the particle collection efficiency and pressure drop. The particle collection efficiency of the filter material is more than 95% for dust loadings from 30 to 150 g m−2 (Figure S1 in the Supporting Information [SI]). shows the configurations of the monolith filter array with a cross flow ratio of 1.0, and parallel and staggered filter arrays with a cross flow ratio of about 0.7. Note that the crossflow ratios were not controlled, but estimated from the experimental results as will be discussed later. The total filter area used to assemble the filter system was the same for all types of arrays. The staggered filter array has two 900 mm-long filter layers and two 450 mm-long layers, which are placed parallel to the incoming air flow. In all types of filter arrays, the width of filter materials is 10 mm and the airflow velocity passing through the cross section of the filter array is 16.7 m s−1. Here the staggered array is a stack of filters of different lengths to make the particle accumulation uniform. The parallel filter array has four 675 mm-long filter layers parallel to the air flow. The pressure drop across a single filter placed parallel to a particle-laden flow is generally lower than that of a filter placed perpendicular. Hence, the parallel and staggered filter arrays are expected to have a low-pressure drop. In contrast, the monolith filter array has the same configuration as the parallel array, but baffles are placed at the inlet and outlet () so that all the flow can penetrate the filters, which is comparable to the configuration of filters placed perpendicular to the flow.
Figure 1. Schematics of 3D structures of (a) monolith, (b) parallel, and (c) staggered filter arrays; enlarged view of (d) monolith, (e) parallel, and (f) staggered filter arrays.
The filter arrays were characterized in terms of particle collection efficiency and pressure drop, as shown in . Dust particles (KANTO loam (JIS Z8901 11 type), Japan Powder Industry Technology Association, Tokyo, Japan) generated from a fluidized bed granulator (MODEL 3211, KANOMAX JAPAN. Inc., Osaka, Japan) were loaded to the tested filter arrays at an air flow rate of 100 L min−1 using a diaphragm pump (DA-241S, ULVAC KIKO Inc., Kanagawa, Japan). The physical properties of the dust particles are shown in Tables S1 and S2 in the SI. The size distribution of the dust particles has a peak of 2 µm on a weight basis, and the density is 2.9–3.1 g cm−3. The particles were also collected on HEPA filters (>99% particle collection efficiency) at 100 L min−1. The collection efficiency, E, was calculated from the mass difference of particles collected on HEPA filters at the inlet and outlet of the tested filter arrays, m0 and m, respectively.
(1)
(1)
Figure 2. Schematic of the experimental setup used in this study.
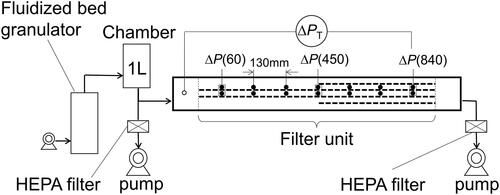
The pressure drop between the inlet and outlet of each tested filter array was measured using a differential pressure gauge (KGaA, 510, TESTO SE & CO, Titisee-Neustadt, Germany). Furthermore, the internal pressure drop between the second and third filter paths (marked with filled circles in ) was measured as a function of the array length to investigate the dust-load-dependent spatial distribution of internal flow. Photographs of the surfaces of the filter materials in each layer were taken using a digital camera (SELL1855, SONY, Tokyo, Japan) for visual inspection of particle accumulation. As shown in Photograph S2 in SI, darker areas represent larger amounts of particles collected on the filters. The greatest merit of this analysis method is that increased filter resistance due to particle accumulation can be visualized. It is also useful to understand the mechanism of particle collection in the filter array. The photographs were analyzed using image processing software (ImageJ, National Institutes of Health, Bethesda, MD) to quantify the relative change in the amount of particles collected on the filters. The raw photographs were converted into 8-bit images. Then, the gray values for each pixel in the image were extracted. A higher gray value represents a larger amount of dust particles accumulated.
3. Results and discussion
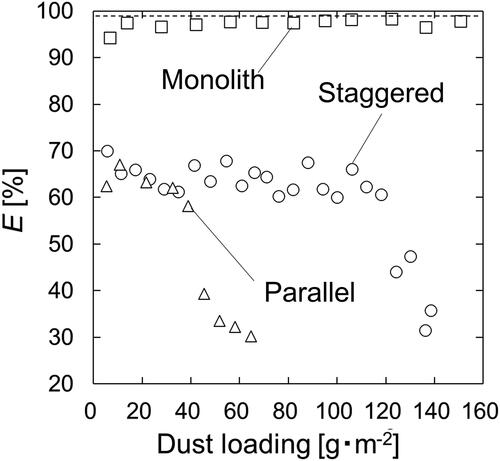
shows the particle collection efficiency as a function of dust loading for the three filter arrays. The monolith filter array shows the highest collection efficiency, which is more than 95% over the entire range of dust loadings examined. This is because all the particle-laden flow penetrates the filter materials due to the presence of baffles (). In the monolith filter array, all the particle-laden flow is filtered. This is supported by the collection efficiency of the monolith filter array, which is comparable to that of the filter material (the dashed line in ). In contrast, the parallel and staggered filter arrays have lower particle collection efficiencies than the monolith filter array because some fractions of the particle-laden flow are unfiltered or directly exit the filter array without any penetration of the flow into the filter materials. Nonetheless, the collection efficiencies of the parallel and staggered filter arrays are relatively high (i.e., 70%) at low dust loadings. The efficiency of the parallel filter array gradually decreases from 70 to 60% as the dust loading increases from 0 to 40 g m−2 and then rapidly decreases to ∼30% when the dust loading exceeds 40 g m−2. The initial efficiency of 70% of the staggered filter array is maintained at a higher dust loading than in the parallel array, and the onset dust loading of the efficiency drop is 100 g m−2, more than two times higher than that for the parallel array. This result suggests that the staggered filter array has a longer lifetime than the parallel array. The decrease in collection efficiency with dust loading can be explained by the increase in the unfiltered flow rate. As particles are captured and accumulate in the filter materials in the array, the flow field in the array is redistributed, and hence, the unfiltered flow rate dramatically increases (Sibanda et al. Citation2010). The dynamic behavior of the flow field will be discussed later.
Figure 3. Particle collection efficiency, E, as a function of dust loading for the monolith (squares), parallel (triangles), and staggered (circles) filter arrays at a flow rate of 100 L min−1. The dashed line indicates the collection efficiency of the filter material (Figure S1 in SI).
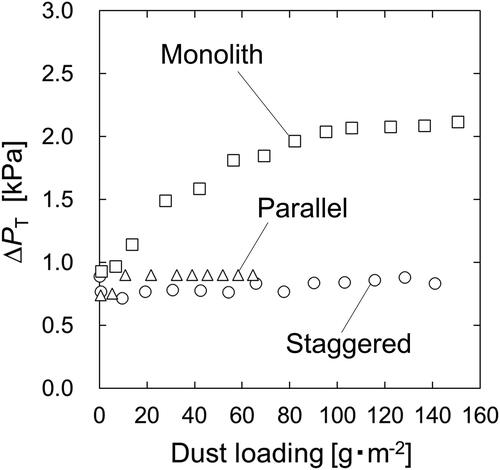
depicts the pressure drop, ΔPT, as a function of dust loading. The monolith filter array shows a monotonic increase in ΔPT from approximately 0.9 to 2.1 kPa, whereas the values for the other two arrays remain almost constant over the entire range of dust loadings examined. The ΔPT of the monolith filter array is more than three times higher than those of the parallel and staggered filter arrays because the unfiltered flow is negligible in the monolith array. Unlike the monolith filter array, the almost constant ΔPT values of the parallel and staggered filter arrays are attributable to the large fraction of unfiltered flow due to their filter array configurations (). The particle-laden flow mainly exits from the filter arrays without being filtered (). Interestingly, the accumulation of particles in the filters, which causes a drastic reduction in particle collection efficiency at higher dust loadings (), does not affect ΔPT.
Figure 4. Pressure drop, ΔPT, versus dust loading for the monolith (squares), parallel (triangles), and staggered (circles) filter arrays at a flow rate of 100 L min−1.
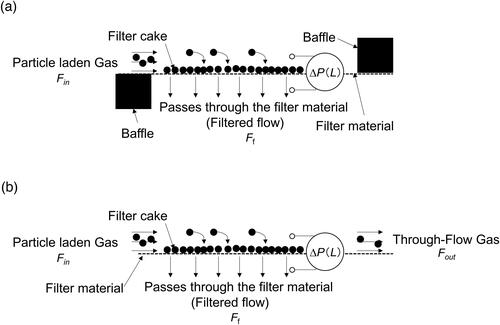
As mentioned above, the parallel and staggered filter arrays show distinctive filter performance: the changes in ΔPT in the filter arrays are negligible, and their collection efficiencies are relatively high (∼70%). In contrast, the monolith filter array has a high collection efficiency and a monotonic increase in ΔPT with dust loading. Here, we further discuss the filter performance in terms of the spatial distributions of internal pressure drops between the flow paths, as indicated by ΔP(L) (), and the flow resistance across the filter material. Particles can be captured by the filter material when a particle-laden flow passes through the filter material. In the parallel and staggered filter arrays, filtered flow (Ff) is expected to be faster than parallel flow (Fout) when the collection efficiencies are high, as shown in (i.e., Ff > Fout). Note that Fout in the monolith filter array is negligible ().
Figure 5. (a) Flow of the Monolith filter array; (b) two flows, parallel and filtered flow, in the parallel and staggered filter arrays.
The filtration conditions in the parallel and staggered filter arrays are comparable to cross flow filtration technology (Sibanda et al. Citation2010). Cross flow filtration technology utilizes a membrane (filter) array positioned parallel to a particle-laden flow. Similar to this study, particle filtration is realized by a pressure drop across the filter as the driving force (Wang et al. Citation2017; Kim and Zydney Citation2006; Bailey, Warf, and Maigetter Citation1990). The permeation flux passing through the filter for particle filtration is high when the pressure drop between the filters is large and the flow resistance of the filter is small. The filtration rate in cross flow technology increases with Ff (Kim et al. Citation2019; Sibanda et al. Citation2010). In addition, the accumulation of particles collected in the filters leads to an increase in the flow resistance of the filters, reducing the permeation flux (i.e., Ff) (Kyllönen et al. Citation2006; Baker et al. Citation1985). Dancy’s law (Kim et al. Citation2019; Li, H-Kittikun, and Youravong Citation2008) is given by:
(2)
(2)
where ΔP(L) and R(L) are the pressure drop (ΔP(L)), and the filter flow resistance (R(L)), respectively; µ the fluid viscosity. The only difference between this study and the cross flow filtration technology is the medium type (i.e., gas or liquid). Fundamental processes governing particle filtration are comparable. Therefore, we assume that EquationEquation (2)
(2)
(2) is applicable to our study. Rearranging EquationEquation (2)
(2)
(2) , the pressure drop, ΔP(L), in this study can be related to a flow perpendicular to the filter material, Ff(L), and the flow resistance across the filter material, R(L). Note that Ff(L) and R(L) are a function of filter array length, L, and particle accumulation in the filter material alters Ff(L) and R(L). As particles accumulate in the filter material, R(L) increases, and hence, ΔP(L) increases (Kanaoka Citation2019; Thomas et al. Citation2019; Saleh and Vahedi Tafreshi Citation2014). Evidently, the flow resistance of the filter material used in this study increases as the dust loading increases (Figure S2 in SI). Ff(L) is expected to be large in the initial stage for a small R(L), and Ff(L) decreases as R(L) increases. In this study, ΔP(L) and R(L) are critical parameters for determining the filter performance. The following sections will discuss the three filter arrays in terms of ΔP(L) and R(L).
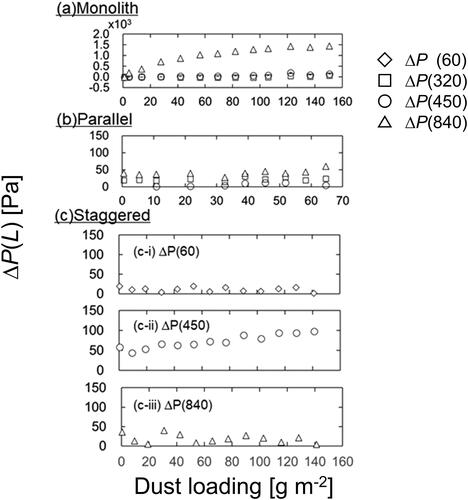
shows the pressure drop, ΔP(L), between the second and third flow paths at each length, L, versus dust loading. Since the monolith filter array and the parallel filter array are hollow up to L = 225 mm, L = 320 mm was adopted as the pressure measurement point on the inlet side in the pressure drop measurement. In the monolith filter array (a) and the parallel filter array (b), the pressure drop increases only at L = 840 mm. In contrast, the staggered filter array () shows a sharp increase in the pressure drop at the 450 mm point by approximately 50 Pa from the initial stage at a dust loading of 140 g m−2. This increase is clearly smaller than the result at 840 mm for the monolith filter array (1448 Pa). In the staggered filter array, the range of change from the initial stage at a dust loading of 64 g m−2 is approximately 24 Pa, which is approximately the same as the result at 840 mm for the parallel filter array (20 Pa). The powder layer is formed at the low flow resistance position, and the flow is guided to the other low flow resistance position. By controlling the pressure drop between the flow paths inside the array, a filtration area larger than the parallel filter can be secured. In addition, as explained earlier in EquationEquation (2)(2)
(2) , in the staggered filter array, R(L) increases due to the formation of accumulation. Since Fout increases at the same time, the staggered filter array has a filter structure in which ΔPT hardly changes. As shown in , since Ff(L) is constant in the monolith filter array, the collection efficiency does not change. In contrast, in the parallel and staggered filter arrays, the collection efficiency decreases because Ff(L) decreases.
Figure 6. Change in pressure drop distribution, ΔP(L), versus dust loading for (a) the monolith, (b) parallel, and (c) staggered filter arrays.
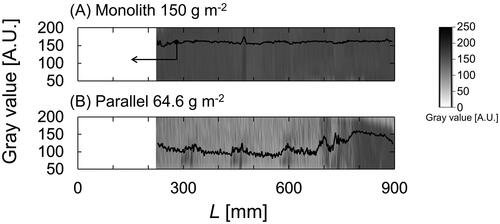
From the results of ΔP(L) shown in , it is predicted that the tendency of R(L) will be different for each filter array. Therefore, it is predicted that the particle accumulation is different between the monolith, the parallel, and the staggered filter arrays. To clarify the mechanism of each array, it is necessary to confirm the particle accumulation for each filter array. Therefore, image analysis was performed to understand the particle accumulation of each filter array ( and ). presents images of the surface of the second filter from the top of the monolith and parallel filter arrays under dust loading. In the monolith filter shown in (A), particles accumulate almost uniformly from approximately 250 mm where the filter starts. In contrast, in the parallel filter in (B), particles do not accumulate much on the filter surface even with an accumulation amount of 65 g m−2 (). In the monolith filter array, particles accumulate throughout the filter. In the parallel filter array, particles accumulate on the outlet side. The accumulation patterns of particles on the filter surface depend on the structure of the filter array.
Figure 7. Grayscale images of the monolith and parallel filter arrays. Averaged gray values (solid lines) at a given length, L. The photos are enlarged 14.5 times in the vertical direction. The gray value of the unused filter is 60.
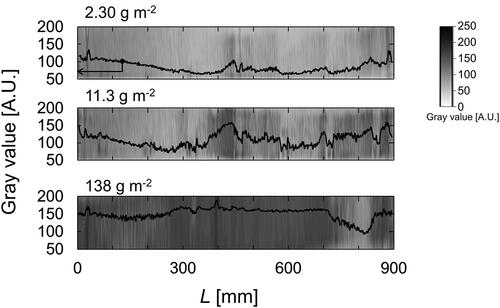
presents images of the top surface of the second filter from the top of staggered filter arrays under dust loading. At a dust loading of 2.30 g m−2, particles accumulate with a width of a few millimeters at the inlet, the middle part, and the outlet of the filter array. At a dust loading of 11.3 g m−2, particles accumulate at the inlet (L = 0–145 mm), the middle part (L = 370–570 mm), and the outlet (L = 815–900 mm); this range of accumulation is wider than that at a dust loading of 2.30 g m−2. At a dust loading of 138 g m−2, particles accumulate throughout the filter with a wider spread than that obtained with a loading of 11.3 g m−2. The results suggest that the staggered filter array can use the entire filter more effectively than the parallel filter array. As a result, the staggered filter array can maintain E up to a higher dust loading than the parallel filter array ().
Figure 8. Grayscale images of the staggered filter array at different dust loadings. Averaged gray values (solid lines) at a given length, L. The photos are enlarged 14.5 times in the vertical direction. The gray value of the unused filter is 60.
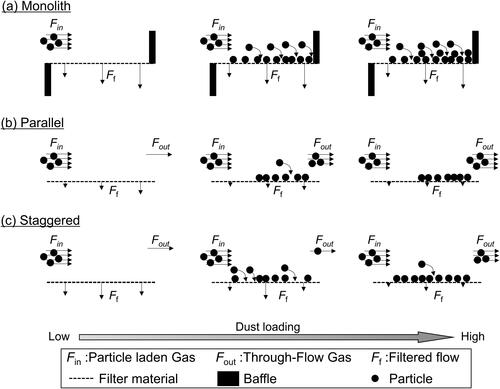
presents mechanisms of (a) monolith, (b) parallel, and (c) staggered filter arrays under dust loading. In (a) Monolith, all fluids pass through the filter. Ff is constant even when the dust loading increases. Therefore, high collection efficiency (>98%) can be obtained. Due to the accumulation of dust, R(L) increases and ΔP(L) increases. From , ΔP(L) increases remarkably at L = 840 mm. Therefore, the dust accumulation is mainly biased to L = 840 mm. In (b) parallel, when the dust loading is low, Ff is larger than Fout. Therefore, E of 50% or more can be obtained. On the other hand, when the dust loading increases, R(L) increases due to the accumulation of dust, and ΔP(L) increases. From , ΔP(L) increases remarkably at L = 840 mm. Therefore, the dust accumulation is mainly biased to L = 840 mm (, Photograph 1). In addition, as R(L) increases, Ff becomes smaller than Fout and E decreases. In (c) Staggered, when the dust loading is low, Ff is larger than Fout. Therefore, E of 50% or more can be obtained. In addition, since ΔP(L) of 24 Pa or more can be obtained at the positions of L = 60 mm, 450 mm, and 840 mm, filtration occurs in the entire filter (, Photograph 2). On the other hand, when the dust loading increases, R(L) increases due to the accumulation of dust, and ΔP(L) increases. From , ΔP(L) increases remarkably at L = 450 mm. Therefore, dust deposition mainly occurs at L = 450 mm. In addition, as R(L) increases, Ff becomes smaller than Fout and E decreases. However, since (c) staggered can filter the entire filter, it is possible to suppress the decrease in E with respect to the dust loading as compared with (b) Parallel.
Figure 9. Mechanisms schematic diagrams of (a) monolith, (b) parallel, and (c) staggered filter arrays.
4. Conclusion
Three filter arrays were examined in terms of pressure drop and particle collection efficiency as a function of dust loading. The following conclusions can be drawn:
In the monolith filter array, Ff is expected to be constant regardless of dust loading. ΔPT increases as dust loading increases due to the accumulation of particles on the filter surface. In contrast, in the parallel and staggered filter arrays, Ff is expected to decrease as dust loading increases. There is no significant increase in ΔPT when dust loading increases. The parallel and staggered filter arrays can reduce the pressure drop by more than 50% compared to the monolith filter array.
In the monolith filter array, even if the dust loading increases, an E of >95% is maintained. In the parallel and staggered filter arrays, E decreases from 70 to 30%.
The staggered filter array has a structure in which a ΔP(L) of >50 Pa is generated in the middle part. Hence, the accumulation of particles becomes uniform, and the filter can be used effectively.
For all filter arrays, R(L) is expected to increase as the dust loading increases (i.e., the gray value increases above the unused filter value).
Supplemental Material
Download MS Word (484.1 KB)Acknowledgments
The authors express special appreciation to Prof. Hidenori Higashi from University of Occupational and Environmental Health, Japan for his valuable suggestion and kind support.
References
- Andersen, B. O., N. F. Nielsen, and J. H. Walther. 2016. Numerical and experimental study of pulse-jet cleaning in fabric filters. Powder Technol. 291:284–98. doi:10.1016/j.powtec.2015.12.028.
- Bailey, F. J., R. T. Warf, and R. Z. Maigetter. 1990. Harvesting recombinant microbial cells using crossflow filtration. Enzyme Microb. Technol. 12 (9):647–52. doi:10.1016/0141-0229(90)90002-8.
- Baker, R. J., A. G. Fane, C. J. D. Fell, and B. H. Yoo. 1985. Factors affecting flux in crossflow filtration. Desalination 53 (1–3):81–93. doi:10.1016/0011-9164(85)85053-0.
- Choi, H. J., M. Kumita, S. Hayashi, H. Yuasa, M. Kamiyama, T. Seto, C. J. Tsai, and Y. Otani. 2017. Filtration properties of nanofiber/microfiber mixed filter and prediction of its performance. Aerosol Air Qual. Res. 17 (4):1052–62. doi:10.4209/aaqr.2016.06.0256.
- Feng, Z., and Z. Long. 2016. Modeling unsteady filtration performance of pleated filter. Aerosol. Sci. Technol. 50 (6):626–37. doi:10.1080/02786826.2016.1172058.
- Kanaoka, C. 2019. Fine particle filtration technology using fiber as dust collection medium. Powder Particle 36 (0):88–113. doi:10.14356/kona.2019006.
- Kim, D., M. Kwak, K. Kim, and Y. K. Chang. 2019. Turbulent jet-assisted microfiltration for energy efficient harvesting of microalgae. J. Membr. Sci. 575:170–8. doi:10.1016/j.memsci.2018.12.069.
- Kim, M., and A. L. Zydney. 2006. Theoretical analysis of particle trajectories and sieving in a two-dimensional cross-flow filtration system. J. Membr. Sci. 281 (1–2):666–75. doi:10.1016/j.memsci.2006.04.037.
- Kim, S. C., S. Kang, H. Lee, D. B. Kwak, Q. Ou, C. Pei, and D. Y. H. Pui. 2020. Nanofiber filter performance improvement: Nanofiber layer uniformity and branched nanofiber. Aerosol Air Qual. Res. 20 (1):80–8. doi:10.4209/aaqr.2019.07.0343.
- Konstandopoulos, A. G., and J. H. Johnson. 1989. Wall-flow diesel particulate filters—their pressure drop and collection efficiency. SAE Trans. 98:625–47.
- Kyllönen, H., P. Pirkonen, M. Nyström, J. Nuortila-Jokinen, and A. Grönroos. 2006. Experimental aspects of ultrasonically enhanced cross-flow membrane filtration of industrial wastewater. Ultrason. Sonochem. 13 (4):295–302. doi:10.1016/j.ultsonch.2005.04.006.
- Li, Z., A. H-Kittikun, and W. Youravong. 2008. Removal of suspended solids from tuna spleen extract by microfiltration: A batch process design and improvement. Biochem. Eng. J. 38 (2):226–33. doi:10.1016/j.bej.2007.07.005.
- Omori, Y., T. Gu, L. Bao, Y. Otani, and T. Seto. 2019. Performance of nanofiber/microfiber hybrid air filter prepared by wet paper processing. Aerosol Sci. Technol. 53 (10):1149–57. doi:10.1080/02786826.2019.1634243.
- Saleh, A. M., and H. Vahedi Tafreshi. 2014. A simple semi-numerical model for designing pleated air filters under dust loading. Sep. Purif. Technol. 137:94–108. doi:10.1016/j.seppur.2014.09.029.
- Sibanda, V., R. W. Greenwood, and J. P. K. Seville. 2001. Particle separation from gases using cross-flow filtration. Powder Technol. 118 (1–2):193–202. doi:10.1016/S0032-5910(01)00311-4.
- Sibanda, V., R. W. Greenwood, J. P. K. Seville, Y. Ding, and S. Iyuke. 2010. Predicting particle segregation in cross-flow gas filtration. Powder Technol. 203 (3):419–27. doi:10.1016/j.powtec.2010.03.039.
- Thomas, D., S. Pacault, A. Charvet, N. Bardin-Monnier, and J.-C. Appert-Collin. 2019. Composite fibrous filters for nano-aerosol filtration: Pressure drop and efficiency model. Sep. Purif. Technol. 215:557–64. doi:10.1016/j.seppur.2019.01.043.
- Tian, X., Q. Ou, J. Liu, Y. Liang, and D. Y. H. Pui. 2019. Influence of pre-stage filter selection and face velocity on the loading characteristics of a two-stage filtration system. Sep. Purif. Technol. 224:227–36. doi:10.1016/j.seppur.2019.05.031.
- Wang, L. Y., W. F. Yong, L. E. Yu, and T. S. Chung. 2017. Design of high efficiency PVDF-PEG hollow fibers for air filtration of ultrafine particles. J. Membr. Sci. 535:342–9. doi:10.1016/j.memsci.2017.04.053.
- Zangmeister, C. D., J. G. Radney, E. P. Vicenzi, and J. L. Weaver. 2020. Filtration efficiencies of nanoscale aerosol by cloth mask materials used to slow the spread of SARS-CoV-2. ACS Nano. 14 (7):9188–200. doi:10.1021/acsnano.0c05025.