
 ?Mathematical formulae have been encoded as MathML and are displayed in this HTML version using MathJax in order to improve their display. Uncheck the box to turn MathJax off. This feature requires Javascript. Click on a formula to zoom.
Abstract
Understanding the impact of inhaler mouthpiece sizes on particle transport and deposition in the human upper airway is important to optimize inhaler designs toward improving the therapeutic efficacy of inhaled drug delivery. This study demonstrates the potential effects of inhaler mouthpiece size on particle deposition in the human pharynx. MRI scans of two healthy human volunteers using a small and a large inhaler mouthpiece mockup were acquired. Four 3 D models of the pharynx were reconstructed from the MRI images, and CFD simulations using discrete phase modeling and polydisperse particles (MMD: 6.96 μm, span: 1.38 μm) were performed using two different transient flow profiles to investigate particle deposition with different peak flow rates. The results showed that particle deposition in the pharynx associated with a large mouthpiece and low peak flow rate (27 L/min) is more than 80% in one of the subjects, which is a onefold higher compared to when the subject was with the small inhaler mouthpiece. The cases with a small inhaler mouthpiece and high peak flow rate (85 L/min) have the least number of particles deposited in the upper airways of both subjects. The use of large inhaler mouthpiece results in an erratic distribution of particles deposition, with a higher concentration of particles in the oral cavity, not observed with the small inhaler mouthpiece. The results from this work provide further evidence to existing literature that inhaler mouthpiece size matters and that it produces intra and inter-individual variations in drug particle deposition characteristics in the human upper airway.
Editor:
Introduction
Inhaled drug delivery is the current gold standard treatment modality for respiratory diseases. There are currently more than 40 dry powder inhalers in the market, and the industry is estimated to reach $33 billion by 2023 (Xiroudaki et al. Citation2021) This is not surprising given that chronic obstructive pulmonary disease (COPD) and asthma are two respiratory diseases associated with exorbitant medical costs worldwide and represent 37.6% of death globally (López-Campos, Tan, and Soriano Citation2016; Nunes, Pereira, and Morais-Almeida Citation2017). Despite the significant advancement in inhaled drug therapy in the past decade, at least one study shows that the medical burden associated with COPD and asthma is likely to rise without a breakthrough in current treatment technologies (Morgan, Zakeri, and Quint Citation2018). The current understanding of what critical factors may affect the transport and deposition of drug formulations in the airway remains somewhat fragmentary given that it is a multifactorial problem that involves dry powder inhaler design, the physical properties of drug formulations, and differences in airway physiology, the latter of which includes the complexity of the pharynx geometries between humans. Ideally, deposition of drugs in the upper airway should be minimal to ascertain the maximal transport of active ingredients to the lower airways and to minimize drugs from being swallowed, leading to unwarranted systemic side effects.
The use of computational fluid dynamics (CFD) to elucidate the complex airflow (Cebral and Summers Citation2004; Kharat, Deoghare, and Pandey Citation2018; Kourmatzis, Cheng, and Chan Citation2018; Ma et al. Citation2020), and particle transport behavior in the human upper airway has increased significantly in the past two decades. These models are able to elucidate the potential locations of particle deposition in the upper airway, which would otherwise be difficult to achieve in in-vitro or in-vivo studies. By varying the flow conditions and particle properties, existing models have shed light on the mechanisms underpinning a given inhaled drug technology (Koullapis et al. Citation2016; Rahimi-Gorji, Gorji, and Gorji-Bandpy Citation2016; Zwartz and Guilmette Citation2001). Choosing a suitable closure model in CFD is necessary to enable the accurate prediction of flow field distribution in complex geometries like the upper airway. Both the k–ω and k-ε models are commonly used in respiratory-related flow simulations. Rahimi-Gorji et al. (Citation2015) investigated the effects of flow rates at 15 L/min, 30 L/min and 60 L/min with the k–ω SST turbulence model and demonstrated how flow rates affect particle deposition at different sections of the human pharynx. Xi and Longest (Citation2007) used a low Reynolds number (LRN) k–ω turbulence model to simulate laminar, transitional and fully turbulent flow in human airways and demonstrated that this approach could be used to accurately predict particle deposition patterns in upper airway models with highly realistic geometry. CitationTabe et al. (2022) showed that the transition k–kl–ω model might provide better predictions of pressure losses, especially for flow rates higher than 10 L/min after comparing their numerical results with experimental data. Song et al. (Citation2019) used the k-ε standard model to investigate changes in airflow in the human upper airways when oral appliances are used, and showed that the enlargement of the upper airway after wearing the oral appliance changed airflow dynamics significantly, especially at the narrow regions of the pharynx.
The differences in pharyngeal geometries and how they may affect drug deposition has been relatively well investigated, although knowledge of the specific anatomical structures of the pharynx that contribute to changes in particle deposition is less clear. Deposition studies using cascade impactors have shown that particle deposition in physiologically realistic upper airway geometries is higher (e.g., Grgic, Finlay, and Heenan Citation2004) when compared to the standardized USP (United states pharmacopeia) throat, the latter of which is the current standard in testing inhaled drug delivery. The above is well supported by experimental studies conducted in-vivo, where particle deposition in the human pharynx measured by SPECT-CT (single-photon emission computed tomography-computed tomography) showed that deposition could be higher than 65% (Yang, Chan, and Chan Citation2014). Along with the pharyngeal geometry, some studies have also investigated the effects of device resistance and mouthpiece size on upper airway geometry. The use of a high resistance device has been demonstrated to result in a narrower upper airway, specifically at the oropharynx region, consistent with the location of pharynx obstruction observed in sleep apnea patients (Remmers et al. Citation1978). The specific effects of collapsing airway wall and how such motion interacts with particles have been undertaken using complex computational model (Bates et al. Citation2019), and also through experimental work Cheng et al. (Citation2019). The effect of inhaler mouthpiece sizes on airway geometry is also apparent but appears to be variable between humans (Burnell et al. Citation2007; Grgic, Finlay, and Heenan Citation2004; Lin et al. Citation2001; Pritchard and McRobbie Citation2004), and it remains unclear what pharynx or craniofacial characteristics in patients may result in them being respondents to mouthpiece sizes by having physical changes in upper airway dimensions. While the effects of particle deposition in the pharynx related to different inhaler mouthpiece sizes have been investigated (Burnell et al. Citation2007; Grgic, Finlay, and Heenan Citation2004; Lin et al. Citation2001; Pritchard and McRobbie Citation2004), different inhalation systems have been typically tested on a common airway replica that did not account for the specific change in geometry caused by the use of different inhaler mouthpiece sizes. Hence, the specific implications of how mouthpiece size may affect particle deposition behavior through the altering of pharyngeal geometries within and between individuals remain unclear.
This research aims to shed light on how different inhaler mouthpiece sizes and inhalation flow profiles potentially affect particle deposition in the pharynx using computational models created using CFD. The laminar, transition k–kl–ω and standard k-ε model were used for the cases depending on the Reynolds number. We hypothesized that inhaler mouthpiece size could produce varying and significant effects on the deposition characteristics of particles in the upper airway within and between individuals depending on changes to the underlying flow structures in the airway.
Method
Ethics attestations
The study was approved by the Human Research Ethics Committee of Macquarie University and conducted according to the Declaration of Helsinki. Informed written consent was obtained from both the subject volunteers.
MR imaging
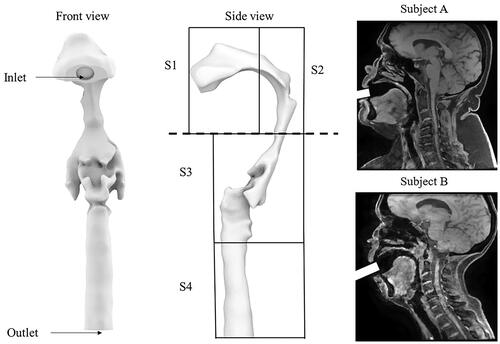
Two healthy normal subjects (one male, one female) with no history of sleep or any respiratory diseases volunteered for the study. The age for both participants was 56 years, and body mass index (BMI) was 39.5 kg/m2 for subject A and 20.4 kg/m2 for Subject B. Both subjects had no contraindication for MR imaging. The subjects were in a supine position and requested to breathe normally. During the scans, the subjects were requested to grip onto two different mockup inhalers between their teeth following the user instruction manual. Due to the inhaler design differences, the mouthpiece length inserted into the oral cavity was ∼ 20 mm and 30 mm for the Diskhaler and Aerolizer, respectively. Both inhalers were placed perpendicular to the mouth opening. One of the mouthpiece diameters is 11 mm (refer to as the small inhaler mouthpiece), and another is an ellipse-shaped mouthpiece (refer to as the large inhaler mouthpiece) with major and minor dimensions of 21 mm and 7 mm, respectively. shows which commercial inhalers the inhaler mockups may represent.
Table 1. Inlet area of the inhaler mockups and example of inhalers they represent.
Pads were placed around the volunteers’ heads to minimize head motion during scanning. We ascertained that the subjects were awake during scanning by interacting with them through the intercom and a buzzer that they held. Subjects were requested to breathe through the inhaler mockups which have very low resistance. Specific instructions were given to inform the participants when the scan commences. Isometric anatomical images were acquired, and the MR parameters were as follows: 256 mm field of view with a 256 * 256 matrix size (pixel size: 1 mm x 1 mm), 6.8 ms repetition time, 3 ms echo time, 144 × 108 scan resolution, and 1 mm slice thickness. The overall scan time was 6 mins. After the scan, the mockup inhaler was swapped with another without changing the head-neck position of the subject, and the above scanning protocol was repeated. Both mockup inhalers were sterilized and reused for the other subject.
Model reconstruction
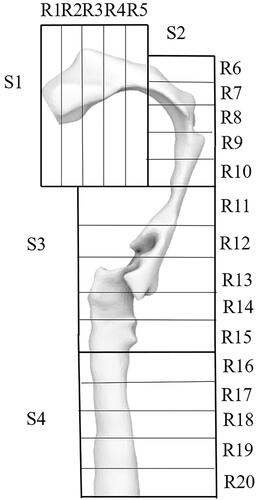
Given that there are two sets of MRI images for each subject (one with the small inhaler mouthpiece and another with the larger inhaler mouthpiece), a total of four three-dimensional models of the upper airway were constructed. 3 D slicer (www.slicer.org) was used to reconstruct the airway models, and a single threshold value was used to define the airway boundaries for all the models. A fixed value of smoothing function was applied to all the models before they were exported as STL files and converted to NURBS using Rhinoceros (Rhino 7, Robert McNeel & Associates, Seattle, Washington). The inlets of the inhaler mouthpieces were modeled, and their position relative to the tip of the mouth was referred from the MRI images. The upper airway model was then imported into ANSYS ICEM-CFD (ICEM CFD Engineering, Ansys 2019 R3, Canonsburg, Pennsylvania.) to generate the meshes. Each upper airway model was divided into six sections in ICEM-CFD, including the inlet, outlet and four other sections, which define different sections of the pharynx (). Briefly, Section 1 represents the oral cavity, section 2 represents a segment of the oral cavity and the oropharynx, section 3 represents a section of the oropharynx and laryngopharynx, and section 4 represents the trachea. These sections were specifically chosen to study the potential deposition of particles at the top and bottom halves of the tongue separated by the horizontal dotted line (see ). Tetrahedral/mixed unstructured mesh was used as the mesh type in ICEM-CFD and then converted to polyhedral in Fluent, and robust (octree) was selected as the primary mesh method. Quick (Delaunay) was then chosen to improve the mesh quality based on the mesh output from the existing mesh. In addition to the four geometrically realistic airway models, a three-dimensional model of the USP throat was also created to validate the accuracy of the computational models.
Figure 1. The upper airway model with labels from the front view and side view. Two typical sagittal images of the subjects are also presented in the figure. S1 represents the oral cavity, S2 represents a segment of the oral cavity and the oropharynx, section 3 represents a section of the oropharynx and laryngopharynx, and section 4 represents the trachea.
Computational modeling
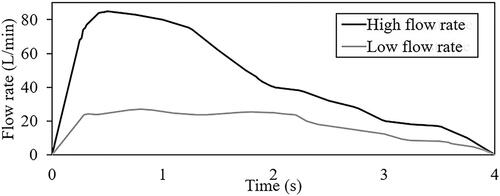
Mannitol was chosen as the particles in the discrete phase modeling. The density of the spray-dried mannitol particles was 1514 kg/m3, and this was prescribed in all models. The discrete phase boundary condition (DPBC) for the inlet and outlet was set as escape, and the DPBCs for the wall of sections 1, 2, 3 and 4 were set as trap. The turbulent intensity at the inlet was defined as 5% which has been commonly used in previous RANS simulations to represent irregular fluid motion at the inlet (Gallagher et al. Citation2021; Ma et al. Citation2020; Tu, Inthavong, and Ahmadi Citation2012). The viscosity ratio for the inlet was also defined as 10%. The pressure outlet boundary condition was implemented at the outlet. The total pressure was considered for backflow specification where the backflow direction is normal to the boundary. It applies the combined effects of gauge pressure and dynamic velocity contribution based on the velocity in the adjacent cell zone. Pressure-velocity coupling was implemented using the SIMPLEC algorithm with skewness correction of 1 and convergence criterion of 10−5. The model exported from ICEM-CFD was imported into ANSYS FLUENT (Ansys 2019 R3, Canonsburg, Pennsylvania) for the simulations. Double precision and parallel processing method with 6 processes were selected. An objective of this study is to understand the combined effects of peak flow rate with mouthpiece size on particles deposition. Two realistic inhalation profiles (see ), one with a low (27 L/min) peak flow rate and another with a high (85 L/min) peak flow rate associated with inhalers with the same mouthpiece size as the inhaler mockups were extracted from the literature (Clark, Weers, and Dhand Citation2020; Hira et al. Citation2018). The two inhalation profiles with different peak flow rates were prescribed on the inlets of the reconstructed geometrically realistic pharynx models to yield 8 sets of data. In all simulations, steady-state analysis was first performed, and results were used as the initialization conditions for the actual transient simulations.
Figure 2. Inhalation profiles associated with high and low flow rates.
shows the solver used for the eight upper airway models and the USP model. As mentioned previously, the Reynolds number associated with each computational model was analyzed to prescribe the relevant numerical schemes. The turbulent k-ε standard was used for all the high flow rate cases and the USP model. Transition k–kl–ω was used for the transition flow cases, and these are associated with the low flow rate cases in airway models that represent subject A and subject B biting on the small inhaler mouthpiece. Flow in the airway for the rest of the cases is laminar. The three flow rates prescribed in the USP computational model shown in were obtained from Cheng et al. (Citation2019).
Table 2. Viscous model corresponding to the airway models.
Governing equations
The Reynolds number associated with each computational model was analyzed using EquationEquation (1)(1)
(1) . The density of air (ρ) and its dynamic viscosity (
) was prescribed as 1.225 kg/m³ and 1.825*10−5 kg/ms, respectively. The velocity (v) was the peak flow rate of the inhalation flow profile, and characteristic length (L) was extracted from the inhaler diameter.
(1)
(1)
The turbulent k-ε model (Launder and Sharma Citation1974) used for turbulent flow (Reynolds number > 4000) in this study was defined by EquationEquation (2)(2)
(2) and EquationEquation (3)
(3)
(3) as shown below, where EquationEquation (2)
(2)
(2) was used to define turbulent kinetic energy k and EquationEquation (3)
(3)
(3) was used to define the dissipation, ε.
(2)
(2)
(3)
(3)
Where represents the velocity component in the corresponding direction,
represents the component of the rate of deformation, and
represents turbulent viscosity.
and
are the constant values obtained by fitting various turbulent flows through multiple iterations of the data.
The transition k–kl–ω model used for transition flow (2000 < Reynolds number <4000) was defined by the three equations as shown in EquationEquations (4)–(6).
(4)
(4)
(5)
(5)
(6)
(6)
Where in EquationEquation (4)
(4)
(4) was used to model the turbulent kinetic energy and
in EquationEquation (5)
(5)
(5) was used to model the laminar kinetic energy. In the transition region, the energy associated with the Tollmien-Schlichting instabilities was captured by
in the equation.
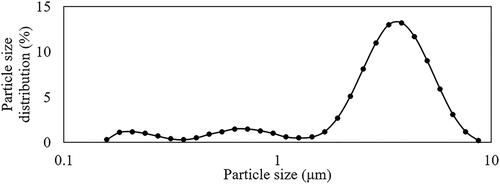
The particle sizes in the simulations were defined based on the size distribution of mannitol shown in . The governing equation used for the particle transport simulation was based on EquationEquation (7)(7)
(7) .
(7)
(7)
Where g is the gravity vector, equaling to 9.81 N/kg, is the particle density (kg/m3),
is the particle diameter (m),
is the particle displacement (m),
Is the drag force coefficient, and v is the velocity vector (m/s).
Figure 3. Particle size distribution of dry powder mannitol.
The Stokes number (Stk) determined using EquationEquation (8)(8)
(8) , is a dimensionless unit that has been widely used to estimate particle deposition efficiencies in existing airway deposition studies, such as in Inthavong, Tu, and Heschl (Citation2011), Grgic, Finlay, and Heenan (Citation2004), Si et al. (Citation2013), Cheng (Citation2003), Cheng, Zhou, and Chen (Citation1999), Zhang, Kleinstreuer, and Kim (Citation2002), and Wang et al. (Citation2009).
(8)
(8)
(9)
(9)
(10)
(10)
(11)
(11)
(12)
(12)
Where is the particle density (kg/m3),
is the fluid viscosity (Ns/m2), d is the particle diameter (m).
in EquationEquation (8)
(8)
(8) is the equivalent characteristic diameter (m), which is two times the hydraulic radius as defined by EquationEquation (9)
(9)
(9) , where the area in the equation represents the airway inlet surface area. Q (EquationEquation (10)
(10)
(10) ) is the flow rate (L/min), where
in the equation is the equivalent characteristic air velocity (m/s) and was determined by EquationEquation (11)
(11)
(11) , where
is the density of air (1.225 kg/m3) and q is the dynamic pressure defined by EquationEquation (12)
(12)
(12) .
As the simulation was performed using polydisperse particles, EquationEquation (13)(13)
(13) was used to analyze the deposition efficiencies for the results presented in .
(13)
(13)
Mesh, particles and time-step independence test
At least 5 inflation layers were ascertained and generated for all the models. Mesh independence tests were performed in all the models representing subject A. All four models (associated with subject A) with different mesh densities of 0.23 million, 0.45 million, 0.86 million and 1.65 million were created. Results of the mesh independence tests can be found in the online supplementary information (SI; see Figure SI1). Briefly, the maximum mean velocity differences between the models with 0.86 million and 1.65 million mesh elements for the airway models is 1.57% and it is related to the case with small inhaler mouthpiece and low peak flow rate which was simulated with the k–kl–ω model. Hence, the model with 0.86 million mesh elements was deemed adequate to perform the simulations.
To ensure that the simulated results are independent of the number of particles injected, particle number independence test was also performed in the airway model that represents subject A with a small inhaler mouthpiece size and at a peak flow rate of 85 L/min, using five different injection files with particle numbers of 1000, 2000, 4000, 8000 and 16,000. Particle deposition in the upper airway for these cases was calculated, and the results are presented in the SI (see Figure SI2). The particle independence test demonstrates that the deposition results are least sensitive when 8000 and 16,000 particle numbers are simulated, with a negligible difference of 0.04% between the two cases. 8000 particles were therefore chosen as the number of particles used for all the simulations. In addition, a time step independence test was also performed in the airway model that represents subject A with small inhaler mouthpiece size and high peak flow rate. The time step size tested was 0.16 s, 0.08 s, 0.04 s, 0.02 s and 0.01 s. Results of the time step size independence tests (see the SI Figure SI3), show that the particle deposition differences between the 0.02 s and 0.01 s time step sizes were negligible and is only 0.7%. A time step of 0.01 s was used for all the simulations.
The accuracy of the computational models was validated by comparing the results with existing in-vitro studies (Cheng et al. Citation2019), using the same particles and experimental flow conditions. In the study (Cheng et al. Citation2019), spray-dried mannitol was dispersed in a USP throat at flow rates of 40 L/min, 60 L/min and 80 L/min. The mass median diameter [D50] of the spray-dried mannitol was 3.10.03 μm, and the particle size distribution is shown in . An injection file with the same particle size distribution illustrated in was written, and particles were prescribed in random order at the upper airway models’ inlet surface.
Results
Validation of computational models with published experimental studies
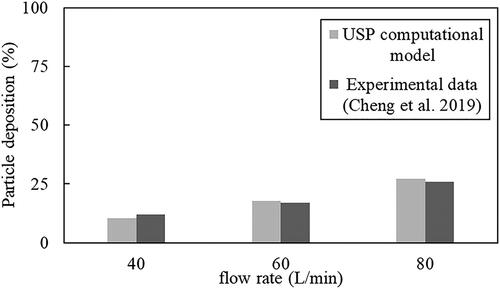
shows the deposition efficiency of mannitol particles in the USP throat models at three different flow rates. Results from the models match very well with the experimental data from Cheng et al. (Citation2019) obtained using the same particles and flow conditions. Particle deposition in Cheng et al. (Citation2019) was determined by measuring the mass of the particles using high-performance liquid chromatography, and hence, the mass fraction of particles deposited in the USP computational model was also analyzed. Results from shows that deposition in the USP throat increases with flow rate in both the actual experiments (Cheng et al. Citation2019) and in the computational models. The percentage differences between the results simulated using the models and the actual experimental data are 1.6%, 0.8% and 1.2% for the 40 L/min, 60 L/min and 80 L/min flow cases, respectively, showing excellent agreement with the experimental data.
Figure 4. USP model validation with experimental results (Cheng et al. Citation2019) at different flow rates.
Effects of inhaler mouthpiece sizes and inhalation profiles on particle deposition characteristics in the upper airway
Eight simulations were performed to investigate the effects of inhaler sizes and inhalation profiles with different peak flow rates on the number-based particle deposition in the upper airways. The four sections of the airway described in Methods is subdivided into five different domains, resulting in 20 regions, labeled as R1 (Region 1) to R20 (Region 20), to help discuss particle deposition at specific airway locations (see ).
Figure 5. The upper airway model with very detailed labels.
The effects of different inhaler sizes on particle deposition at different upper airway regions are shown in . There are three key observations that will be the subject of discussion, and they are (i) differences in mean particle deposition at the 20 airway regions (R1 to R20). The mean particle deposition, which is calculated by dividing the total particle deposition by 20 (number of airway regions), expressed as a percentage, is represented by horizontal lines depicted in the figures; (ii) particle deposition at the oral cavity and trachea; (iii) distribution pattern of particles along the length of the upper airway. A table that summarizes the mean and total particle deposition in the upper airway based on different inhaler mouthpiece sizes used and volume of the reconstructed airway is shown in .
Figure 6. Number-based particle deposition fractions along the upper airways. Cases of subjects A and B with, (a) low peak flow rate and small mouthpiece, (b) high peak flow rate and small mouthpiece, (c) low peak flow rate and large mouthpiece, and (d) high peak flow rate and large mouthpiece.
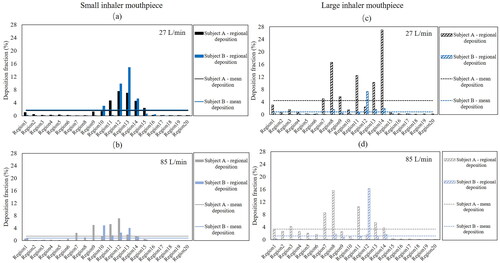
Table 3. Mean and total number-based and mass-based particle deposition for small and large inhaler mouthpiece simulated with inhalation flow profile with a low and high peak flow rates.
Small inhaler mouthpiece
demonstrates the differences in the simulated particle deposition in the upper airway of the two different subjects for the small inhaler mouthpiece and low peak flow rate cases. The mean particle deposition is similar for both subjects and is 1.7 ± 0.09% despite the subjects having distinctly different airway geometries. In both subjects, the deposition of particles in S1 (oral cavity) and S4 (trachea) appears to be minimal compared to the other extrathoracic airway regions, and particle deposition is concentrated at S2 and S3, from R9 to R15. Particle deposition appears to follow a “pseudo normally” distributed profile, where the most probable deposition region is roughly halfway down the airway in the stream-wise direction, with least probable regions being close to the inlet and outlet. This was true in both subjects in these cases (small mouthpiece and low peak flow rate condition), albeit having some differences in the number of particles deposited within the concentrated zone between R9 to R15, between both subjects
shows how particle deposition in the upper airway may be altered when peak flow rate increases in the case of the small inhaler mouthpiece, with the effect appearing to be variable between subjects. While the mean particle deposition in the upper airway does not appear to change in subject A, less deposition is observed in the pharynx of subject B. The overall particle deposition fraction in the upper airway of subject B is around two times lesser than the low peak flow rate case (see results in ), albeit having the same small mouthpiece size. While there is very little deposition at S1 (oral cavity) and S4 (trachea) in both subjects, there is a rather obvious shift in deposition profile along the airway such that particle deposition is now concentrated between R7 to R14, compared to the R9 to R15 regions in the cases with a small mouthpiece and a low peak flow rate condition. The particle distribution profile also appears to be less analogous to that of the “pseudo-normal” distribution trend, and this could be related to the fact that more impaction may have occurred at section 2 due to the higher peak flow rate, which is consistent with the increase in particles deposited at that section.
Large inhaler mouthpiece
shows the potential combined effects of inhaling through a large inhaler mouthpiece at low peak flow rate. The difference in deposition fraction between the large and small mouthpiece is apparent. Particle deposition variation is more significant for subject A compared to subject B. The results suggest that inhaling through an inhaler with a large mouthpiece at a low peak flow rate condition may tend to produce a more erratic distribution of particles along the airway, as can be observed in subject A, which is in stark contrast to the particle distribution profile associated with the small inhaler mouthpiece and low peak flow rate condition case. In subject A, particle distribution is concentrated at regions between R7 and R14. Specifically, particle deposition is as high as 16.7% at R8 (tip of the soft palate) and 27% at R14, just slightly downstream of the epiglottis. Both the uvula and epiglottis are two protruding anatomical structures that are likely to disrupt flow in the upper airway. The sporadic concentration of particles deposited at these airway locations is less obvious in subject B, and the above suggests that the roles these anatomical structures play in particle deposition are likely rather variable between humans. It is also worth noting that in subject B, the percentage of particles deposited in R12 (slightly above the tip of the epiglottis) is 7.3%, which is relatively high and is more than 3.5 times higher than what was deposited on its surrounding airway structures. The effects of anatomical structures on flow fields are likely to play an important role in the above observations. An oral inhalation device with a large mouthpiece potentially benefits subject B in minimizing the particles deposited in the upper airway. The mean particle deposition in the upper airway of subjects A and B as shown in are 4.5 and 0.8, respectively. These values indicated a potential 51.1% improvement and 19.4% worsening of particle deposition efficiencies in subjects A and B, respectively, if they swapped from a small mouthpiece device to a larger mouthpiece when inhaling at low peak flow rate conditions. also shows that 6.5% of the particles are deposited in S1 (oral cavity) of subject A whereas the number of particles deposited in the same section is negligible for subject B.
The erratic distribution of particles deposited along the airway is again observed in , which shows the results of the large inhaler mouthpiece with high peak flow rate cases. Similar to the previous observation regarding the effects that mouthpiece sizes potentially introduce, inhaling through a large inhaler mouthpiece at a high peak flow rate appears to have variable effects between the subjects. The mean particle deposition in the upper airway of subjects A and B are 3.4% and 1.2%, respectively. These values indicated a worsening of 15.4% and an improvement of 8.9% in subjects A and B, respectively, when compared to their corresponding cases of inhaling through inhalers with similar mouthpiece sizes and at low peak flow rates. In subject A, deposition of particles in S1 (Oral cavity) is apparent, with maximum deposition occurring at R8 (the tip of the uvula) and additionally significant deposition occurring at R11 and R7. The above observation is significantly different from subject B, where deposited particles are concentrated primarily at R12 (slightly above the tip of the epiglottis). Last but not least, compared to all the cases, particle deposition in the oral cavity is the highest for subject A with a large inhaler mouthpiece, simulated with a high peak flow rate, and the total deposition for this case is as high as 15.1% in the S1 (oral cavity) alone in subject A.
Particles emitted from the upper airway
The cumulative number of particles over time and at the outlet of the 8 different upper airway models are shown in . The results show that none of the cases is similar and illustrate that drug particle delivery and deposition, including the duration of the particle settling time in the lower airways, are potentially different between and within humans when inhaling through different inhaler mouthpiece sizes at different flow rates. While the total number of cumulated particles (represented by the Y-axis) exiting the upper airway is related to how many particles are trapped in the upper airway, other factors such as the transient flow conditions and magnitude of peak flow rate play a role in the emission characteristics of the particles. The number at the end of each particle deposition plot in represents the mean particle deposition for each model depicted by the horizontal lines in .
Figure 7. Cumulative particles escaped from upper airway outlet in subject A (a) and subject B (b) The x-axis is a dimensionless unit obtained by normalizing the time it takes the particles to be completely emitted from the airway against the time to takes to reach the peak flow rate. The dotted line indicates where the dimensionless unit is at unity.
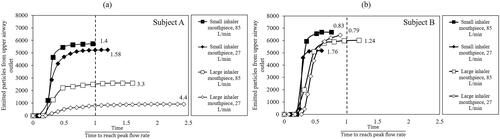
compare the differences in the duration and number of particles emitting out from the upper airway models between subjects A () and B (). In the figures, the x-axis represents a dimensionless unit that represents the time it takes for the particles to be completely emitted from the airway normalized against the time to reach the peak inspiratory flow. Hence, cases where the emitted particles occur beyond unity (see vertical dotted line) are cases associated with the complete emission of particles pass the occurrence of the peak flow rate. While inhaler mouthpiece size and peak flow rate affect the number and duration it takes for the particles to be completely emitted from the upper airway in both subjects, subject B appears to be less affected than subject A. Particles are completely emitted from the upper airway of subject B before the peak inhalation flow rate, for all the low peak flow rate cases regardless of the size of the inhaler mouthpiece simulated. Contrary to subject B, for most of the cases related to subject A, the particles are only completely emitted of the airway past the peak flow rate, suggesting the presence of complex flow structures such as recirculation in the pharynx geometry in this subject. In addition, the number of particles emitted to the lungs in subject A differs by as much as 54.6% between the small inhaler mouthpiece with high peak flow rate case and the large inhaler mouthpiece with low peak flow rate case. The results described above could be different when particles with a larger particle size band are simulated, and this merits further investigation.
Streamlines and recirculation flow
shows the streamlines in all the models. It also shows how the upper airway geometry (in the mid-sagittal plane) can be potentially altered by inhaler mouthpiece sizes. The changes in pharynx geometry when a large inhaler mouthpiece size is used is more apparent in subject A than in subject B. In subject B, the use of a large inhaler mouthpiece resulted in an expanded oral cavity, and narrow airway cross-section between S2 and S3 (refer to ), with an apparent increase in airway occlusion at the level of the soft palate and at the tip of the uvula, not observed in subject A. The general narrowing of the upper airway at section 2 can also be observed in subject A, albeit being less obvious than subject B. Another key observation is that in subject A, the large inhaler mouthpiece appears to have widened the airway cross-section at S3, which is not apparent in subject B. When considering all the above information, a plausible explanation for the erratic deposition of particles along the upper airway associated with the large inhaler mouthpiece may be related to the narrowing of the pharynx behind the tongue and the adverse deposition of particles in the pharynx could be potentially aggravated when regions downstream of the airway expand, presumably due to airway muscle contraction to promote flow. Such upper airway deformation behavior when biting on large objects is unlikely common to all humans, which, as demonstrated through this current work, is only limited to subject A. In both subjects, the geometry of the trachea is unaffected, which is expected given that the structure is formed by rigid cartilaginous rings, which helps stabilize this region of the pharynx.
Figure 8. Streamlines in the upper airways with different inhaler mouthpiece sizes and peak flow rate conditions at 2.5, 7.5 and 15% of inhalation phase for both subjects where (a) high peak flow rate and (b) low peak flow rate. The upper airway is halved in each minor panel, showing the oral cavity and oropharynx on the left and, part of the laryngopharynx and trachea on the right.
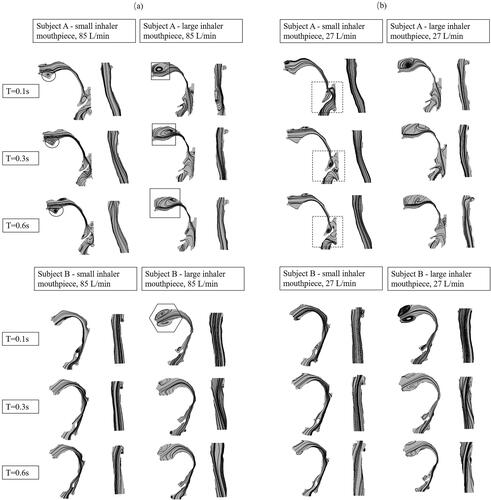
Further insights on how the upper airway geometry may have affected particle deposition can be realized by observing the streamlines, especially through the recirculation flows developed in the pharynx. shows the potential effects when inhaling through different inhaler mouthpiece sizes at high peak flow rate for both subjects. The expansion of the oral cavity associated with the use of an inhaler with a large mouthpiece tends to produce more recirculation flow at this airway section in subject A (see square inset) and subject B (see hexagon inset), and provides some evidence that such flow dynamics may be responsible for the high number of particles deposited in S1 (oral cavity), as shown in the results presented in . While the recirculation flow is observed in the case of subject A with a small inhaler mouthpiece, they are smaller (see black circle inset) and appear not to increase over time, at least when determined from the mid-sagittal plane. These results corroborated with the observation that particle deposition in S1 (oral cavity) of subject A with a small inhaler mouthpiece is relatively low compared to the case of the large inhaler mouthpiece. The recirculation flow in the oral cavity of subject A appears to get larger over time (see square inset) in the case of the large inhaler mouthpiece, which may explain at least partially the high deposition in the upper airway in subject A for this case.
shows the potential effects when inhaling through small and large inhaler mouthpiece sizes at a low peak flow rate. In both subjects, recirculation flow in the cases with large inhaler mouthpiece and low peak flow rate is intense at the onset of inhalation and occur as early as 2.5% of the inhalation duration. Minor recirculation flow can also be observed at the airway location anterior to the epiglottis (see black dotted square) in the case of subject A with small inhaler mouthpiece, which also appears to persist throughout a large phase of inhalation, which is an observation that is less apparent in the other cases. This observation corresponds with the high particle deposition at R11 to R15 for this case, as shown in .
Discussion
There is minimal published work on the impact of inhaler mouthpiece sizes on particle deposition in the human upper airway. To the best of the author’s knowledge, this is a unique study, in that it demonstrates the potential impact of inhaler mouthpiece sizes on particle deposition which occurs due to alteration of the human pharynx geometry. As such, the study examines the combined effects of inhaler mouthpiece size, oropharyngeal geometry, and peak flow rate. Specifically, we have demonstrated how simulated particle deposition behavior can vary with different inhaler mouthpieces sizes, and physiological realistic inhalation profiles within and between two subjects. While particle deposition in the trachea is minimal, it is fairly consistent in all the cases simulated and is neither affected by inhaler mouthpiece sizes or flow conditions. Particle deposition can be highly variable in the oral cavity, which appears to be aggravated by a large inhaler mouthpiece. Last but not least, a small inhaler mouthpiece tends to produce particle distribution characteristic that follows a pseudo-normal distribution profile along the length of the airway, not seen in the cases with the large inhaler mouthpiece. The cases with the large inhaler mouthpiece are associated with concentrated deposition of particles at specific sites of the upper airway where protruding airway anatomical structures such as the uvula and epiglottis are located. The detailed mechanisms such as the flow components that attribute to the above observations have not been completely elucidated in this current study, and differences in the intensity of recirculation flow and their development over time appear to be at least one potential factor that is responsible for the large variation in deposition efficiencies observed between the two human subjects when different inhaler mouthpiece sizes are used.
Particle deposition in the USP computational model is validated against the experimental data presented in a published study (Cheng et al. Citation2019) which measured particle deposition in the USP replica using the same particles and flow conditions. The results match very well for all flow rates (40, 60 and 80 L/min), demonstrating the robustness of the methods employed in this current work. In addition to this validation, other results in existing work on the deposition of particles in a USP throat also match well with this study’s results, albeit using particles of a slightly different size band and flow rates (Huang et al. Citation2021; Zhou, Sun, and Cheng Citation2011). The deposition efficiencies analyzed from the models in this current study are presented with some existing data (Cheng, Zhou, and Chen Citation1999; Cheng Citation2003; Grgic, Finlay, and Heenan Citation2004; Xi and Longest Citation2007; Zhang, Kleinstreuer, and Kim Citation2002) in the literature (see the SI; Figure SI4). The data shows that results from subject B correspond well with the deposition data of upper airway replicas with realistic geometries but less with those with canonical and simplified geometries, including the USP throat. Other evidence supporting the results of this current work regarding the accuracy of particles deposited in the airway are as follows. In this current study, the percentage fraction of particles deposited in the pharynx ranges between 16% to 83%. Lindert, Below, and Breitkreutz (Citation2014) performed an in-vitro study to measure particles deposited in an idealized pharynx model associated with Cyclohaler, which has a mouthpiece size similar to that of the Aerolizer. Results from that study showed that the deposition fraction at the oropharyngeal section is 38% and 32% for flow rates of 30 L/min and 75 L/min, respectively. These data match well with the results of subject A, where the deposition efficiency associated with peak inspiratory flow rates of 27 L/min and 85 L/min, and an inhaler with a small mouthpiece size (Aerolizer) is 43% and 27%, respectively. The data also matches well with the oropharyngeal deposition in subject B, which is ∼ 42% in the case with an inhalation profile that has a peak inspiratory flow rate of 27 L/min and a small inhaler mouthpiece size. Delvadia et al. (Citation2013) performed an in-vitro deposition study with a Diskhaler (large inhaler mouthpiece) at 84 L/min. Their results show that particle deposition in the pharynx were approximately 50% for the Diskhaler. This corresponds fairly well with the results presented for subject B (the subject which is less affected by inhaler mouthpiece size) in this current study, where the particle deposition fraction in the upper airway for the corresponding case is 44%.
One of the main findings from this current study is that, while the use of a large inhaler mouthpiece may not necessarily result in more particles being deposited in the upper airway, it may result in an erratic distribution in the number of particles deposited along the pharynx, at least in some humans. The mechanisms underpinning the difference in particle deposition characteristics between the use of inhalers with different mouthpiece sizes are linked to the upper airway geometry, which, based on the MRI scan of subject A, suggest that the use of a large inhaler mouthpiece may result in the increase in oropharynx diameter in the antero-posterior dimension. Such a change in airway dimension is similar to what has been reported in an existing work (Pritchard and McRobbie Citation2004), and is likely related to the contraction of the tongue muscle, such as the genioglossus, to promote airway flow, given that a significant portion of the oral cavity may have been occluded by the large inhaler mouthpiece. Another seemingly subtle evidence for this is that the difference in oral cavity sizes observed from the mid-sagittal plane, between when the small inhaler mouthpiece and large inhaler mouthpiece are used, is more significant for subject B than in subject A. A larger oral cavity may have resulted in minimal alteration of the oropharynx geometry due to the absence of flow limitation. The above suggests that tongue and oral cavity sizes may be important factors that have varying impacts on the efficacy of oral inhaled drug delivery, and the ideal positioning of the tongue in individuals, especially when large inhaler mouthpieces are used, merits further investigation.
DeHaan and Finlay (Citation2004) studied monodisperse aerosol deposition in an oral cavity model with different particle sizes (2.5 μm, 3.8 μm and 5 μm), flow rates (15 to 90 L/min) and inhaler mouthpiece sizes (diameter ranging from 3 mm to 17 mm). Their results showed that deposition in the airway replica tends to be higher with a small inhaler mouthpiece. Lin et al. (Citation2001) investigated particle deposition in an oral-pharyngeal laryngeal airway cast models using monodisperse particles and also showed that deposition appears to be generally higher in the cases with small inhaler mouthpiece size, although the effects are less apparent with the 2 μm and 8 μm particle sizes. It is important to note that in the above studies, a common idealized adult oral upper airway model was used to test the range of inhalation systems, which is unlike this current work where the change in pharynx geometry associated with the use of different inhaler mouthpiece sizes were accounted. The experimental outcomes demonstrated in the two studies mentioned above though, corresponded with the results presented in subject B in this current work where the geometry of the upper airway is less altered by inhaler size, and deposition is higher in the case of small mouthpiece size simulated with low inhalation peak flow rate condition.
Cheng, Zhou, and Su (Citation2015) used a range of human oropharyngeal replicas to study the influence of the oral inlet dimension on oropharyngeal deposition. Their results showed that replicas with large inlet diameter are associated with higher particle deposition in the pharynx, which corresponds lightly with the results of this study. However, unlike this current work, the replicas in that study have similar geometry at the oropharynx region and hence suggest that changing the inlet diameter of the airway alone may be significant enough to introduce differences in deposition behavior in the human pharynx. Grgic, Finlay, and Heenan (Citation2004) used monodisperse particles to investigate the effects of airway geometries caused by subjects having a forward and rolled back tongue position. Their results showed that while aerosol deposition difference is high between subjects, variations are less apparent within subjects when different tongue positions are tested. It is clear that the independent effects of mouthpiece sizes on individuals have not been specifically addressed in the above study. Results from this current work suggest that the absence of significant within-subject variation in particles deposition reported in Grgic, Finlay, and Heenan (Citation2004) could be related to a combination of factors that may include the lack of change in pharynx geometry in the subjects, difference in the size of the particles and span of the particle size distributions tested and flow conditions (constant flow vs realistic inhalation flow profile).
Another finding from this study is that despite the complexity of the pharynx and their differences between individuals, deposition of particles appears to follow a pseudo-normal distribution profile along the upper airway in all cases with a small inhaler mouthpiece. However, the combined effects of a small inhaler mouthpiece size and high peak flow rate shift the deposition distribution profile slightly toward the oral cavity. On the contrary, in all cases associated with a large inhaler mouthpiece, particle deposition along the length of the pharynx is more unpredictable, which is also accompanied by a general increase of particle deposition in the oral cavity. Results from the flow streamlines on the mid-sagittal plane show that the above observation corresponds with the location and intensity of airflow recirculation and suggests that mechanisms to prevent recirculation from developing in the airway may be useful to minimize particle deposition in the pharynx. That being said, maximum particle deposition appears to occur consistently at the epiglottis region, regardless of the airway geometries, inhaler sizes, and inhalation peak flow rates, despite the absence of strong flow recirculation (based on observation of streamlines in the mid-sagittal plane).
Limitations
There are several inherent limitations in this study that may be considered when interpreting the results. First, investigations conducted are only based on two different inhaler sizes, and therefore a universal conclusion with regards to how particle deposition changes as a function of inhaler size requires further study. Understanding the above would ideally require the investigation of tongue muscle contraction pattern, oral cavity size changes and tongue positioning when subjects bite on different mouthpiece sizes during imaging (McRobbie, Pritchard, and Quest Citation2003). In addition, it would be useful to investigate how the above differs in population groups with different BMI, gender, and age, given that all these factors have been demonstrated to affect respiratory muscle function and upper airway dynamics (Cheng et al. Citation2014). Understanding the above may be useful to identify humans that exhibit a dramatic response to mouthpiece size, in terms of the change in pharynx geometry. Second, the airway geometries presented in this study are taken from MRI images acquired over a duration of 6 mins. As upper airway walls may deform considerably during breathing, particularly in some very narrow airways (Cheng et al. Citation2014), the pharynx geometries in this current study hence only represent the average dimension of the airway. While obtaining the pharynx images specific to the inhalation phase could be achieved by a respiratory-gated sequence, tissue motion is the most apparent during inspiration (Zhao et al. Citation2020), and hence, reconstructing the airway based on inhalation related images is unlikely to change the conclusion of this current study. Third, the discussion in this current work is based solely on spray-dried mannitol with a relatively small particle size band. Further investigations on larger particle sizes such as those in excipient drug formulation and different particle size distribution profiles are warranted to further elucidate the role and potential effects of inhaler mouthpiece size in inhaled drug delivery. In addition, other seemingly important factors that have not been integrated into this study are the effects of temperature and humidity. Both of these effects were not considered in the equations, and existing studies (e.g., Xi et al. Citation2013) have demonstrated that the increase in thermos-humidity condition can increase the amount of particle deposition in the upper airway. Further work to delineate and describe how additional variables such as humidity and temperature may affect particle deposition in the context when different inhalers mouthpiece sizes are used, would be useful. Another point of interest is the impact of the length of the inhaler mouthpiece on the particle deposition results reported in this study. In this current work, there is a slight difference in the insertion length between the two inhaler mouthpieces due to differences in inhaler design. At least one study has demonstrated that mouthpiece length is unlikely to affect particle deposition in the oropharynx significantly (Svartengren et al. Citation1996). Nonetheless, the combined and independent effects of mouthpiece diameter and length ought to be investigated in further studies, given that both these variables have the potential to alter tongue position, which may occlude the space of the oral cavity and result in significant changes in particles deposition at the oropharynx. Finally, including the effects of inhaler resistance is important (McRobbie and Pritchard Citation2005) as it has a significant impact on the human upper airway geometry. Existing in-vivo studies have also demonstrated that deposition is higher in the lung when high resistance inhalers are used, indicating lesser deposition in the human upper airway (Yang et al. Citation2016). Acquiring images of the upper airway associated with the use of resistive devices would require the subjects to breathe through those devices during imaging which may lead to hypoxia in some volunteers. The quality of the imaging data would also be compromised by the potential inconsistencies when inhaling through very high resistive devices. Such studies, though, together with extended dynamic airway wall deformation studies and in a larger cohort of subjects, are important considerations of future work, given the ability of the upper airway to deform dramatically with different physiological processes, including inhalation conditions.
Conclusion
Within the limitations of this study, including the investigations of only two human subjects, the following conclusions have been derived:
There are intra and inter-subject variations in airway geometry when different inhaler mouthpiece sizes are used, and these changes can impact inhaled drug delivery dramatically. This study provides some evidence that the intra-subject variation in particle deposition related to the use of different inhaler mouthpiece sizes could be as high as a fold (subject A).
A key underpinning mechanism associated with the higher particle deposition in the airway appears to be the development of recirculating flows that persists over a longer duration.
The use of a large inhaler mouthpiece is associated with the erratic distribution of particles in the airway regardless of the flow conditions examined in this study. The benefits of a large inhaler mouthpiece over a small inhaler mouthpiece in minimizing particles deposited in the pharynx likely varies between humans, as observed in this study, where a large inhaler mouthpiece results in lesser particles deposited in subject B but not in subject A.
More studies are warranted to thoroughly investigate the effects of inhaler mouthpiece sizes and their role on inhaled drug delivery, and especially to discover what factors may be used to predict whether an individual is a significant responder to inhaler mouthpiece sizes non-invasively.
| List of symbols | ||
| ρ | = | air density (kg/m³) |
| μ | = | dynamic viscosity (kg/ms) |
| Re | = | Reynolds number |
| v | = | velocity (m/s) |
| L | = | characteristic length (m) |
| = | the velocity component in the corresponding direction | |
| = | the component of the rate of deformation | |
| = | turbulent viscosity | |
| = | the constant values obtained by fitting various turbulent flows through multiple iterations of the data | |
| = | turbulent kinetic energy | |
| = | laminar kinetic energy | |
| = | inverse time scale | |
| g | = | gravity vector, equaling to 9.81 N/kg |
| = | particle density (kg/m3) | |
| = | particle diameter (m) | |
| = | particle displacement (m) | |
| = | drag force coefficient | |
| = | equivalent characteristic air velocity (m/s) | |
| = | equivalent characteristic diameter (m) | |
| Q | = | flow rate (L/min) |
| Stk | = | Stokes number |
| = | deposition efficiency (%) | |
| = | volume (m3) | |
Authorship contribution
All authors have participated and contributed to the research, data analysis and preparation of the final version of this article.
Supplemental Material
Download (2.4 MB)Acknowledgments
We would also like to thank Jeffery Mclntosh and Margery Pardey from Macquarie medical image center for their help with the MRI scans.
Disclosure statements
The authors have no interests, funding or employment that may inappropriately influence or affect the integrity of this submission.
Additional information
Funding
References
- Bates, A. J., A. Schuh, G. Amine-Eddine, K. McConnell, W. Loew, R. J. Fleck, J. C. Woods, C. L. Dumoulin, and R. S. Amin. 2019. Assessing the relationship between movement and airflow in the upper airway using computational fluid dynamics with motion determined from magnetic resonance imaging. Clin. Biomech. 66:88–96. doi:10.1016/j.clinbiomech.2017.10.011.
- Burnell, P. K. P., L. Asking, L. Borgström, S. C. Nichols, B. Olsson, D. Prime, and I. Shrubb. 2007. Studies of the human oropharyngeal airspaces using magnetic resonance imaging IV-the oropharyngeal retention effect for four inhalation delivery systems. J Aerosol Med. 20 (3):269–81. doi:10.1089/jam.2007.0566.
- Cebral, J. R., and R. M. Summers. 2004. Tracheal and central bronchial aerodynamics using virtual bronchoscopy and computational fluid dynamics. IEEE Trans Med Imaging. 23 (8):1021–33. doi:10.1109/TMI.2004.828680.
- Cheng, S., A. Kourmatzis, T. Mekonnen, H. Gholizadeh, J. Raco, L. Chen, P. Tang, and H.-K. Chan. 2019. Does upper airway deformation affect drug deposition? Int. J. Pharm. 572:118773. doi:10.1016/j.ijpharm.2019.118773.
- Cheng, S., E. C. Brown, A. Hatt, J. E. Butler, S. C. Gandevia, and L. E. Bilston. 2014. Healthy humans with a narrow upper airway maintain patency during quiet breathing by dilating the airway during inspiration. J. Physiol. 592 (21):4763–74. doi:10.1113/jphysiol.2014.279240.
- Cheng, Y. S. 2003. Aerosol deposition in the extrathoracic region. Aerosol Sci. Technol. 37 (8):659–71. doi:10.1080/02786820300906.
- Cheng, Y. S., Y. Zhou, and W.-C. Su. 2015. Deposition of particles in human mouth-throat replicas and a USP induction port. J Aerosol Med Pulm Drug Deliv. 28 (3):147–55. doi:10.1089/jamp.2013.1105.
- Cheng, Y.-S., Y. Zhou, and B. T. Chen. 1999. Particle deposition in a cast of human oral airways. Aerosol Sci. Technol. 31 (4):286–300. doi:10.1080/027868299304165.
- Clark, A. R., J. G. Weers, and R. Dhand. 2020. The confusing world of dry powder inhalers: It is all about inspiratory pressures, not inspiratory flow rates. J Aerosol Med Pulm Drug Deliv. 33 (1):1–11. doi:10.1089/jamp.2019.1556.
- DeHaan, W. H., and W. H. Finlay. 2004. Predicting extrathoracic deposition from dry powder inhalers. J. Aerosol Sci. 35 (3):309–31. doi:10.1016/j.jaerosci.2003.09.002.
- Delvadia, R., M. Hindle, P. W. Longest, and P. R. Byron. 2013. In vitro tests for aerosol deposition II: IVIVCs for different dry powder inhalers in normal adults. J Aerosol Med Pulm Drug Deliv. 26 (3):138–44. doi:10.1089/jamp.2012.0975.
- Gallagher, C., S. Jalalifar, F. Salehi, A. Kourmatzis, and S. Cheng. 2021. A two-fluid model for powder fluidisation in turbulent channel flows. Powder Technol. 389:163–77. doi:10.1016/j.powtec.2021.05.019.
- Grgic, B., W. H. Finlay, and A. Heenan. 2004. Regional aerosol deposition and flow measurements in an idealized mouth and throat. J. Aerosol Sci. 35 (1):21–32. doi:10.1016/S0021-8502(03)00387-2.
- Grgic, B., W. H. Finlay, P. K. P. Burnell, and A. F. Heenan. 2004. In vitro intersubject and intrasubject deposition measurements in realistic mouth–throat geometries. J. Aerosol Sci. 35 (8):1025–40. doi:10.1016/j.jaerosci.2004.03.003.
- Hira, D., H. Koide, S. Nakamura, T. Okada, K. Ishizeki, M. Yamaguchi, S. Koshiyama, T. Oguma, K. Ito, S. Funayama, et al. 2018. Assessment of inhalation flow patterns of soft mist inhaler co-prescribed with dry powder inhaler using inspiratory flow meter for multi inhalation devices. PLoS ONE 13 (2):e0193082–e0193082. doi:10.1371/journal.pone.0193082.
- Huang, F., Y. Zhang, Z. B. Tong, X. L. Chen, R. Y. Yang, and A. B. Yu. 2021. Numerical investigation of deposition mechanism in three mouth–throat models. Powder Technol. 378:724–35. doi:10.1016/j.powtec.2018.11.095.
- Inthavong, K., J. Tu, and C. Heschl. 2011. Micron particle deposition in the nasal cavity using the v2–f model. Comput. Fluid. 51 (1):184–8. doi:10.1016/j.compfluid.2011.08.013.
- Kharat, S. B., A. B. Deoghare, and K. M. Pandey. 2018. Development of human airways model for CFD analysis. Mater. Today: Proc. 5 (5):12920–6. doi:10.1016/j.matpr.2018.02.277.
- Koullapis, P. G., S. C. Kassinos, M. P. Bivolarova, and A. K. Melikov. 2016. Particle deposition in a realistic geometry of the human conducting airways: Effects of inlet velocity profile, inhalation flowrate and electrostatic charge. J. Biomech. 49 (11):2201–12. doi:10.1016/j.jbiomech.2015.11.029.
- Kourmatzis, A., S. Cheng, and H. K. Chan. 2018. Airway geometry, airway flow, and particle measurement methods: implications on pulmonary drug delivery. Expert Opin Drug Deliv. 15 (3):271–82. doi:10.1080/17425247.2018.1406917.
- Launder, B. E., and B. I. Sharma. 1974. Application of the energy-dissipation model of turbulence to the calculation of flow near a spinning disc. Letter Heat Mass Transf. 1 (2):131–7. doi:10.1016/0094-4548(74)90150-7.
- Lin, T.-C., P. N. Breysse, B. L. Laube, and D. L. Swift. 2001. Mouthpiece diameter affects deposition efficiency in cast models of the human oral airways. J Aeros Med. 14 (3):335–41. doi:10.1089/089426801316970295.
- Lindert, S., A. Below, and J. Breitkreutz. 2014. Performance of dry powder inhalers with single dosed capsules in preschool children and adults using improved upper airway models. Pharmaceutic. 6 (1):36–51. doi:10.3390/pharmaceutics6010036.
- López-Campos, J. L., W. Tan, and J. B. Soriano. 2016. Global burden of COPD. Respirology. 21 (1):14–23. doi:10.1111/resp.12660.
- Ma, B., A. Kourmatzis, Y. Zhao, R. Yang, H.-K. Chan, F. Salehi, and S. Cheng. 2020. Potential effects of lingual fats on airway flow dynamics and particle deposition. Aerosol Sci. Technol. 54 (3):321–31. doi:10.1080/02786826.2019.1696014.
- McRobbie, D. W., and S. E. Pritchard. 2005. Studies of the human oropharyngeal airspaces using magnetic resonance imaging. III. The effects of device resistance with forced maneuver and tidal breathing on upper airway geometry. J Aerosol Med. 18 (3):325–36. doi:10.1089/jam.2005.18.325.
- McRobbie, D. W., S. Pritchard, and R. A. Quest. 2003. Studies of the human oropharyngeal airspaces using magnetic resonance imaging. I. Validation of a three-dimensional mri method for producing ex vivo virtual and physical casts of the oropharyngeal airways during inspiration. J Aerosol Med. 16 (4):401–15. doi:10.1089/089426803772455668.
- Morgan, A. D., R. Zakeri, and J. K. Quint. 2018. Defining the relationship between COPD and CVD: what are the implications for clinical practice? Ther. Adv. Respir. Dis. 12:1753465817750524–doi:10.1177/1753465817750524.
- Nunes, C., A. M. Pereira, and M. Morais-Almeida. 2017. Asthma costs and social impact. Asthma Res Pract. 3 (1):1. doi:10.1186/s40733-016-0029-3.
- Pritchard, S. E., and D. W. McRobbie. 2004. Studies of the human oropharyngeal airspaces using magnetic resonance imaging. II. The use of three-dimensional gated mri to determine the influence of mouthpiece diameter and resistance of inhalation devices on the oropharyngeal airspace geometry. J Aerosol Med. 17 (4):310–24. doi:10.1089/jam.2004.17.310.
- Rahimi-Gorji, M., O. Pourmehran, M. Gorji-Bandpy, and T. B. Gorji. 2015. CFD simulation of airflow behavior and particle transport and deposition in different breathing conditions through the realistic model of human airways. J. Mol. Liq. 209:121–33. doi:10.1016/j.molliq.2015.05.031.
- Rahimi-Gorji, M., T. B. Gorji, and M. Gorji-Bandpy. 2016. Details of regional particle deposition and airflow structures in a realistic model of human tracheobronchial airways: two-phase flow simulation. Comput. Biol. Med. 74:1–17. doi:10.1016/j.compbiomed.2016.04.017.
- Remmers, J. E., W. J. deGroot, E. K. Sauerland, and A. M. Anch. 1978. Pathogenesis of upper airway occlusion during sleep. J. Appl. Physiol. Respir. Environ. Exerc. Physiol. 44 (6):931–8. doi:10.1152/jappl.1978.44.6.931.
- Si, X. A., J. Xi, J. Kim, Y. Zhou, and H. Zhong. 2013. Modeling of release position and ventilation effects on olfactory aerosol drug delivery. Respir. Physiol. Neurobiol. 186 (1):22–32. doi:10.1016/j.resp.2012.12.005.
- Song, B., Y. Li, J. Sun, Y. Qi, P. Li, Y. Li, and Z. Gu. 2019. Computational fluid dynamics simulation of changes in the morphology and airflow dynamics of the upper airways in OSAHS patients after treatment with oral appliances. PLoS ONE 14 (11):e0219642. doi:10.1371/journal.pone.0219642.
- Svartengren, K., M. Anderson, M. Svartengren, K. Philipson, and P. Camner. 1996. Oropharyngeal deposition of 3.5 microns particles inhaled through an elongated mouthpiece. Eur. Respir. J. 9 (7):1556–9.
- Tabe, R., R. Rafee, M. S. Valipour, and G. Ahmadi. 2022. Transition and Laminar flows in a realistic geometry of human upper airway. J. Mech. Med. Biol. 22 (1):2150070. doi:10.1142/S0219519421500706.
- Tu, J. K. Inthavong, and G. Ahmadi. 2012. Computational fluid and particle dynamics in the human respiratory system. Dordrecht, Netherlands: Springer Science & Business Media.doi:10.1007/978-94-007-4488-2.
- Wang, S., K. Inthavong, J. Wen, J. Tu, and C. Xue. 2009. Comparison of micron- and nanoparticle deposition patterns in a realistic human nasal cavity. Respir. Physiol. Neurobiol. 166 (3):142–51. doi:10.1016/j.resp.2009.02.014.
- Xi, J., and P. W. Longest. 2007. Transport and deposition of micro-aerosols in realistic and simplified models of the oral airway. Ann. Biomed. Eng. 35 (4):560–81. doi:10.1007/s10439-006-9245-y.
- Xi, J., J. Kim, X. A. Si, and Y. Zhou. 2013. Hygroscopic aerosol deposition in the human upper respiratory tract under various thermo-humidity conditions. J Environ Sci Health A Tox Hazard Subst Environ Eng. 48 (14):1790–805. doi:10.1080/10934529.2013.823333.
- Xiroudaki, S., A. Schoubben, S. Giovagnoli, and D. M. Rekkas. 2021. Dry powder inhalers in the digitalization era: Current status and future perspectives. Pharmaceutic. 13 (9):1455. doi:10.3390/pharmaceutics13091455.
- Yang, M. Y., J. G. Y. Chan, and H.-K. Chan. 2014. Pulmonary drug delivery by powder aerosols. J Control Release. 193:228–40. doi:10.1016/j.jconrel.2014.04.055.
- Yang, M. Y., J. Verschuer, Y. Shi, Y. Song, A. Katsifis, S. Eberl, K. Wong, J. D. Brannan, W. Cai, W. H. Finlay, et al. 2016. The effect of device resistance and inhalation flow rate on the lung deposition of orally inhaled mannitol dry powder. Int. J. Pharm. 513 (1-2):294–301. doi:10.1016/j.ijpharm.2016.09.047.
- Zhang, Z., C. Kleinstreuer, and C. S. Kim. 2002. Micro-particle transport and deposition in a human oral airway model. J. Aerosol Sci. 33 (12):1635–52. doi:10.1016/S0021-8502(02)00122-2.
- Zhao, Y., J. Raco, A. Kourmatzis, S. Diasinos, H.-K. Chan, R. Yang, and S. Cheng. 2020. The effects of upper airway tissue motion on airflow dynamics. J. Biomech. 99:109506. doi:10.1016/j.jbiomech.2019.109506.
- Zhou, Y., J. Sun, and Y.-S. Cheng. 2011. Comparison of deposition in the USP and physical mouth-throat models with solid and liquid particles. J Aerosol Med Pulm Drug Deliv. 24 (6):277–84. doi:10.1089/jamp.2011.0882.
- Zwartz, G. J., and R. A. Guilmette. 2001. Effect of flow rate on particle deposition in a replica of a human nasal airway. Inhal. Toxicol. 13 (2):109–27. doi:10.1080/089583701300001050.