
 ?Mathematical formulae have been encoded as MathML and are displayed in this HTML version using MathJax in order to improve their display. Uncheck the box to turn MathJax off. This feature requires Javascript. Click on a formula to zoom.
Abstract
A model flow reactor provides a narrow particle temperature-residence time distribution with well-defined conditions and is mandatory to measure changes of the particle structure precisely. The experimental data of iron and iron oxide agglomerates are used to determine the sintering kinetics considering the temperature-time history of the particles. Thousand particle trajectories are tracked in a validated CFD model at three different furnace temperatures each. Strongly agglomerated particles with a small primary particle size (∼4 nm) are synthesized by spark discharge and are size-selected (25–250 nm) before sintering. The structure development is measured simultaneously with different online instrumentations and the structure calculated by means of structure models. A simple sintering model, based on the reduction of surface energy, is numerically quantified with the experimental results. The surface of the particles is strongly dependent on the primary particle size and the agglomerate structure. The chemical phase is analyzed using the offline techniques XANES, XRD, and EELS. It is observed that the addition of hydrogen led to a reduction of iron oxide to iron nanoparticles and to changes of the sintering kinetics. The sintering exponent = 1 was found to be optimal. For Fe, an activation energy
of 59.15 kJ/mol and a pre-exponential factor
of 1.57 104 s/m were found, for Fe3O4 an activation energy
of 55.22 kJ/mol and a pre-exponential factor
of 2.54 104 s/m.
Copyright © 2022 American Association for Aerosol Research
EDITOR:
Introduction
The synthesis of functionalized particles with defined structures and material properties is challenging due to rapidly and simultaneously occurring mechanisms, such as chemical reactions, surface growth, coagulation, condensation, and sintering (Pratsinis Citation1988). Besides coagulation, sintering is one of the most important mechanisms that determine particle morphology but also one of the most complex mechanisms (German, Citation1996). It is dependent on various particle properties (e.g., size, shape, agglomerate structure), on material properties as well as on the process conditions, especially the temperature-time history of the particles. Sintering models can be used to describe the sintering process as a function of characteristic values, and thus contribute to a better understanding.
The sintering process can be investigated by different methods. Using imaging techniques, individual macroscopic particles/objects can be precisely examined. For this purpose, the objects are heated in a controlled atmosphere at different temperatures and time periods and structural changes (e.g., shrinkage, growth of sintering necks) are documented (Kuczynski Citation1949). This method was used by Matsumura (Citation1971) to study the sintering mechanism and diffusion coefficient of iron wires. He found an activation energy of 242 kJ/mol and concluded that the predominant sintering mechanism for iron is dependent on the temperature as well as on the ratio of the neck and particle radii. Mikami, Kamiya, and Horio (Citation1996) and Knight et al. (Citation2000) used a fluidized bed with iron powder (reduced steel shot powder) to investigate the mechanism of de-fluidization and particle-to-particle neck growth. They determined an activation energy of 221 kJ/mol by assuming surface diffusion for particles sizes of 200 μm. The sintering mechanism of two submicron iron oxide (Fe3O4) powders at low temperature (773–843 K) was examined by Kramer and German (Citation1978) with offline measurement techniques, like scanning electron microscopy, gas adsorption, and X-ray diffraction. They identified surface diffusion as the dominant sintering transport mechanism by the linear dependence of the logarithmic reduction of the specific surface area on time.
The use of these earlier kinetic data in sintering models of aerosol reactors is questionable due to the different size and temperature ranges. Also, small differences in the environment or the morphology of the structure to be sintered can strongly influence the sintering process. Therefore, reliable kinetic data are necessary when applying sintering models for aerosol reactor optimization (Kruis et al. Citation1993). The determination of precise kinetic data by using experimental data from a complex aerosol reactor, in which different processes take place simultaneously, is difficult. Therefore, the mechanisms have to be isolated from each other and well-defined conditions have to be provided. Model flow reactors (MFR) are designed to provide a well-defined particle temperature-time history and to exclude undesired processes by controlling the number concentration and the monodispersity of the aerosol. The probability of agglomerate formation by coagulation can be avoided by using a low number concentration. Kirchhof et al. (Citation2012) designed a MFR to study the sintering kinetics of silica nanodoublets, i.e., two connected spherical primary particles, as function of different primary particle sizes in the temperature range 1533–1873 K with residence times from 3.7 ms to 130 ms. A turbulent flow field was used to achieve a nearly constant temperature in the reaction zone and to characterize the structural change of the nanodoublets by offline TEM analysis. A less tedious measurement of the structure development was carried out by Cho, Hogan, and Biswas (Citation2007). They measured the sintering of polystyrene latex (PSL) agglomerates at different temperatures and residence times online with a tandem differential mobility analyzer (DMA) setup. A reasonable agreement with the sintering model of Koch and Friedlander (Citation1990) was demonstrated.
In this work, the sintering of FexOy-NPs is studied in a model flow reactor previously developed (Rosenberger et al. Citation2020). Iron or iron oxide agglomerates are synthesized in the size range from 25 to 250 nm by spark discharge, size-selected by means of a DMA and sintered having a well-defined temperature-time history. A CFD model is validated and used to calculate the particle trajectories in the sintering zone for different furnace temperatures and thereby provide the necessary temperature-time histories. Online instrumentation is used to monitor the changes of the mobility diameter, Stokes diameter and particle mass during the sintering process. The change of the chemical phase from iron oxide to iron by the addition of hydrogen during sintering is analyzed by electron energy loss spectroscopy (EELS) and X-ray absorption near edge structure (XANES) measurements. The sintering kinetics is determined applying different furnace temperatures and initial agglomerate sizes, with the number of primary particles per agglomerate up to a few thousand.
Theory
Determining the particle structure
It is necessary to characterize the initial particle structure to determine structural changes. An aerosol generated by spark discharge is strongly agglomerated containing a large number of small primary particles due to the steep temperature gradient after the spark pulse. The structure of the agglomerates can be described by the fractal dimension together with the primary particle size. Here, the fractal dimension is expressed by the mass–mobility exponent (Kim et al. Citation2009; Scheckman, McMurry, and Pratsinis Citation2009) which ranges from 1.8 to 2.9 for an open structured agglomerate generated by diffusion-limited (DLCA, Kolb and Herrmann Citation1987) or by ballistic cluster–cluster agglomeration (BCCA, Tence, Chevalier, and Jullien Citation1986).
is defined by EquationEquation (1)
(1)
(1) (Park, Kittelson, and McMurry Citation2004) and can be determined by a linear fit of the logarithm of particle mass
as function of the logarithm of mobility diameter
It is assumed that the fractal prefactor
is constant and the primary particle diameter
does not change over the size range.
(1)
(1)
The primary particle diameter can then be determined by applying the structure model by Eggersdorfer et al. (Citation2012), leading to EquationEquation (2)
(2)
(2) (Rosenberger et al. Citation2018).
(2)
(2)
The agglomerate structure descriptive parameters = 0.99 and
= 1.082 are independent of the sintering mechanism and remain constant during sintering (Eggersdorfer and Pratsinis Citation2013).
The effective density is found from the mobility diameter
and the particle mass
respectively the bulk density
from the ratio of the mass to the volume of a full sintered sphere, EquationEquation (3)
(3)
(3) .
(3)
(3)
An alternative method for determining primary particle size that is less dependent on the charge state and more sensitive to particle structure is based on the comparison of the Stokes diameter with the mobility diameter
The DAPS measurements used here are based on aerodynamic focusing of a narrow size fraction, generated by the classification with respect to relaxation time (Babick et al. Citation2018). The measured value by the DAPS is the aerodynamic diameter
in the free-molecular regime which can be expressed as the Stokes diameter
with the standard-density
= 1 g/cm³ (DeCarlo et al. Citation2004). Measuring a narrow particle size distribution simultaneously with the DAPS and SMPS allows the determination of
by adapting the number weighted Stokes diameter distribution
to the number weighted mobility diameter distribution
The mass–mobility exponent can then be calculated from the ratio of the effective density to the bulk,
(Goudeli, Gröhn, and Pratsinis Citation2016) and finally the primary particle diameter
by EquationEquation (4)
(4)
(4) , introduced by Stein, Kiesler, and Kruis (Citation2013).
(4)
(4)
Model to determine the sintering kinetics
The sintering kinetics of the structure-forming mechanisms is determined using the sintering model of Koch and Friedlander (Citation1990), which poses that the change of the surface area as function of time of a single agglomerate is proportional to the deviation from the surface area of the same coalesced particle
as shown in EquationEquation (5)
(5)
(5) .
(5)
(5)
The surface area is calculated by for an agglomerate consisting of
primary particles with the constant primary particle surface area. The driving force for the coalescence is the reduction in surface energy. The proportionality factor
is defined as the inverse of the characteristic sintering time (Friedlander and Wu Citation1994). According to the Arrhenius type expression, the characteristic sintering time is a function of the temperature of the particles
and activation energy
as well as the pre-exponential factors
and
to the power of
EquationEquation (6)
(6)
(6) .
(6)
(6)
The exponent describes the dominant transport mechanism of the sintering process. The sintering mechanism, such as grain boundary diffusion, surface diffusion or volume diffusion, strongly influences the kinetics and is usually not precisely known or changes with temperature. For the specific case of sintering of iron particles, one report suggests the surface or grain boundary diffusion mechanism (
= 4) to be dominant at temperatures below 1323 K (Mikami, Kamiya, and Horio Citation1996).
Since the activation energy and the pre-exponential factor might not be independent from each other and will depend on the sintering mechanism, a global minimum from the combination of all three parameters is searched for in order to determine the sintering kinetics. The mathematical problem can be simplified by assuming a dominant sintering mechanism (i.e., exponent ) and obtaining the best fitting combination of
and
by error minimization between experiment and sintering model, EquationEquations (5)–(7). The numerical solution by a MATLAB routine (Version 2020a, MathWorks, Natick, MA, USA) is based on the Nelder-Mead simplex algorithm for solving strictly convex functions with two dimensions (Lagarias et al. Citation1998). EquationEquation (5)
(5)
(5) is solved by integration with a variable step size and variable order (VSVO) solver, based on the numerical differentiation formulas (NDFs), and calculates the evolution of the surface area according to the temperature-time history and combination of
and
The quality of the determined kinetic parameters is evaluated by comparing the measured primary particle size
and the calculated particle size
considering the temperature-time histories for a given combination of
and
The
is defined as the sum of the quadratic errors of the primary particle diameter and is normalized by
EquationEquation (7)
(7)
(7) .
(7)
(7)
Experimental setup
The setup used for the sintering experiments is depicted in and consists of three main parts: (a) the particle synthesis, which provides defined particle structures (e.g., size-selected agglomerates), (b) the model flow reactor used to induce the structure formation of aerosol particles under well-defined conditions, and (c) the characterization of the particles with online and offline instrumentation. A detailed description of this setup with design of the MFR is described in our previous work (Rosenberger et al. Citation2020).
Figure 1. Experimental setup for determining the sintering kinetics: (a) the particle synthesis, which provides defined particle structures, (b) the model flow reactor (MFR) to induce structure formation of aerosol particles under well-defined conditions, and c) characterization of the particles with online and offline instrumentation.
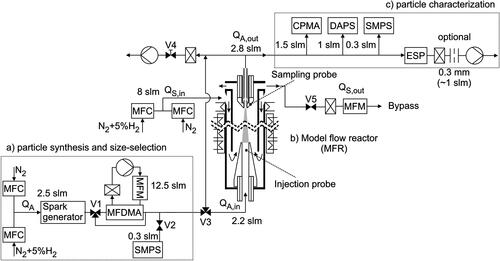
Two mass flow controllers (MFC, EL-FLOW Select, Bronkhorst High-Tech B.V., Ruurlo, NL) are used to provide a gas mixture of purified nitrogen and up to 5 vol% hydrogen. The gas purification system is a combination of an adsorber (ALPHAGAZ Purifier O2-Free Air, Liquide Deutschland GmbH, Frankfurt, DE) and a getter (Mono Torr Phase II purifier, SAES Getters Deutschland GmbH). It is used to increase the gas purity (better than 5.0) and to remove oxygen contamination. The second MFC is connected to a gas bottle (ARCAL F5, Air Liquide) filled with compressed hydrogen (5 vol%) in nitrogen. A gas with a total flow rate of 2.5 slm enters through Swagelok tubes into a custom-built spark generator where iron oxide agglomerates with a small primary particle size are formed by spark discharge (Schwyn, Garwin, and Schmidt-Ott Citation1988). The charge current of the 28 capacitors (each having a capacitance of 1 nF) is set to 5 mA when nitrogen or 1 vol% H2 is used and 10 mA with 5 vol% H2. A broad particle size distribution (PSD) based on mobility diameter is obtained, with a geometric mean diameter around 100 nm and standard deviation of 1.6. The breakdown voltage (approx. 4 kV) is kept constant and can be controlled by the gap distance between two Ø5 mm iron rod electrodes (CAS 7439-89-6, Alfa Aesar by Thermo Fisher GmbH, Kandel, DE). The spark discharge energy is directly proportional to the capacitance, increasing it leads to an increase of the particle concentration and to growth of the modal diameter (Tabrizi et al. Citation2009). A monomobile size fraction of the aerosol is provided by a custom-built DMA which can handle larger flow rates due to its larger size (Medium Flow-DMA/MF-DMA, Rosenberger et al. Citation2019) or remains polydisperse when bypassing it by using valve V1. Agglomerates are not neutralized before the mobility selection and show multiple charges as a result from the spark discharge. A recirculation pump provides a constant sheath and exhaust gas flow through the DMA. A first SMPS is connected via a valve V2 downstream of the MF-DMA and samples a flow of 0.3 slm in order to measure the PSD before the particle laden gas enters the MFR. The valve V3 can be used to bypass the MFR. The total sheath gas flow rate
of the MFR is set constant to 8 slm by two MFCs. The sheath gas mixture corresponds to the aerosol
The sheath exhaust is connected to a valve V5, a HEPA-filter and a mass flow meter (MFM, 4041 TSI) to the bypass. The mass flow rate of the exhaust is measured to check whether it is equal to
with
= 2.2 slm and
= 7.4 slm. The flow rate
of 2.8 slm is sampled from the MFR by the online instrumentation: 0.3 slm by the SMPS (3936, TSI, Minneapolis, US), 1.0 slm by the differential aerodynamic particle sizer (DAPS) (Babick et al. Citation2018) and 1.5 slm by the centrifugal particle mass analyzer (CPMA Mk1, Cambustion Ltd., Cambridge, UK). An electrostatic precipitator (ESP) can be used to sample particles on a substrate, such as a TEM grid, for offline analysis. For sampling, the pump of the DAPS is turned off and the aerosol is drawn in by a critical orifice upstream of a HEPA-filter and external pump of the ESP. The diameter of the critical orifice of 0.3 mm limits the mass flow to approx. 1 slm, so that SMPS and CPMA can be used simultaneously without changing the sample flow rate as compared to previous measurements. The needle valve V4 with HEPA-filter and vacuum pump are used to keep the sample flow rate through the MFR constant when the online instrumentation is not in use.
The model flow reactor uses a wire-wound tube furnace (TZF 12/75/700, Carbolite Gero GmbH & Co. KG, Neuhausen, DE), modified for vertical application. The working tube consists of a coaxial arrangement of two ceramic tubes and water-cooled injection (bottom) and sampling probes (top) projecting into the heating zone. The ceramic tube ends are connected to the probes with vacuum-tight adapters applying DN-63 CF standard components. The aerosol enters the reaction zone through the injection probe at room temperature ( = 300 K) and is drawn in and cooled down by the sample probe at the upper end. In a laminar flow field, the particle trajectories starting from the inlet and ending in the outlet are almost straight and lead to a conical reaction zone with a volume of Ø10 to Ø6x750 mm, indicated by the gray-colored area. In addition, a preheated sheath gas stabilizes and heats up the cold aerosol on the radial centerline. The sheath gas enters at the upper end of the MFR, between the outer and inner ceramic tube, and flows downwards through the heated zone of the furnace. It can be seen that the inner ceramic tube is slightly shorter than the outer tube and hangs freely at the lower end. This allows the sheath gas to be redirected below the injection probe tip and to flow upwards with the aerosol to the exhaust, respectively to sample outlet. The sample flow can be quenched at the probe tip by flowing a dilution gas through the annular space between the water cooling and sampling pipe at the sample probe. However, the dilution gas in combination with the water cooling leads to significant thermophoretic losses. Particle deposits and a significant decrease in a particle concentration was observed, which enhances the statistical uncertainties, in some cases even the detection limit of the instrumentation was reached. Therefore, no quenching gas was used and the temperature of the water cooling was raised to constant 300 K.
Preliminary investigations
CFD simulation
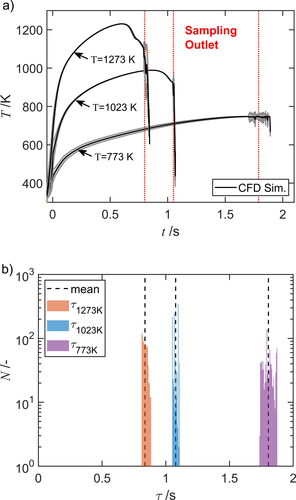
Knowledge of the temperature-time history of the particles during sintering is essential to determine precise sintering kinetics from the experimental data. In our previous work (Rosenberger et al. Citation2020), we introduced and validated a CFD simulation against experiments. The CFD simulations were performed using a two-dimensional, axial symmetric grid, where a mesh for the reactor walls was added with the objective to resolve the heat flux directly. Here, the resulting temperatures from previous simulations were used as boundary conditions for a three-dimensional simulation in which single-particle trajectories were calculated. From these trajectories, times
and temperatures
histories of individual particles could then be extracted and combined into mean profiles. The simulations were performed on a three-dimensional grid using OpenFOAM (v.2.1). The flow field is assumed to be non-reactive and laminar (
≤ 364), and the Navier-Stokes equations were solved in the Eulererian frame, while the particle trajectories were calculated in the Lagrangian frame. Three different simulations were performed for N2 as carrier gas, for furnace temperatures of 773 K, 1023 K, and 1273 K.
The trajectories are computed by numerically tracking particles injected at the inlet. The particles are transported passively in the flow field, except for the drift due to thermophoresis. The thermophoretic velocity is calculated applying an extended Waldmann equation (Li and Wang Citation2004). Brownian motion is neglected assuming small particle diffusivity in respect to the thermophoretic drift.
In each simulation, 1000 particles were released at the inlet, randomly distributed over the radius ( < 5 mm) of the aerosol inlet tube (
= 0.2 m). After traveling through the domain, they were then either collected by the sampling probe (at
= 1.05 m), or they left the domain through the outlet. In the latter case, the particle time history was withdrawn and not considered for the analysis. To capture the reaction zone, the trajectories start 40 mm upstream and end 60 mm downstream from the reaction zone. Whereas the residence time
is defined as the time, in which the particles reach the sampling probe after passing the axial position
> 0.24 m (
= 0)
depicts the mean temperature-time history of the particle trajectories and the residence time distribution as function of the furnace temperatures 773 K, 1023 K and 1273 K. The mean
of the particle trajectories resulting from CFD simulations at the three furnace temperatures are marked by solid lines with the standard deviation in the gray areas. The intermediate temperature-time histories are determined by linear interpolation, shown and described in the Supplementary Information S2. It can be seen that the temperature of the particles increases and the total residence time shortens with rising furnace temperature. Whereas the gas mass flow rate is kept constant, an increase in temperature results in an expansion of the gas volume and thereby to a higher gas velocity, thus to a shorter residence time. A plateau of the particle temperature as function of time is not reached and a slight slope is always noticeable. The slope is steeper at high furnace temperatures due to the higher temperature gradient and the shorter residence times in the reaction zone. The significant temperature gradients at
and
are due to the water-cooled injection and sample probe. Kirchhof, Schmid, and Peukert (Citation2004) achieved an almost constant temperature in the reaction zone by turbulent mixing of the cold aerosol with the preheated sheath gas but at the disadvantage of a broadener residence time distribution. shows that the particle trajectories have little residence time scatter and are narrowly distributed. The mean absolute deviation is 15 ms at 1273 K, 18 ms at 1073 K, and broadens to 31 ms at the lowest furnace temperature 773 K.
Figure 2. (a) Mean temperature-time history and (b) residence time distribution
for a number of trajectories
at three different furnace temperatures. Solid lines indicate the mean calculated from CFD simulation for furnace temperatures of 773 K, 1023 K, and 1273 K. The standard deviation of
in (a) is shown as gray area.
Offline investigation of the chemical phases
XRD analysis
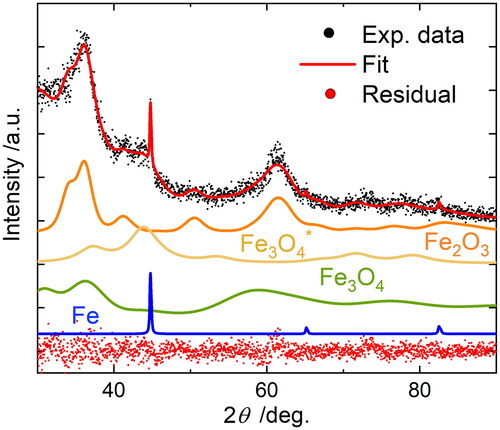
A first indication of the synthesized particle structure and phase composition can be obtained by X-ray diffraction (XRD). The powder for the analysis has been sampled from the spark generator housing after several hours of synthesis at constant conditions in nitrogen. It is used for the analysis which are found directly in the reactor before further processing. It is analyzed by XRD using a diffractometer equipped with Ni-filtered copper Kα radiation (X’pert Pro, PANalytical B.V., Almelo, NL). Alteration of the sample due to the exposure to oxygen cannot be excluded, so the crystallographic data may not be fully representative for the sintered nanoparticles. The powder is pressed into a powder holder for the measurement. depicts the X-ray diffractogram of the powder with individually contributing components weighted according to the refined phase composition. The analysis was performed with the reference crystal structures (ICSD Fe2O3 15840 (Blake et al. Citation1966), Fe3O4 26410 (Fleet Citation1981), Fe3O4* 50271 (Okudera Citation1997) and α-Fe 53802 (Hull Citation1917)) and Rietveld refinement using the software MAUD (Lutterotti Citation2010). The adaption of the reference data is challenging due to the low signal-to-noise ratio. It is assumed that the crystal structures of the sample consist mainly of the elements iron (Fe) and oxygen (O). A good agreement with the experimental data (Rwp = 8.74%) is achieved by adapting the crystalline phases magnetite Fe3O4 (68 wt.%), hematite Fe2O3 (31 wt.%) and α-iron Fe (1 wt.%). The large amount of the crystal phase magnetite and hematite is a result of the ultrafine primary particles and the fast oxidation of iron due to the large specific particle surface. The crystallite size for hematite is 7.2 ± 1.3 nm. For the magnetite phase two different crystallite sizes are obtained, 41.2 wt.% of a non-stoichiometric magnetite (Fe2.96O4) with 2.5 ± 0.2 nm and 26.8 wt.% with 6.3 ± 0.4 nm. All oxide phase crystallites were also found to have relatively high microstrain, 0.015 ± 0.001 for hematite, 0.002 ± 0.001 for the larger fraction of magnetite and 0.047 ± 0.003 for the smaller fraction. This can be attributed to the small size of the nanoparticles as well as to the method used to generate them. The metallic iron phase is present in form of micron-sized particles (>1 µm), indicated by the large and narrow reflection at = 45° in the diffractogram, which can be formed by splashing of molten material from the cathode surface during the spark discharge (Hontañón et al. Citation2013).
Figure 3. Rietveld refinement of Cu-K XRD data of a powder sampled from the spark generator housing after several hours of synthesis in pure nitrogen. Diffractograms for the separate phases magnetite Fe3O4 (27 wt.%), iron-deficient magnetite Fe3O4* (41 wt.%), hematite Fe2O3 (31 wt.%), and iron Fe (1 wt.%) as refined together with original data, total refined profile (fit) and residual (difference between data and refinement) are displayed.
XRD analysis provided no clear indication if pure iron nanoparticles can be synthesized in a nitrogen atmosphere. The high amount of iron oxide particles suggests that the particles are completely oxidized during synthesis or sampling. A higher amount of metallic iron can be obtained by adding a reducing agent to the particle generation process. Hallberg et al. (Citation2018) investigated the production of single crystalline and non-oxidized metal nanoparticles in a spark discharge. The addition of 5 vol% hydrogen to the nitrogen carrier gas as reducing agent already during particle generation prevents the formation of the oxide phase and thus improves the sintering properties of the nanoparticles, forming compact and monocrystalline metals. Furthermore, the addition of hydrogen during sintering leads to a reduction of the oxide phase (Seipenbusch et al. Citation2003). Therefore, the particles in this work are synthesized and sintered in purified nitrogen, in 1 vol% H2 and 5 vol%°H2 in nitrogen to investigate the sintering kinetics of iron and iron oxide nanoparticles.
XANES and EELS analysis
The investigation of the chemical composition of the sintered particles is difficult due to the low number concentration and the rapid oxidation of pure iron when exposed to air. Two different offline techniques, (I) X-ray absorption fine structure (XAFS) at the near-edge (XANES) and (II) transmission electron microscopy (TEM) with electron energy loss spectroscopy (EELS), are used to analyze the chemical composition and phase. A representative sample is taken by electrostatic precipitation (ESP) under the specific process gas environment (purified N2, 1 vol% H2 or 5 vol%°H2 in N2). A constant sample flow rate of 1 slm is ensured by a critical orifice downstream of the ESP. The suction gas flow rate from the MFR of 2.8 slm is kept unchanged to the sintering experiments by switching off the pump of the DAPS. The suction gas flow rate is then divided over SMPS (0.3 slm), CPMA (1.5 slm), and ESP (1 slm). The coverage of particles on the substrate is controlled by the deposition voltage and time. After sampling, the ESP is sealed gas-tight and transferred to a nitrogen glove box, where the sample is prepared for analysis and packed for transport. Sampling, preparation and analysis are carried out promptly to avoid reaction of the sample.
XANES measurements at the iron K-edge (7112 eV) are performed with a Si-passivated implanted planar silicon (Si-PIPS) single-channel fluorescence detector at the P65 beamline (PETRA III, Deutsches Elektronen-Synchrotron DESY, Germany). The energy resolution at the iron absorption edge of the P65 beamline with the beamline optics is about 0.99 eV. The XANES analysis requires a high degree of substrate coverage for an adequate signal. This could only be achieved within a deposition time of about ∼24 h by sampling a polydisperse aerosol and applying a high voltage of −8 kV to the ESP. The high electric field together with the slow gas velocity tangential to the substrate surface creates a small deposition spot of positively charged particles. The particles are deposited between two polyimide foils (Kapton, DuPont de Nemours Inc., Wilmington, DE, USA) with a thickness of 25 μm each. The films are adhered together in an inert gas atmosphere to avoid altering of the sample.
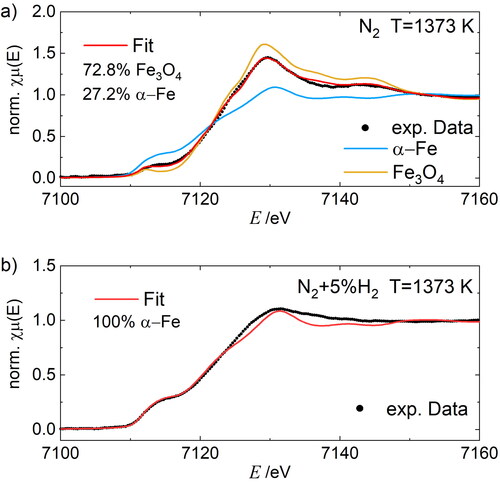
depicts the XANES spectra at the Fe-K edge of the polydisperse samples after sintering at 1373 K in pure nitrogen and in 5 vol% hydrogen in nitrogen. The highest operation temperature of the MFR was used to ensure spherical particles with bulk density. The spectra were analyzed using linear combination fitting (LCF) with Fe, FeO, Fe3O4, and Fe2O3 standards and the red lines represent best fit combinations. The experimental data are indicated by black dots and the corresponding reference data are marked in color. Iron foil (25 µm, 99,99+ %; Goodfellow GmbH, Hamburg, DE) and Fe3O4 powder in starch (Alfa Aesar, Thermo Fisher Scientific GmbH, Kandel, DE) are used as reference standards. In case of the oxide samples the iron foil is used as internal standard to calibrate the energy scale. Data were also fitted using pseudo-voigt function for the pre-edge and white line features and a step function for the edge. Comparing both spectra, it can be seen that the white line of the K-edge occurs at about 7130.2 ± 0.3 eV in both cases, however, the peak intensity of the Fe phase is smaller. The pre-edge can be described in the form of a shoulder in both cases with a higher intensity in the N2+5%H2 atmosphere. Fe3O4 shows a pre-edge peak of lower intensity well separated in front of the absorption edge and therefore cannot be considered as the only phase for N2 atmosphere. A significant shift of the pre-edge (7114.3 ± 0.5 eV) due to iron oxidation state Fe3+ or Fe2+ is not observed. Nevertheless, a shift in the K-edge step from 7120.2 ± 0.3 in the case of N2+5%H2 atmosphere to 7122.6 ± 0.3 in the case of pure N2 atmosphere. This so-called chemical energy shift is an indicator of the increase in the valence of iron in the corresponding sample (Zhao et al. Citation1993) and is in good agreement with the LCF fit results. Differences in intensity and shape are also observed. The LCF fitting of the samples with standards resulted in a best fit for N2+5%H2 atmosphere using pure α-iron and in N2 for the 72.8% magnetite phase and 27.2% iron. Minor deviations between the Fe reference and sample in pure N2+5%H2 may be due to the nano scaled morphology of the samples which may also lead to crystallographic defects and thus a broadening of the features compared to the standard, a bulk metallic foil. The deviations of the N2 atmospheric sample can also be attributed to the crystallographic defects, Fe2+/Fe3+ ratio and the vacancy distribution or due to the small size of the particles (Krishnan Citation1990).
Figure 4. LCF fitting of the Fe-K edge XANES spectra of polydisperse FexOy nanoparticles after sintering at 1373 K (black line) in purified nitrogen (N2) (a) and reducing gas mixture of nitrogen and hydrogen (95 vol% N2+5 vol% H2) (b) with corresponding Fe and Fe3O4 references.
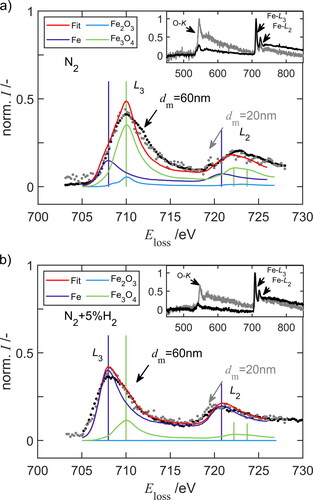
An examination of single particles is performed with TEM (2200FS, JEOL GmbH, Freising, DE) and the analysis of the electron energy loss spectra (EELS) in cooperation with the ICAN (Interdisciplinary Center for Analytics on the Nanoscale, Duisburg, Germany). Agglomeration on the substrate is prevented by keeping the particle coverage low in order to study the particle morphology and the chemical composition resulting from the sintering. A monodisperse aerosol is precipitated for about 10 min on TEM copper grids covered with a lacey carbon film. A voltage of 95 V or 1570 V is applied to the MF-DMA for classifying agglomerates with a mobility diameter of 30 nm or 145 nm, respectively. After sintering in pure nitrogen or 5 vol% hydrogen in nitrogen at the highest temperature of 1373 K, the particles show a spherical structure with a diameter of 20 nm, and 60 nm, respectively.
shows the EEL spectra of spherical FexOy nanoparticles after sintering at 1373 K with a diameter of 20 nm and 60 nm in (a) purified nitrogen or (b) in 5 vol% hydrogen in nitrogen. The backgrounds of the EEL spectra are removed by adapting a power law equation. The oxygen O K-edge, and iron Fe L3, and Fe L2-edges are marked with arrows according to literature (Feldhoff et al. Citation2009). It is difficult to distinguish between the different iron species because the general spectral shapes are almost similar for Fe0, Fe2+ and Fe3+. All these spectra show a main peak at around 708–710 eV (L3) and a less intense peak at 721–723 eV (L2) and do not differ significantly in terms of energy. The iron spectra with higher oxidation state are more shifted to higher energy and show a broadened L2 peak. Hematite (Fe2O3) shows an energetically lower shoulder in relation to magnetite (Fe3O4) and differs in the peak intensity at = 722 eV and
= 724 eV. The reference phases iron (Fe), hematite (Fe2O3) and magnetite (Fe3O4) from EELS Database (Ewels et al. Citation2016) are initialized by 30% each and adapted to the spectra. According to previous XANES analysis, it is assumed that the phase maghemite (γ-Fe2O3) is not present in this sample and only forms when the sample is exposed to an oxygen-rich atmosphere. The maximum L3 and L2 line of the reference is observed at an energy about 1.8 ± 0.1 eV lower than that of the sample. It can be seen that the spectra of 20 nm and 60 nm particles do not differ much and that magnetite (59%) is the dominant phase in pure nitrogen and iron (87%) in 5 vol% H2 in N2. The hematite phase content is in all measurements less than 1%. The fitting procedure is strongly dependent on the background removal and the determined energy shift. Even better agreement to previous XANES measurements is achieved by fitting a higher proportion of magnetite phase to the spectra in . Regarding the O-K absorption edge, it is observed that the intensity ratio of the O-K and Fe-L3 peak increases with decreasing particle diameter. Adding hydrogen reduces this ratio and leads to a higher iron content which is also observed in the XANES analysis.
Figure 5. Electron energy loss spectra (EELS) of spherical FexOy nanoparticles after sintering at 1373 K with a diameter of 20 nm and 60 nm (a) in purified nitrogen and (b) in 5 vol% hydrogen.
Results and discussion
Online measurement of particle morphology changes during sintering of Fe and FexOy
A monodisperse aerosol is provided by selecting a mobility diameter between 25 nm and 250 nm via the MF-DMA downstream of the spark synthesis. A logarithmic distributed voltage ranging from 30 V to 3 kV is applied to the DMA with a sheath gas flow rate of 12.5 l⋅min−1. The combination of the different online instrumentation allows the prompt measurement of different particle properties and the determination of the particle morphology. The particle structure can be described by different parameters, such as the effective density and fractal dimension (Tavakoli and Olfert Citation2014) which allows to determine the diameter of the primary particles and number of particles per agglomerate.
The particle mass and diameter distribution of the size-selected aerosol is measured for 20 different mobility diameters at room temperature downstream of the MF-DMA with a CPMA and an SMPS. The particle mass measured with the CPMA is corrected with the mass correction function (S1) introduced by Liao et al. (Citation2019). The doubly charged agglomerates lead to a bimodal PSD containing two maxima at a selected size (±1 charge) and in lower concentration (not more than 20%) at a larger particle diameter (±2 charges). Determining the mass-mobility exponent with EquationEquation (1)(1)
(1) by linear fits of the log modal particle mass as function of the log modal mobility particle diameter over the size range 25–250 nm for the three gas compositions, pure nitrogen, 1 vol% hydrogen, and 5 vol% hydrogen in nitrogen, leads to an almost constant
of 2.2 ± 0.03 which is in good agreement with theory for open structured agglomerates. The primary particle diameter is determined by different methods, as it is essential for the calculation of the sintering kinetics.
The two methods applied to the experimental data described above result in a primary particle diameter of 4 nm ± 0.5 for pure nitrogen. In our previous work (Rosenberger et al. Citation2020), we reached the lower detection limit of the DAPS, so that the mode value of the particle size distribution could not be measured. This led to an overestimation of (7.5 nm instead of 4 nm) during the fit procedure from
to
with help of the effective density. Therefore, the sheath gas of the DAPS was changed from nitrogen to helium, thereby shifting the measuring range toward smaller particle diameters.
An alternative method for determining the primary particle diameter is the Brunauer-Emmett-Teller (BET) method. The sampled powder for XRD analysis is also used for the BET analysis (Gemini VII, Micromeritics GmbH, Aachen, Germany). The measurement of the adsorbed gas volume allows to determine the BET-equivalent diameter from the specific surface area (SSA) by assuming spherical primary particles in an open agglomerate structure, EquationEquation (8)
(8)
(8) . The SSA is defined as the surface area per unit mass of the powder.
(8)
(8)
with the surface area of a single adsorbed gas molecule
the molar volume of the adsorbate
the bulk density of the particles
the volume of the adsorbate required for monolayer coverage on unit mass of the particle and the Avogadro constant
As it is surface-based,
can be seen as an estimation of the primary particle diameter. For pure iron particles with a density of 7.874 g/cm³ the diameter is about 4 nm and for iron oxide particle with a density of 5.2 g/cm³ approx. 6 nm. This is in excellent agreement with the primary particle diameter determined from the online measurements.
The size-selected agglomerates are injected in the reaction zone and are sintered at fixed temperatures, as set by the MFR parameters. The effective density is calculated from the particle mass (CPMA) and mobility diameter (SMPS), using EquationEquation (3)(3)
(3) . The primary particle diameter is determined from combined SMPS and DAPS measurement, applying EquationEquation (4)
(4)
(4) . depict the effective density
and the primary particle diameter
as function of the mobility diameter
at various furnace temperatures, indicated by colored symbols. The effective density and primary particle size of fully sintered particles is indicated by a dashed line. The slope of the dashed line is a result of the sphericity of the particles, and can be expressed in the mass-mobility exponent
Figure 6. (a) and (c) Effective density and (b) and (d) primary particle diameter
as function of the mobility diameter
for different furnace temperatures in (a) and (b) N2 and (c) and (d) in N2+5%H2.
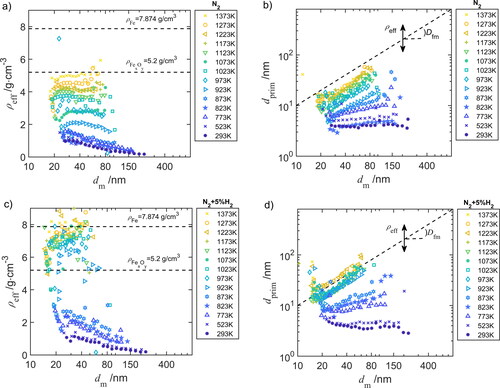
Observing and
down- and upstream of the MFR, a change in structure cannot be detected when the MFR is bypassed or operated with temperatures <500 K. The initial effective density and primary particle diameter of the agglomerates can be extracted from the measurements at room temperature T = 293 K for (b) N2 and (d) N2+5 vol%H2 atmosphere. At room temperature, it is observed that the effective density
decreases from 1 to 0.25 g/cm³ with increasing the agglomerate size, thus a more compact structure of smaller agglomerates. The primary particle size is almost constant (
= 4 nm;
= 2.2 ± 0.03) for the selected agglomerate sizes and significant differences between the pure N2 and 5 vol%H2 are not visible. Increasing the furnace temperature leads to a shift of the mobility diameter toward smaller sizes due to the compaction of the structure, thus to a higher effective density and an increase of the fractal dimension. In nitrogen, the agglomerate density increases steadily with temperature, whereas in 5 vol%H2 a significant increase of the effective density can be seen from approx. 2 g/cm³ (873 K) to 7 g/cm³ (923 K). This results from particle mass loss during sintering (shown in S4) caused by the reduction of FexOy to Fe with hydrogen (Manchili et al. Citation2020). At the highest furnace temperature of 1373 K, the sintered agglomerates show a spherical structure (
= 3) and a density close to the bulk density of iron oxide (5.2 g/cm³) and pure iron (to 7.874 g/cm³).
Obtaining the sintering kinetics from the measured morphology changes
The primary particle size and number per agglomerate are calculated from SMPS and CPMA measurands. These properties can also be obtained from the combination of DAPS and SMPS, but lead to a lower accuracy due to the detection limit of the DAPS, smaller primary particles at low temperatures and low number concentration at high temperatures. depicts the increase of (circles) and the reduction of
(crosses) of different agglomerate sizes and as a function the furnace temperature in (a) N2 and (b) in N2+5%H2 atmosphere.
Figure 7. Morphology change due to sintering according to the experimental data (symbols, connected by dashed lines) and results of the sintering model using the best fitting combination of and
assuming
=1 (solid lines). Shown are the primary particle diameter
(circles) and number of primary particles per agglomerate
(crosses) of different sized agglomerates as function the furnace temperature-time histories in (a) pure nitrogen (N2) and (b) in nitrogen with 5 vol% hydrogen (N2+5%H2).
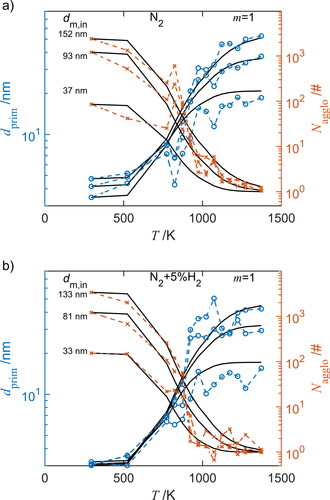
For the optimization procedure, 14 representative measurements, differing by aggregate sizes, at 4 temperatures (298, 773, 1023, 1273 K) were used from the experimental data. The results of the optimization procedure are also shown in , for an assumed value = 1. The solid line represents the results from the sintering model with the optimal combination of
and
In N2 atmosphere, the particle mass remains constant during sintering for the respective size-selected agglomerate so that coagulation, evaporation or condensation can be excluded. In addition, the particle synthesis in N2 and N2+5%H2 has no significant influence on the initial primary particle diameter (approx. 4 nm), nor does the mean primary particle size of the size-selected agglomerates differ. Large changes, increase of
and decrease of
are observed at approx. 900 K leading to a more compact structure (Schmidt-Ott Citation1988). Comparing the , it can be seen that in N2+5%H2 atmosphere the sintering is slightly shifted to lower temperatures of approx. 30 K, the slope is much steeper and no further changes of
are observed for T > 1100 K.
This procedure is followed for the three different gas atmospheres and values for the exponent between 1 and 4, shown detailed in S3. summarizes the results.
Table 1. Sintering parameters and
determined using error minimization of the residuals sum of squares (
), for three different gas atmospheres and four sintering exponents
.
It can be seen that the differences in the residual’s sums of squares are not very large, so that a very clear preference for one of the values of does not appear, but lower values of
seem to lead to better fitting results. The fit results are significantly worse for 1 vol% H2 than for 5 vol% H2 or pure N2, presumably because the particle density changes during sintering and this density cannot be determined exactly as also a morphology change takes place.
It also has to be stressed that although a minimum is found, another combination of and
might also lead to well-fitting results. depicts the quadratic error (
) as function of the activation energy and the sintering rate in N2, assuming plastic and viscous flow as dominant transport mechanism for which
= 1. It can be seen that combinations of
and
lead to a valley of minima.
Figure 8. Numerical solution as sum of quadratic errors () as function of the activation energy
and the pre-exponential rate
of iron oxide in N2, assuming
=1. The global minimum is numerically calculated by the deviation to experimental primary particles.
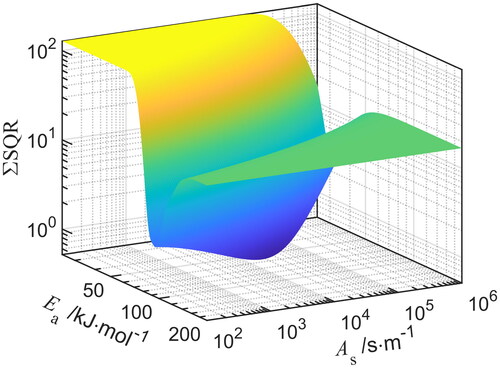
It is interesting to note that although a minimum is found for the residual sum of squares, for each activation energy between approx. 50 and 150 kJ/mol there is a value of the kinetic pre-factor
which gives almost similar good results. The same is true for the exponent m describing the particular sintering mechanism - both with 3 and with 4 good residuals sums of squares are obtained. The experimental data and numerical evaluation do not allow reliable conclusions about the sintering mechanism. In the case of the surface or grain boundary diffusion mechanism, which is expected to be the dominant sintering mechanism for iron and iron oxide, the combination of
and
shifts to higher values. A comparison to the literature is limited, since often only values for
are given, but this value is only meaningful in combination with a value for
A shift toward lower activation energies due to the addition of hydrogen, as described in the literature, is not observed. The parameter pair, together with the exponent
represent precise values for the description of the sintering kinetics.
Conclusions
The sintering kinetics of iron oxide and iron nanoparticles have been determined numerically from experimental data usingthe model flow reactor. The MFR provides a narrow temperature-residence time distribution in a laminar flow field which is needed for the precise determination of the sintering kinetics. Other structure formation mechanisms, such as nucleation or coagulation, can be excluded by a low number concentration and the monitoring of particle mass and size during sintering. The structure formation of size-selected agglomerates is limited to the reaction zone by water-cooled injection and sampling probe and was measured with different online instrumentation. Particle trajectories were simulated based on a validated CFD model and used to calculate the temperature-time history of the particles. Structure models based on the effective density were used to measure the change in morphology during sintering, yielding the primary particle size and number of primary particles in the agglomerate. The sintering model by Koch and Friedlander (Citation1990) was used to model the morphology change. The chemical phase was analyzed by different offline methods, and showed that depending on the gas atmosphere a higher amount of either Fe (N2+5%H2) or Fe3O4 (N2) is present. For size-selected agglomerates having a broad range of initial sizes, and for varying sintering temperatures and gas atmospheres the agglomerate morphology was determined, and the sintering parameters were obtained by error minimization of the primary particle diameter. The sintering exponent = 1 was found to be optimal. For Fe, an activation energy
of 59.15 kJ/mol and a pre-exponential factor
of 1.57 104 s/m were found, for Fe3O4 an activation energy
of 55.22 kJ/mol and a pre-exponential factor
of 2.54 104 s/m. A shift of the sintering kinetics of iron toward lower activation energies by the addition of hydrogen is not observed. This could be due to the fact that, on the one hand, iron oxide particles are already present before sintering and are reduced by the addition of hydrogen and, on the other hand, only the three validated temperature residence time histories (at 773 K, 1023 K, and 1273 K) are used to calculate the sintering kinetics.
A more accurate fit to the measured data is possible by adding further temperature profiles, as well as the separate evaluation of the pre-classified particle sizes. Furthermore, an investigation of the sintering in certain temperature ranges, e.g., before and after the reduction iron oxide, would be interesting. The use of the interpolated temperature residence time histories, shown in S2, calculated from the validated temperature residence time profiles might be too inaccurate for this purpose.
Supplemental Material
Download MS Word (2.1 MB)Acknowledgments
We acknowledge DESY (Hamburg, Germany), a member of the Helmholtz Association HGF, for the provision of experimental facilities. Parts of this research were carried out at the Beamline P65 and we would like to thank the beamline staff for assistance. TEM with EELS analysis by Dr. M. Heidelmann (Interdisciplinary Center for Analytics on the Nanoscale (ICAN), University of Duisburg-Essen) are gratefully acknowledged.
Additional information
Funding
References
- Babick, F., L. Hillemann, M. Stintz, T. Dillenburger, M. Pitz, A. Hellmann, S. Antonyuk, S. Ripperger, F. J. T. Huber, S. Will, et al. 2018. Multiparameter characterization of aerosols. Chem. Ing. Tech. 90 (7):923–36. doi:10.1002/cite.201700094.
- Blake, R. L., R. E. Hessevick, T. Zoltai, and L. W. Finger. 1966. Refinement of the hematite structure. Am. Mineral. 51 (1–2):123–9.
- Cho, K., C. Hogan, and P. Biswas. 2007. Study of the mobility, surface area, and sintering behavior of agglomerates in the transition regime by tandem differential mobility analysis. J. Nanopart. Res. 9 (6):1003–12. doi:10.1007/s11051-007-9243-5.
- DeCarlo, P., J. Slowik, D. Worsnop, P. Davidovits, and J. Jimenez. 2004. Particle morphology and density characterization by combined mobility and aerodynamic diameter measurements. Part 1: theory. Aerosol Sci. Technol. 38 (12):1185–205. doi:10.1080/027868290903907.
- Eggersdorfer, M., D. Kadau, H. Herrmann, and S. Pratsinis. 2012. Aggregate morphology evolution by sintering: number & diameter of primary particles. J Aerosol Sci . 46:7–19. doi:10.1016/j.jaerosci.2011.11.005.
- Eggersdorfer, M., and S. Pratsinis. 2013. Restructuring of aggregates and their primary particle size distribution during sintering. AIChE J. 59 (4):1118–26. doi:10.1002/aic.14043.
- Ewels, P., T. Sikora, V. Serin, C. Ewels, and L. Lajaunie. 2016. A complete overhaul of the electron energy-loss spectroscopy and X-ray absorption spectroscopy database: Eelsdb.Eu. Microsc. Microanal. 22 (3):717–24. doi:10.1017/S1431927616000179.
- Feldhoff, A., J. Martynczuk, M. Arnold, M. Myndyk, I. Bergmann, V. Šepelák, W. Gruner, U. Vogt, A. Hähnel, and J. Woltersdorf. 2009. Spin-state transition of iron in (perovskite). J. Solid State Chem. 182 (11):2961–71. doi:10.1016/j.jssc.2009.07.058.
- Fleet, M. E. 1981. The structure of magnetite. Acta Crystallogr. B Struct. Crystallogr. Cryst. Chem. 37 (4):917–20. doi:10.1107/S0567740881004597.
- Friedlander, S. K., and M. K. Wu. 1994. Linear rate law for the decay of the excess surface area of a coalescing solid particle. Phys Rev B Condens Matter . 49 (5):3622–4. doi:10.1103/PhysRevB.49.3622.
- German, R. M. 1996. Sintering Theory and Practice. New York: John Wiley & Sons.
- Goudeli, E., A. Gröhn, and S. Pratsinis. 2016. Sampling and dilution of nanoparticles at high temperature. Aerosol Sci. Technol. 50 (6):591–604. doi:10.1080/02786826.2016.1168922.
- Hallberg, R. T., L. Ludvigsson, C. Preger, B. O. Meuller, K. A. Dick, and M. E. Messing. 2018. Hydrogen-assisted spark discharge generated metal nanoparticles to prevent oxide formation. Aerosol Sci. Technol. 52 (3):347–58. doi:10.1080/02786826.2017.1411580.
- Hontañón, E., J. Palomares, M. Stein, X. Guo, R. Engeln, H. Nirschl, and F. E. Kruis. 2013. The transition from spark to arc discharge and its implications with respect to nanoparticle production. J. Nanopart. Res. 15 (9):1957. doi:10.1007/s11051-013-1957-y.
- Hull, A. W. 1917. A new method of x-ray crystal analysis. Phys. Rev 10 (6):661–96. doi:10.1103/PhysRev.10.661.
- Kim, S., J. Wang, M. Emery, W. Shin, G. Mulholland, and D. Pui. 2009. Structural property effect of nanoparticle agglomerates on particle penetration through fibrous filter. Aerosol Sci. Technol. 43 (4):344–55. doi:10.1080/02786820802653763.
- Kirchhof, M. J., H. Förster, H. J. Schmid, and W. Peukert. 2012. Sintering kinetics and mechanism of vitreous nanoparticles. J. Aerosol Sci. 45:26–39. doi:10.1016/j.jaerosci.2011.10.006.
- Kirchhof, M. K., H. J. Schmid, and W. Peukert. 2004. Reactor system for the study of high-temperature short-time sintering of nanoparticles. Rev. Sci. Instrum. 75 (11):4833–40. doi:10.1063/1.1809258.
- Knight, P. C., J. P. K. Seville, H. Kamiya, and M. Horio. 2000. Modelling of sintering of iron particles in high-temperature gas fluidisation. Chem. Eng. Sci. 55 (20):4783–7. doi:10.1016/S0009-2509(00)00055-5.
- Koch, W., and S. K. Friedlander. 1990. The effect of particle coalescence on the surface area of a coagulating aerosol. J. Colloid Interface Sci. 140 (2):419–27. doi:10.1016/0021-9797(90)90362-R.
- Kolb, M., and H. Herrmann. 1987. Surface fractals in irreversible aggregation. Phys. Rev. Lett. 59 (4):454–7. doi:10.1103/PhysRevLett.59.454.
- Kramer, C., and R. German. 1978. Low-temperature sintering of iron oxides. J. Am. Ceramic Soc. 61 (7–8):340–2. doi:10.1111/j.1151-2916.1978.tb09324.x.
- Krishnan, K. 1990. Iron L3,2 near-edge fine structure studies. Ultramicroscopy 32 (4):309–11. doi:10.1016/0304-3991(90)90076-X.
- Kruis, F. E., K. Kusters, S. Pratsinis, and B. Scarlett. 1993. A simple model for the evolution of the characteristics of aggregate particles undergoing coagulation and sintering. Aerosol Sci. Technol. 19 (4):514–26. doi:10.1080/02786829308959656.
- Kuczynski, G. C. 1949. Self-diffusion in sintering of metallic particles. J. Mineral. Metal Mater. Soc. 1 (2):169–78. doi:10.1007/BF03398090.
- Lagarias, J., J. Reeds, M. Wright, and P. Wright. 1998. Convergence properties of the nelder–mead simplex method in low dimensions. SIAM J. Optim. 9 (1):112–47. doi:10.1137/S1052623496303470.
- Li, Z., and H. Wang. 2004. Thermophoretic force and velocity of nanoparticles in the free molecule regime. Phys. Rev. E Stat. Nonlin. Soft Matter Phys. 70 (2 Pt 1):021205. doi:10.1103/PhysRevE.70.021205. }.
- Liao, B.-X., W.-C. Gong, Z. Li, and C.-J. Tsai. 2019. A mass correction method for the aerosol particle mass analyzer to measure the particle mass of sub-50 nm nanoparticles. Aerosol Sci. Technol. 53 (9):1056–66. doi:10.1080/02786826.2019.1626345.
- Lutterotti, L. 2010. Total pattern fitting for the combined size–strain–stress–texture determination in thin film diffraction. Nucl. Instrum. Methods Phys. Res, Sect. B 268 (3–4):334–40. doi:10.1016/j.nimb.2009.09.053.
- Manchili, S., J. Wendel, E. Hryha, and L. Nyborg. 2020. Analysis of iron oxide reduction kinetics in the nanometric scale using hydrogen. Nanomaterials. 10 (7):1276. doi:10.3390/nano10071276.
- Matsumura, G. 1971. Sintering of iron wires. Acta Metall. 19 (8):851–5. doi:10.1016/0001-6160(71)90141-6.
- Mikami, T., H. Kamiya, and M. Horio. 1996. The mechanism of defluidization of iron particles in a fluidized bed. Powder Technol. 89 (3):231–8. doi:10.1016/S0032-5910(96)03187-7.
- Okudera, H. 1997. Single crystal X-ray studies of cation-deficient magnetite. Zeitsch Kristallograph Crystal Mater. 212 (6):458–61. doi:10.1524/zkri.1997.212.6.458.
- Park, K., D. Kittelson, and P. McMurry. 2004. Structural properties of diesel exhaust particles measured by transmission electron microscopy (TEM): relationships to particle mass and mobility. Aerosol Sci. Technol. 38 (9):881–9. doi:10.1080/027868290505189.
- Pratsinis, S. 1988. Simultaneous nucleation, condensation, and coagulation in aerosol reactors. J. Colloid Interface Sci. 124 (2):416–27. doi:10.1016/0021-9797(88)90180-4.
- Rosenberger, T., D. Kiesler, E. Hontañón, D. Fuentes, E. Ramiro, and F. E. Kruis. 2019. Design and optimization of a medium flow differential mobility analyzer (MF-DMA) for classification of high-density particles. Aerosol Sci. Technol. 53 (10):1172–85. doi:10.1080/02786826.2019.1642443.
- Rosenberger, T., A. Münzer, D. Kiesler, H. Wiggers, and F. E. Kruis. 2018. Ejector-based sampling from low-pressure aerosol reactors. J. Aerosol Sci. 123:105–15. doi:10.1016/j.jaerosci.2018.06.003.
- Rosenberger, T., J. Sellmann, I. Wlokas, and F. E. Kruis. 2020. A model flow reactor design for the study of nanoparticle structure formation under well-defined conditions. Rev. Sci. Instrum. 91 (9):095114. doi:10.1063/5.0018880.
- Scheckman, J., P. McMurry, and S. Pratsinis. 2009. Rapid characterization of agglomerate aerosols by in situ mass-mobility measurements. Langmuir 25 (14):8248–54. doi:10.1021/la900441e.
- Schmidt-Ott, A. 1988. New approaches to in situ characterization of ultrafine agglomerates. J. Aerosol Sci. 19 (5):553–63. doi:10.1016/0021-8502(88)90207-8.
- Schwyn, S., E. L. Garwin, and A. Schmidt-Ott. 1988. Aerosol generation by spark discharge. J. Aerosol Sci. 19 (5):639–42. doi:10.1016/0021-8502(88)90215-7.
- Seipenbusch, M., A. Weber, A. Schiel, and G. Kasper. 2003. Influence of the gas atmosphere on restructuring and sintering kinetics of nickel and platinum aerosol nanoparticle agglomerates. J. Aerosol Sci. 34 (12):1699–709. doi:10.1016/S0021-8502(03)00355-0.
- Stein, M., D. Kiesler, and F. E. Kruis. 2013. Adjustment and online determination of primary particle size in transferred arc synthesis of copper nanoparticles. Aerosol Sci. Technol. 47 (11):1276–84. doi:10.1080/02786826.2013.835484.
- Tabrizi, N. S., M. Ullmann, V. Vons, U. Lafont, and A. Schmidt-Ott. 2009. Generation of nanoparticles by spark discharge. J. Nanopart. Res. 11 (2):315–32. doi:10.1007/s11051-008-9407-y.
- Tavakoli, F., and J. Olfert. 2014. Determination of particle mass, effective density, mass–mobility exponent, and dynamic shape factor using an aerodynamic aerosol classifier and a differential mobility analyzer in tandem. J. Aerosol Sci. 75:35–42. doi:10.1016/j.jaerosci.2014.04.010.
- Tence, M., J. Chevalier, R, and Jullien, j. 1986. On the measurement of the fractal dimension of aggregated particles by electron microscopy: experimental method, corrections and comparison with numerical models. J. Phys. France. 47 (11):1989–98. doi:10.1051/hys:0198600470110198900.
- Zhao, J., F. E. Huggins, Z. Feng, F. L. Lu, N. Shah, and G. P. Huffman. 1993. Structure of a nanophase iron oxide catalyst. J. Catal. 143 (2):499–509. doi:10.1006/jcat.1993.1293.