
 ?Mathematical formulae have been encoded as MathML and are displayed in this HTML version using MathJax in order to improve their display. Uncheck the box to turn MathJax off. This feature requires Javascript. Click on a formula to zoom.
Abstract
Highly reflective snow surfaces are sensitive to contamination by light-absorbing particles. When such particles are deposited onto a snow surface, they reduce snow albedo, which leads to snow surface warming and accelerates snowmelt. To better understand and characterize the effects of light-absorbing particles on snow albedo, an experimental campaign was conducted in Cotos Port, Madrid Spain. A spectroradiometric system consisting of six spectroradiometers simultaneously measuring sun irradiance and snow radiance spectra over the range from 300 to 2500 nm was used. Measured snow albedo spectra were compared to modeled snow albedo spectra obtained with a novel snow radiative transfer model (OptiPar) developed by our research group. Comparison of these experimental and OptiPar-modeled results with results from open modeling software, such as SNICAR and snowTARTES, has demonstrated that the detailed consideration of soot aerosol shape and size is helpful for a good spectral albedo prediction and that OptiPar provides enough flexibility for optimal fitting.
Graphical Abstract
EDITOR:
Introduction
Soot, or black carbon, comprises a significant mass fraction of combustion derived particulate matter. Primary soot particles are uniformly sized (30 nm diameter) and quasi-spherical. They stick together and form agglomerates of various lengths and shapes. Soot aerosols are the dominant light absorbing aerosols in the atmosphere (Moosmüller, Chakrabarty, and Arnott Citation2009) and, upon deposition onto snow surfaces, can greatly reduce snow albedo (Hadley and Kirchstetter Citation2012). These aerosols have optical properties that depend on their size, composition, shape, and on the wavelength λ of the incident light. Small aerosol particles (e.g., with a diameter d and a size parameter x = πd/λ < 2) have higher absorption than scattering efficiencies, leading to a dominating heating effect. Larger aerosol particles (e.g., x > 8) have higher scattering than absorption efficiencies, with a larger single scattering Albedo (SSA) and a dominating cooling effect (Bond et al. Citation2013; Moosmüller and Sorensen Citation2018). For equal size, more irregular or clustered particles (with lower fractal dimensions) have higher absorption efficiencies, whereas more compact particles (with higher fractal dimensions) have higher scattering efficiencies (Smith and Grainger Citation2014).
Once aerosol particles are deposited onto the earth's surface, their radiative effects depend not only on the particle properties, but also on the surface albedo, simplistically defined as the ratio between reflected and incident solar power (Schaepman-Strub et al. Citation2006). Among the surfaces on earth, bright ones such as arid lands, clouds, and especially snow surfaces are optically most sensitive to contamination by deposition of light-absorbing particles (Flanner et al. Citation2009; Prăvălie Citation2016; Liu et al. Citation2020). Detailed knowledge about particle optical properties is necessary to evaluate the reduction of surface albedo. In the specific case of snow surfaces, the albedo reduction due to particle deposition leads to additional heating (Hadley and Kirchstetter Citation2012), which increases the snow/ice grain size, further lowering the albedo, and impacts the timing of snowmelt (yielding further albedo reduction once the underlying surface is exposed), the preservation of glaciers, and the hydrological cycles on a regional scale (Lee et al. Citation2013).
Studies about the reduction of the snow albedo from soot contamination include Jacobi et al. (Citation2015), Ginot et al. (Citation2014), and Cereceda-Balic et al. (Citation2018). Some of these studies have used radiative transfer models, most of which, such as SNICAR (SNow, ICe, and Aerosol Radiative model) (Flanner et al. Citation2007; Flanner et al. Citation2021) or SnowTARTES (Two-streAm Radiative TransfEr in Snow model) (SnowTARTES Citation2021), use measured mass concentrations of deposited soot particles in surface snow as input data. However, these models do not consider the effect of soot agglomerate morphology onto soot optical properties. The OptiPar software, introduced here, offers more flexibility and a variety of options for an optimal fitting to experimental results. It also includes different options for the soot complex refractive index spectrum.
Snow albedo has been measured with different types of instruments including remote-sensing studies employing the Moderate Resolution Imaging Spectroradiometer (MODIS) (Klein and Stroeve Citation2002; Wang et al. Citation2012; Painter et al. Citation2009) and field measurements employing the Finnish Geodetic Institute’s Field Goniospectropolariradiometer (FIGIFIGO) (Peltoniemi et al. Citation2015) or broadband pyranometers that allowed subsequent separation into visible and NIR bands (Marks, Dozier, and Davis Citation1992). However, these studies were limited because they did not cover and resolve the whole terrestrial solar spectrum. For this reason, the spectroradiometric system used in our study is composed of six different spectroradiometers, allowing for spectral measurements covering the whole terrestrial solar spectrum (i.e., from 300 to 2500 nm). Some previous studies covered this complete wavelength range, but did not evaluate the effect of soot contamination (Aoki et al. Citation2000; Painter and Dozier Citation2004; Dumont et al. Citation2010).
Description of field measurements and data processing
Spectroradiometric system
The high-spectral resolution field spectroradiometer used here was designed and assembled by Antares Instrumentation SL (www.antares.es) using the Avantes technologies (www.avantes.com). This system consists of six individual spectroradiometers, for the simultaneous measurement of surface radiance and solar irradiance over a spectral range from 300 to 2500 nm. For the UV–visible region (300–1100 nm), it uses a spectroradiometer (AvaSpec ULS2048CL-EVO) with 2.17 nm resolution in the 350–1000 nm range with a sensitivity of 218,000 counts μW−1 per ms of integration and a signal-to-noise ratio of 335:1. For the NIR region between 900 and 1700 nm, it uses a spectroradiometer (AvaSpec-NIR512 1.7-HSCEVO) with 7.0 nm resolution, a sensitivity of 2,500,000 counts μW−1 per ms of integration, and a signal-to-noise ratio of 1900:1. Finally, between 1700 and 2500 nm, it uses a spectroradiometer (AvaSpec-NIR512-2.5-HSC-EVO) with 5.7 nm resolution, a sensitivity of 480,000 counts μW−1 per ms of integration, and a signal-to-noise ratio of 1900:1. The system further uses an integrating sphere with 30 mm internal diameter (AvaSphere-30-IRRAD) to measure the down-welling solar irradiance. A cosine receptor with an active area of 8 mm diameter (CC-UV/VIS/NIR-8MM), with Quartz optics, is used for the measurement of the up-welling radiance from the snow surface, covering a hemispheric field of view of 2π. Both are connected to the spectroradiometric system through 8-m long optical fibers. The system can transfer data to a computer through both USB and Ethernet connections using the Avasoft 8.0 software from Avantes.
The system irradiance measurement was calibrated with a NIST-traceable and calibrated AvaLight-Hal-CALMini lamp over the spectral range of 350 − 2500 nm, and the wavelength calibration used a Hg-Ar spectral calibration lamp (AvaLight-CAL-Mini) over the spectral range between 253.6 and 922.5 nm. Prior to field measurements, the expected irradiance range needs to be established to properly set the instrument sensitivity and thereby avoid saturation and optimize the signal-to-noise ratio.
Experimental campaign
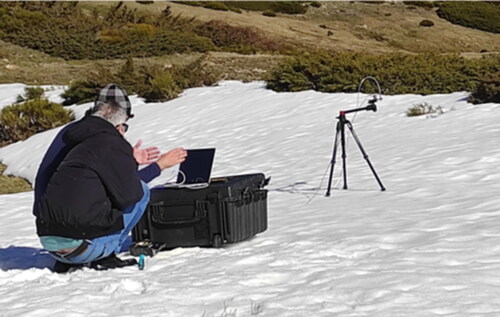
The experimental campaign took place on 10 March 2021. Measurements were made over a relatively clean snow surface, in the proximities of the Valdesquí ski station, near the Cotos port (Sierra de Guadarrama, Madrid, Spain). Based on the number of days with dry weather before the campaign (around 20) and on the high intensity of road traffic toward and from the ski station, it was expected that the initial contamination was derived from dry deposition of soot particles emitted from vehicles. Thus, the mixing state of soot and snow could be classified as external mixing (Tanikawa et al. Citation2020). The GPS coordinates of the measurement location were 40.8°N, 3.97°W, altitude 1800 m a.s.l. No horizontal surface was found near this location. Therefore, a surface with an inclination angle of 18° and a maximum slope in direction 40° (NNE) was chosen, and the azimuthal and zenith angles were corrected by means of a double rotation. The insufficient surface amplitude from a finite snow area forced us to place the detectors 75 cm above the snow surface, to view most of the surrounding snow-covered area with a vision factor of 0.95. The system was placed to minimize the presence of shadows from the tripod and the optical fibers (see ). The measured snow depth was 53.5 cm, which can be considered as semi-infinite (Wiscombe and Warren Citation1980; Beres et al. Citation2020).
Figure 1. Installation of the spectroradiometric system.
Measurements of the solar spectral irradiance and the snow spectral radiance were scheduled as follows: (a) measurements from 11:40 to 14:30 h (10:40 to 13:30 h solar time) in 10-min intervals (18 measurements); (b) repeatability test composed of 20 irradiance and radiance measurements taken every 0.5 s; and (c) measurements after artificially increasing the soot contamination of the snow. For the last measurements, the surface was additionally contaminated with a manual blower depositing devolatilized soot, previously collected with a thermophoretic probe from a diesel engine, onto the snow. This engine was tested in an engine test bench replicating previous tests (Lapuerta, Ballesteros, and Martos Citation2009). This soot was previously analyzed with transmission electron microscopy (TEM) and subjected to fractal analysis (Lapuerta, Ballesteros, and Martos Citation2006).
Snow grain shape and average grain size were determined in the field using a calibrated card and a magnifying glass, and subsequently, photographs of the snow surface were analyzed with Image J (Schneider, Rasband, and Eliceiri Citation2012). According to Fierz et al. (Citation2009), the observed grains belonged to the melt form group (MF) and the subclass melt-freeze crust (MFcr). The resulting average grain size was 800 µm, which can be classified as medium (type E) (Fierz et al. Citation2009).
Finally, snow samples were taken, before and after additional contamination, for weighting and filtering with polycarbonate Track-Etch Membrane Nuclepore filters from Whatman, method validated by Cereceda-Balic et al. (Citation2019). The solar zenith angle observed at 12.10 h (11.10 h solar time) with respect to the inclined surface (relative zenith angle) was 57.99°. It was obtained as the complementary of the elevation angle. The latter was obtained by adding the surface inclination angle to the elevation one in the direction of maximum slope.
Data processing
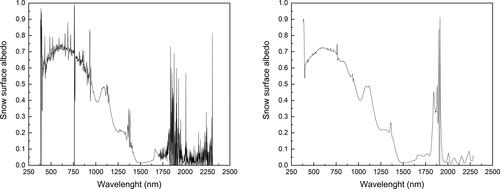
Measured signals of the spectral irradiance and radiance intensities () were smoothed with a weighted moving-average filter with Gaussian coefficients, applied to a window of ± 10 data points, as shown in EquationEquation (1)
(1)
(1) . Since the resolution of the spectroradiometric system is
nm, this window is equivalent to ± 16 nm. Snow surface albedo data prior and after smoothing are shown in , for 11.10 h solar time, as an example.
(1)
(1)
Figure 2. Spectral albedo corresponding to 11.10 h solar time prior (left) and after smoothing (right).
Optipar radiative transfer model
OptiPar software contains a two-stream radiative transfer model for the calculation of snow surface optical properties (Toon et al. Citation1989) that allows for the detailed and flexible accounting of the effects of light absorbing particles deposited onto snow surfaces. It was recently developed at the University of Castilla-La Mancha and it is freely available at (GCM-UCLM 2022). This software includes the determination of the optical properties of soot agglomerates and ice particles, and is open to incorporate new materials, as long as their complex refractive index spectra, or the parameters necessary for their determination, are provided.
Seven materials of interest are currently included: soot, ice, mineral dust, ash, graphite, diamond, and water. Graphite is incorporated because it can serve as surrogate for soot, since soot can be differently graphitized (Popovicheva et al. Citation2011), with different density of sp2 bonds and different graphene interlayer spacings. Diamond is also useful as a surrogate, since soot often has a significant density of sp3 bonds (Russo et al. Citation2017). Both atomic structures affect the electron mobility of the material when interacting with sunlight. Different types of dust and ash can be selected depending on their origin. Ice and water are used to characterize snow surfaces with different liquid water content.
The refractive index (or the dielectric constant) spectrum of the material can be selected from two possible sources: from correlations proposed in the literature and/or from the Lorentz-Drude dispersion model (Bond and Bergstrom Citation2006) using initial parameters (electronic density, resonance frequency and damping factor for each oscillator) proposed in the literature. For soot, correlations derived from the data proposed by Yon, Bescond, and Liu (Citation2015) or Chang and Charalampopoulos (Citation1990) can be chosen, and parameters proposed by Dalzell and Sarofim (Citation1969), Lee and Tien (Citation1981), Habib and Vervisch (Citation1988), and Stagg and Charalampopoulos (Citation1993), can be used as input for the dispersion model.
For ice, the values of the complex refractive index can be selected among those proposed by Warren and Brandt (Citation2008), or more recently by Picard, Libois, and Arnaud (Citation2016). For water, values from Irvine and Pollack (Citation1968) are used. For graphite, either the values proposed by Kwiecinska, Murchison, and Scott (Citation1977), Polyanskiy (Citation2021) or the dispersion model with the parameters from Stagg and Charalampopoulos (Citation1993) can be selected. For mineral dust, different refractive index spectra for pure Saharan dust proposed by Patterson, Gillette, and Stockton (Citation1977) are available, and finally, other types of dust or ash can also be used as long as their mineral composition is known.
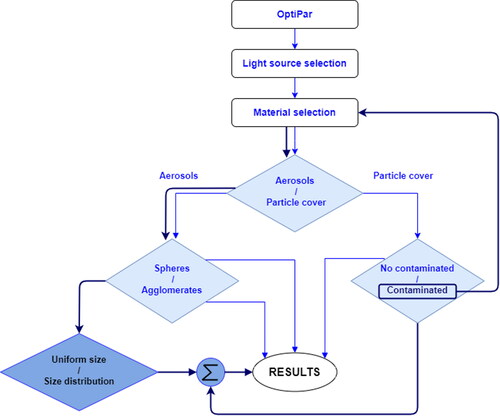
After the material has been selected, a variety of studies is possible, as shown in . The initial selection is between studying aerosol particles or surfaces covered with particles. In the case of aerosols, particles can be defined as spheres or as agglomerates of spheres. If a particle covered surface is selected, it can be contaminated by deposited particles or not. In the first case, (dark blue route in the figure) the particle material must be selected to define the aerosol deposited to contaminate the surface. Aerosols can be defined with a uniform particle size or with a particle size distribution.
Figure 3. Flowchart of OptiPar software.
Particle optical properties can be obtained either with the Rayleigh approximation or with the Mie solution. The first one is the simplest method since it is derived from the first, non-zero term of the Mie expansion (Bohren and Huffman Citation1983). While the Rayleigh regime is limited to particle sizes smaller than the radiation wavelength, it can be extended accurately with no additional computational cost if Bohren and Huffman (Citation1983) or Dobbins and Megaridis (Citation1991) equations are used (Lapuerta et al. Citation2021).
The Mie solution is employed for isolated spherical ice particles, due to their size, typically comparable to, or larger than, the radiation wavelength. For soot agglomerates, two different methods can be considered: (a) the Rayleigh-Debye-Gans approximation (Sorensen et al. Citation2018) together with a correction factor to consider the effect of multiple scattering, such as those proposed by Mountain and Mulholland (Citation1988) or by Köylü and Faeth (1994), and (b) the Mie solution with volume averaged optical properties via effective medium methods (Shivola Citation2000). Some options for effective medium methods are the proposals by Lorentz (Citation1937), Garnett (Citation1904), Bruggeman (Citation1937), Lakhtakia and Vikram (Citation1993), and Lumme and Rahola (Citation1994). The volume fraction and the maximum radius of the agglomerate equivalent sphere can be calculated selecting a geometric method, consistent with the fractal analysis method proposed by Lapuerta, Ballesteros, and Martos (Citation2006), or an approximated method such as that commonly used in the literature (Gmachowski Citation2002; Naumann Citation2003).
If a snowpack consisting of snow/ice particles is studied, then the approach proposed by Wiscombe and Warren (Citation1980) was followed. The snow density, the asymmetry parameter and the zenith angle are used as inputs. The snow density depends on the depth of the snowpack and is calculated with either expression proposed by Pomeroy and Gray (Citation1995), using the surface snow density as input value. For the asymmetry parameter of ice crystals, three different options can be used. The most accurate one for spherical particles is the Debye expression (Bohren and Huffman Citation1983). However, particles can be non-spherical and, in this case, the simulation of the asymmetry parameter with the Debye expression is less accurate. In addition, in the grain size range below 2750 nm, this expression overestimates the asymmetry parameter. This overestimation has been corrected with two approaches. Warren (Citation2019) proposed to compensate for it by reducing the grain size. However, with the aim of using the measured grain size, other proposals can be used, such as the expressions proposed by Macke, Mueller, and Raschke (Citation1996), and Yang and Fu (Citation2009), which include some fitting parameters. The obtained asymmetry parameter is corrected with the Delta-Eddington approximation proposed by Joseph, Wiscombe, and Weinman (Citation1976), and Wiscombe and Joseph (Citation1977) to consider multiple scattering among snow grains. The effect of the surface roughness, which may become significant for high zenith angles at the late-melting season, is also considered (Manninen et al. Citation2021). Finally, to determine the snow albedo, direct and diffuse radiation can be weighted based on the solid angle covered by clouds (Bird and Riordan Citation1986). If the thickness of the snowpack is finite (with the limit thickness depending on grain size and wavelength), then the spectral albedo of the underlying surface must also be introduced as an input.
For the broadband albedo calculation, first the spectral solar irradiance is determined using geographic coordinates, seasonal data, and ambient conditions as input parameters. This model is based on the approach proposed by Bird and Riordan (Citation1986) for direct and diffuse radiation. Optipar allows using either the experimental irradiance or the calculated one.
OptiPar is different from other software because it includes, and is open to, the flexible use of a variety of methods with the aim to support research on the optical properties of particles, as well as of snow surfaces on which these particles have been deposited.
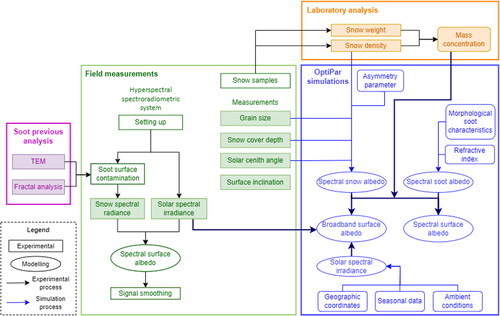
A flowchart of the combined experimental and modeling methodology, including soot previous analysis (purple square), field measurements (green square), laboratory analysis (orange square), and OptiPar simulations (blue square, for consistency with ) is shown in . A recent example is the study by González-Correa et al. (Citation2022).
Figure 4. Flowchart of the experimental-modeling methodology.
Results
Experimental results
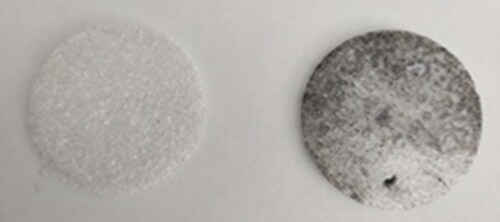
The snow samples (each with a volume of 1 L) obtained during the experimental campaign were weighted for the determination of the snow surface density (150 kg/m3) and then analyzed in the laboratory. The mass concentration of water-insoluble material, further identified as soot particles from vehicle engines, was obtained by melting the snow and extracting the particles through filtering of the melted samples with polycarbonate filters (examples shown in ), determining the water-insoluble particle mass as the weight difference between loaded and clean filters (with 47 mm diameter), and finally divided this particle mass by the snow weight collected. The first sample obtained, had a soot concentration of 3.3 mg/kg. Such concentration can be explained by the commonly heavy traffic on a nearby road that gives access to the ski station. After contaminating the surface with the additional soot previously mentioned (Lapuerta, Ballesteros, and Martos Citation2009), a total soot concentration of 9.3 mg/kg was obtained. The nil sulfur content of the fuel used suggests that this soot behaves basically hydrophobically (Weingartner, Burtscher, and Baltensperger Citation1997).
Figure 5. Loaded filter before (3.3 mg/kg of insoluble material) (left) and after additional contamination of the snow with external soot (9.3 mg/kg of insoluble material) (right).
The irradiance and radiance spectra obtained over the whole measuring period are shown in . The broadband snow albedo can be obtained as the ratio between reflected radiance and solar irradiance, both calculated by integration over the entire spectral range. In this case, both radiance () and irradiance
were approximated by the sum of their discrete experimental values:
(2)
(2)
where
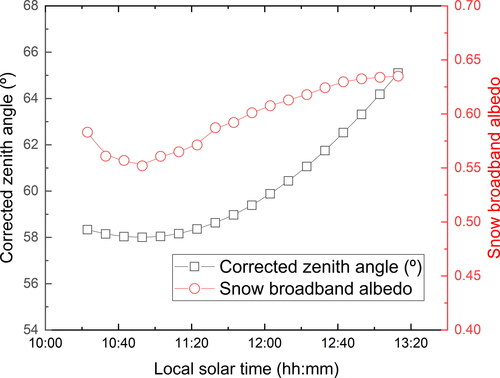
is the broadband albedo. Results are shown in together with the corrected solar zenith angle. It can be observed that the minimum albedo was obtained during the maximum zenith angle (after correction with slope angles), in agreement with Cereceda-Balic et al. (Citation2018) and with Peltoniemi et al. (Citation2005).
Figure 6. Irradiance (left) and radiance (right) spectra registered from 10:40 to 13:30 solar time, every 10 min (represented with different colors).
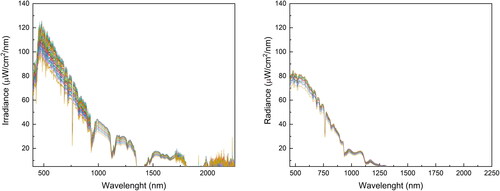
Figure 7. Broadband snow albedo and corrected zenith angle evolution on the local solar time.
Comparison with model results
For the experiment-model comparison, the spectra obtained at 11.10 h local solar time were selected. OptiPar software requires introducing input data and selecting methods for the computations. For ice particles, the refractive index spectrum proposed by Warren and Brandt (Citation2008) is used, because it covers our experimental spectral range unlike the one proposed by Picard, Libois, and Arnaud (Citation2016) that cover only the visible spectrum. For snow surfaces, the measured grain size (800 ) and the relative zenith angle (67.09°) were introduced. The asymmetry parameter proposed by Macke, Mueller, and Raschke (Citation1996) was selected.
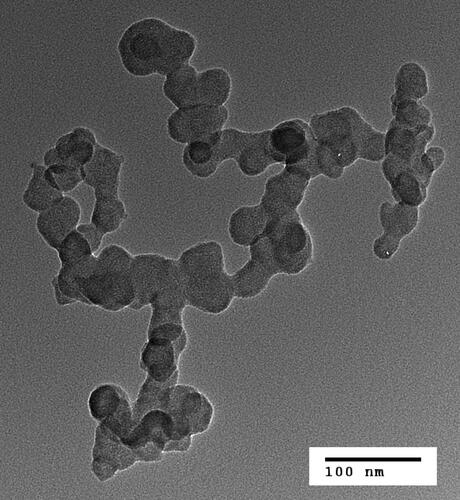
The parameters describing the morphological characteristics of the soot sample used for contamination were taken for the reference engine operating conditions from an aforementioned study (Lapuerta, Ballesteros, and Martos Citation2009). These correspond, on average, to a fractal dimension of 1.85 and 80 primary particles with a monomer diameter of 25 nm constituting each agglomerates. An example of an agglomerate with morphological characteristics close to the average ones is shown in . The soot refractive index was obtained with the dispersion model using the initial parameters proposed by Stagg and Charalampopoulos (Citation1993). Finally, the Rayleigh-Debye-Gans (RDG) approximation was used, after selecting the Rayleigh expressions for absorption and scattering, and the correction proposed by Mountain and Mulholland (Citation1988) to account for multiple scattering.
Figure 8. Example of agglomerate with morphological characteristics close to the average ones (fractal dimension = 1.84, number of primary particles = 84).
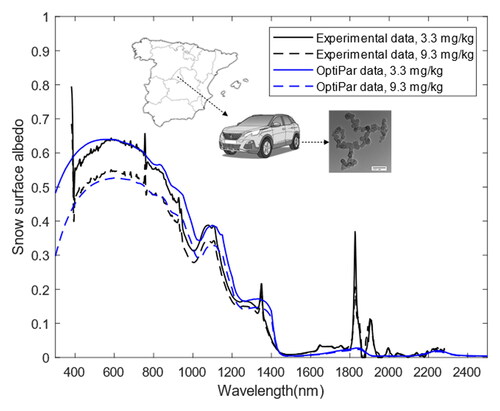
Experimental and modeled results are shown in and . In , the experimental values are compared with those modeled with OptiPar software. Modeled results agree reasonably well with the two measured spectra for soot concentrations of 3.3 and 9.3 mg/kg. In the visible range, the effect of the soot contamination contributes to a reduction of the snow surface albedo, because of its highly absorbing characteristics and the general lack of light absorption by water and ice in the visible range. In the infrared spectrum, some differences can be observed between the measured and calculated spectra in the range 900–1100 nm. These differences may be due to the asymmetry parameter used, which overestimates the snow albedo, as acknowledged by Warren (Citation2019), or to the underestimation of the absorption efficiency often observed when RDG approximation is used (Mackowski Citation1995). The peaks observed around 1800 nm may be due to a loss of sensitivity near the edge of the spectroradiometer (AvaSpec-NIR512-2.5-HSC-EVO) spectral range between 1700 and 2500 nm. Sharp spikes below 350 nm and above 1800 nm are a consequence of the low solar irradiance at this wavelength ranges. A sensitivity study of OptiPar output to input parameters is presented in the supplementary material.
Figure 9. Experimental and OptiPar modeled albedo results for snow surface contaminated with 3.3 and 9.3 mg/kg soot.
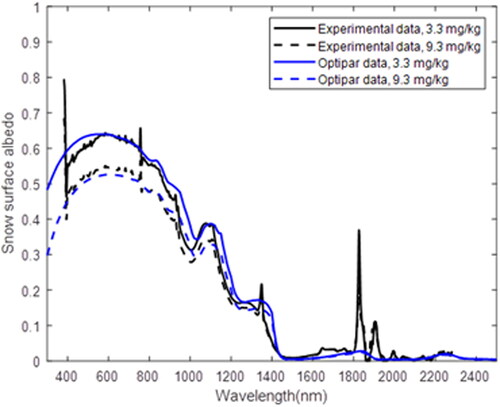
Figure 10. Experimental and SNICAR and SnowTARTES modeled albedo results for snow surface contaminated with 3.3 and 9.3 mg/kg soot.
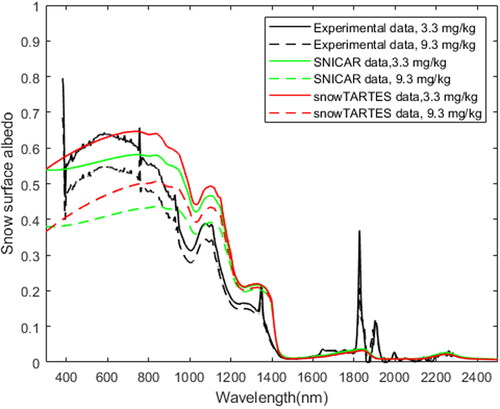
In , differences between the experimental data and the computational values from SNICAR and SnowTARTES softwares are shown. In the visible range, these models do not correctly reproduce the experimentally observed sharp decrease of snow albedo at short visible wavelengths (i.e., < 500 nm), derived from soot contamination. The overestimation observed in this range may be explained because the lack of consideration of morphology and size of soot agglomerates; instead, only spherical particles are considered. Assuming spherical particles (therefore ignoring the morphology of soot agglomerates) can lead to large errors in the reflectance measurements, which can increase with the particle size, as stated by Mishchenko et al. (Citation1995), and Skiles, Painter, and Okin (Citation2017).
Conclusions
The portable spectroradiometric system allowed determining snow albedo for the whole terrestrial solar spectrum in contrast to other equipment or installations, which generally have a much more limited wavelength range. To successfully measure snow optical properties with this system, some requirements must be addressed, including the need to calibrate the equipment, to install the system to minimize shadows from the tripod and the optical fibers, and to avoid saturation of the irradiance signal for long-duration measurements. Modeled simulations, considering the average size and shape of soot agglomerates, can contribute to support and interpret experimental results, with the aim of evaluating the impact of soot contamination on the radiative forcing of snow surfaces and its impact on climate change. Results obtained with OptiPar simulations are in reasonably good agreement with experimental snow albedo spectra. In addition, the reduction of snow albedo by soot contamination has been observed and has been simulated with reasonable agreement. It has also been shown that OptiPar software has the potential to obtain more accurate results than other existing software such as SNICAR and SnowTARTES, due to the adaptability and variety of calculation methods and options offered, and to the possibility to specify the morphology of soot agglomerates. Further experimental campaigns in different locations and under different conditions (snow aging, liquid water content, soot concentration, particle size and morphology, dust concentration, etc.) will be helpful to select the most appropriate calculation methods for an optimal fitting of experimental results.
Supplemental Material
Download MS Word (55.3 KB)Additional information
Funding
References
- Aoki, T., T. Aoki, M. Fukabori, A. Hachikubo, Y. Tachibana, and F. Nishio. 2000. Effects of snow physical parameters on spectral albedo and bidirectional reflectance of snow surface. J. Geophys. Res. 105 (D8):10219–36. doi:10.1029/1999JD901122.
- Beres, N. D., M. Lapuerta, F. Cereceda-Balic, and H. Moosmüller. 2020. Snow surface albedo sensitivity to black carbon: radiative transfer modelling. Atmosphere 11 (10):1077. doi:10.3390/atmos11101077.
- Bird, R. E., and C. Riordan. 1986. Simple solar spectral model for direct and diffuse irradiance on horizontal and tilted planes at the Earth's surface for cloudless atmospheres. J. Climate Appl. Meteor. 25 (1):87–97. > 2.0.CO;2. doi:10.1175/1520-0450(1986)025 < 0087:SSSMFD.
- Bohren, C, and D. Huffman. 1983. Absorption and scattering of light by small particles. Wiley Professional Paperback Edition. Wiley-Interscience, New York.
- Bond, T. C., and R. W. Bergstrom. 2006. Light absorption by carbonaceous particles: An investigative review. Aerosol Sci. Technol. 40 (1):27–67. doi:10/1080/02786820500421521.
- Bond, T. C., S. J. Doherty, D. W. Fahey, P. M. Forster, T. Berntsen, B. J. DeAngelo, M. G. Flanner, S. Ghan, B. Kärcher, D. Koch, et al. 2013. Bounding the role of black carbon in the climate system: A scientific assesment. J. Geophys. Res. Atmos. 118 (11):5380–552. doi:10.1002/jgrd.50171.
- Bruggeman, D. A. G. 1937. Berechnung verschiedener physikalischer Konstanten von heterogenen Substanzen. III. Die elastischen Konstanten der quasiisotropen Mischkörper aus isotropen Substanzen. Ann. Phys. 421 (2):160–78. doi:10.1002/andp.19374210205.
- Cereceda-Balic, F., T. Gorena, C. Soto, V. Vidal, M. Lapuerta, and H. Moosmüller. 2019. Optical determination of black carbon mass concentrations in snow samples: A new analytical method. Sci. Total Environ. 697:133934. doi:10.1016/j.scitotenv.2019.133934.
- Cereceda-Balic, F., V. Vidal, H. Moosmüller, and M. Lapuerta. 2018. Reduction of snow albedo from vehicle emissions at Portillo, Chile. Cold Reg. Sci. Technol. 146:43–52. doi:10.1016/j.coldregions.2017.11.008.
- Chang, H., and T. T. Charalampopoulos. 1990. Determination of the wavelength dependence of refractive indices of flame soot. Proc Roy Soc Lond. Ser A 430 (1880):577–91. doi:10.1098/rspa.1990.0107.
- Dalzell, W. H., and A. F. Sarofim. 1969. Optical constants of soot and their application to heat-flux calculations. J. Heat Transf. 91 (1):100–4. doi:10.1115/1.3580063.
- Dobbins, R. A., and C. M. Megaridis. 1991. Absorption and scattering of light by polydisperse aggregates. Appl. Opt. 30 (33):4747–54. doi:10.1364/AO.30.004747.
- Dumont, M., O. Brissaud, G. Picard, B. Schmitt, J. C. Gallet, and Y. Arnaud. 2010. High-accuracy measurements of snow bidirectional reflectance distribution function at visible and NIR wavelengths – comparison with modelling results. Atmos. Chem. Phys. 10 (5):2507–20. doi:10.5194/acp-10-2507-2010.
- Fierz, C. R. L. Armstrong, Y. Durand, P. Etchevers, E. Greene, D. M. McClung, K. Nishimura, P. K. Satyawali, and S. A. Sokratov. 2009. The international classification for seasonal snow on the ground. IHP-VII Technical Documents in Hydrology 83, IACS Contribution N°1, UNESCO-IHP, Paris.
- Flanner, M. G., J. B. Arnheim, J. M. Cook, C. Dang, C. He, X. Huang, D. Singh, S. M. Skiles, C. A. Whicker, and C. S. Zender. 2021. SNICAR-ADv3: a community tool for modeling spectral snow albedo. Geosci. Model Dev. 14 (12):7673–704. doi:10.5194/gmd-14-7673-2021.
- Flanner, M. G., C. S. Zender, P. G. Hess, N. M. Mahowald, T. H. Painter, V. Ramanathan, and P. J. Rasch. 2009. Springtime warming and reduced snow cover from carbonaceous particles. Atmos. Chem. Phys. 9 (7):2481–97. doi:10.5194/acp-9-2481-2009.
- Flanner, M. G., C. S. Zender, J. T. Randerson, and P. J. Rasch. 2007. Present-day climate forcing and response from black carbon in snow. J. Geophys. Res. 112 (D11):D11202. doi:10.1029/2006JD008003.
- Garnett, J. C. M. 1904. Colours in metal glasses and in metallic films. Philos. Trans. Roy. Soc. London. Ser. A. 203:385–420.
- GCM-UCLM. 2022. Grupo de Combustibles y Motores, University of Castilla-La Mancha. https://blog.uclm.es/areammt/rad-soot/.
- Ginot, P., M. Dumont, S. Lim, N. Patris, J. D. Taupin, P. Wagnon, A. Gilbert, Y. Arnaud, A. Marinoni, P. Bonasoni, et al. 2014. A 10 year record of black carbon and dust from a Mera Peak ice core (Nepal): Variability and potential impact on melting of Himalayan glaciers. Cryosphere 8 (4):1479–96. doi:10.5194/tc-8-1479-2014.
- Gmachowski, L. 2002. Calculation of the fractal dimension of aggregates. Colloid Surf. 211 (2–3):197–203. doi:10.1016/S0927-7757(02)00278-9.
- González-Correa, S., D. Gómez-Doménech, R. Ballesteros, M. Lapuerta, D. Pacheco-Ferrada, R. P. Flores, L. Castro, X. Fadic-Ruiz, and F. Cereceda-Balic. 2022. Impact of vehicle soot agglomerates on snow albedo. Atmosphere 13 (5):801. doi:10.3390/atmos13050801.
- Habib, Z. G., and P. Vervisch. 1988. On the refractive index of soot at flame temperature. Combust. Sci. Technol. 59 (4-6):261–74. doi:10.1080/00102208808947100.
- Hadley, O. L., and T. W. Kirchstetter. 2012. Black-carbon reduction of snow albedo. Nature Clim. Change 2 (6):437–40. doi:10.1038/nclimate1433.
- Irvine, W. M., and J. B. Pollack. 1968. Infrared optical properties of water and ice spheres. Icarus 8 (1–3):324–60. doi:10.1016/0019-1035(68)90083-3.
- Jacobi, H. W., S. Lim, M. Ménégoz, P. Ginot, P. Laj, P. Bonasoni, P. Stocchi, A. Marinoni, and Y. Arnaud. 2015. Black carbon in snow in the upper Himalayan Khumbu Valley, Nepal: Observations and modeling of the impact on snow albedo, melting, and radiative forcing. Cryosphere 9 (4):1685–99. doi:10.5194/tc-9-1685-2015.
- Joseph, W. J., J. H. Wiscombe, and J. A. Weinman. 1976. The delta-Eddington approximation for radiative flux transfer. J. Atmos. Sci. 33 (12):2452–9. > 2.0.CO;2. doi:10.1175/1520-0469(1976)033 < 2452:TDEAFR.
- Klein, A. G., and J. Stroeve. 2002. Development and validation of a snow albedo algorithm for the MODIS instrument. Ann. Glaciol. 34:45–52. doi:10.3189/172756402781817662.
- Köylü, U. O., and G. M. Faeth. 1994. Optical prorperties of overfire soot in buoyant turbulent diffusion flames at long residence times. J. Heat Transfer 116 (1):152–9. doi:10.1115/1.2910849.
- Kwiecinska, B., D. G. Murchison, and E. Scott. 1977. Optical properties of graphite. J. Appl. Phys. 109 (3):289–302. doi:10.1111/j.1365-2818.1977.tb01142.x.
- Lakhtakia, C. S., and A. Vikram. 1993. Variations of the effective refractive index of a particulate composite. Opt. Eng. 32 (8):1996–8. doi:10.1117/12.146436.
- Lapuerta, M., R. Ballesteros, and F. J. Martos. 2006. A method to determine the fractal dimension of diesel soot agglomerates. J. Colloid Interface Sci. 303 (1):149–58. doi:10.1016/j.jcis.2006.07.066.
- Lapuerta, M., R. Ballesteros, and F. Martos. 2009. The effect of diesel engine conditions on the size and morphology of soot particles. IJVD. 50 (1/2/3/4):91–106. doi:10.1504/IJVD.2009.024972.
- Lapuerta, M., S. González-Correa, F. Cereceda-Balic, and H. Moosmüller. 2021. Comparison of equations used to estimate soot agglomerate absorption efficiency with the Rayleigh-Debye-Gans approximation. J. Quant. Spectrosc. Radiat. Transf. 262 (107522):107522. doi:10.1016/j.jqsrt.2021.107522.
- Lee, W. S., R. L. Bhawar, M. K. Kim, and J. Sang. 2013. Study of aerosol effect on accelerated snow melting over the Tibetan Plateau during boreal spring. Atmos. Environ. 75:113–22. doi:10.1016/j.atmosenv.2013.04.004.
- Lee, C., and S. Tien. 1981. Optical constants of soot in hydrocarbon flames. Eighteenth Sympos. Int. Combust. 18 (1):1159–66. doi:10.1016/S0082-0784(81)80120-8.
- Liu, D., C. He, J. P. Schwartz, and X. Wang. 2020. Lifecycle of light-absorbing carbonaceous aerosols in the atmosphere. Climate Atmos. Sci. 40:1–18. doi:10.1038/s41612-020-00145-8.
- Lorentz, H. A. 1937. Versuch einer Theorie der electrischen und optischen Erscheinungen in bewegten Körpern. 1–138. Collected Papers: Volume V, Dordrecht: Springer Netherlands.
- Lumme, K., and J. Rahola. 1994. Light scattering by porous dust particles in the discrete-dipole approximation. ApJ. 425:653–67. doi:10.1086/174012.
- Macke, A., J. Mueller, and E. Raschke. 1996. Single scattering properties of atmospheric ice crystals. J. Atmos. Sci. 53 (19):2813–25. doi:10.1175/1520-0469(1996)053 < 2813:SSPOAI>2.0.CO;2.
- Mackowski, D. W. 1995. Electrostatics analysis of radiative absorption by sphere clusters in the Rayleigh limit: application to soot particles. Appl. Opt. 34 (18):3535–45. Doi: 10.1029/95GL00798.
- Manninen, T., K. Anttila, E. Jääskeläinen, A. Riihelä, J. Peltoniemi, P. Räisänen, P. Lahtinen, N. Siljamo, L. Thölix, O. Meinander, et al. 2021. Effect of small-scale snow surface roughness on snow albedo and reflectance. The Cryosphere 15 (2):793–820. doi:10.5194/tc-15-793-2021.
- Marks, D., J. Dozier, and R. E. Davis. 1992. Climate and energy exchange at the snow surface in the Alpine Region of the Sierra Nevada: 1. Meteorological measurements and monitoring. Water Resour. Res. 28 (11):3029–42. doi:10.1029/92WR01482.
- Mishchenko, M. I., A. A. Lacis, B. E. Carlson, and L. D. Travis. 1995. Nonsphericity of dust‐like tropospheric aerosols: Implications for aerosol remote sensing and climate modeling. Geophys. Res. Lett. 22 (9):1077–80. doi:10.1029/95GL00798.
- Moosmüller, H., R. K. Chakrabarty, and W. P. Arnott. 2009. Aerosol light absorption and its measurement: A review. J. Quant. Spectrosc. Radiat. Transf. 110 (11):844–78. doi:10.1016/j.jqsrt.2009.02.035.
- Moosmüller, H., and C. M. Sorensen. 2018. Small and large particle limits of single scattering albedo for homogeneous, spherical particles. J. Quant. Spectrosc. Radiat. Transf. 204:250–5. doi:10.1016/j.jqsrt.2017.09.029.
- Mountain, R. D., and G. W. Mulholland. 1988. Light scattering from simulated smoke agglomerates. Langmuir 4 (6):1321–6. doi:10.1021/la00084a021.
- Naumann, K. H. 2003. COSIMA—a computer program simulating the dynamics. J. Aerosol Sci. 34 (10):1371–97. doi:10.1016/S0021-8502(03)00367-7.
- Painter, T. H., and J. Dozier. 2004. Measurements of the hemispherical-directional reflectance of snow at fine spectral and angular resolution. J. Geophys. Res. 109 (D18):1–21. doi:10.1029/2003JD004458.
- Painter, T. H., K. Rittger, C. McKenzie, P. Slaughter, R. E. Davis, and J. Dozier. 2009. Retrieval of subpixel snow covered area, grain size, and albedo from MODIS. Remote Sens. Environ. 113 (4):868–79. doi:10.1016/j.rse.2009.01.001.
- Patterson, E. M., D. A. Gillette, and B. H. Stockton. 1977. Complex index of refraction between 300 and 700 nm for Saharan aerosols. J. Geophys. Res. 82 (21):3153–60. doi:10.1029/JC082i021p03153.
- Peltoniemi, J. I., M. Gritsevich, T. Hakala, P. Dagsson-Waldhauserová, K. Anttila, H. R. Hannula, N. Kivekäs, H. Lihavainen, O. Meinander, J. Svensson, et al. 2015. Soot on snow experiment: bidirectional reflectance factor measurements of contaminated snow. Cryosphere 9 (6):2323–37. doi:10.5194/tc-9-2323-2015.
- Peltoniemi, J. I., S. Kaasalainen, J. Näränen, L. Matikainen, and J. Piironen. 2005. Measurement of directional and spectral signatures of light reflectance by snow. IEEE Trans. Geosci. Remote Sens. 43 (10):2294–304. doi:10.1109/TGRS.2005.855131.
- Picard, G., Q. Libois, and L. Arnaud. 2016. Refinement of the ice absorption spectrum in the visible using radiance profile measurements in Antarctic snow. The Cryosphere 10 (6):2655–72. doi:10.5194/tc-10-2655-2016.
- Polyanskiy, M. 2021. Refractive Index. INFO, 2008–2020. Accessed December 7, 2021. https://refractiveindex.info/?shelf=main&book=C&page=Djurisic-o
- Pomeroy, J. W, and D. M. Gray. 1995. Snowcover accumulation, relocation, and management. National Hydrology Research Institute Science Report, 7:1–144. Available from National Hydrology Research Institute, Saskatoon, Canada.
- Popovicheva, O., D. Baumgardner, R. Subramanian, G. Kok, R. Cary, E. Vlasenko, T. Khokhlova, N. Shonija, and E. Kireeva. 2011. Tailored graphitized soot as reference material for EC/OC measurement validation. Atmos. Meas. Tech. 4 (5):923–32. doi:10.5194/amt-4-923-2011.
- Prăvălie, R. 2016. Drylands extent and environmental issues. A global approach. Earth. Sci. Rev. 161:259–78. doi:10.1016/j.earscirev.2016.08.003.
- Russo, C., B. Apicella, J. S. Lighty, A. Ciajolo, and A. Tregrossi. 2017. Optical properties of organic carbon and soot produced in an inverse diffusion flame. Carbon 124:372–9. doi:10.1016/j.carbon.2017.08.073.
- Schaepman-Strub, G., M. E. Schaepman, T. H. Painter, S. Dangel, and J. V. Martonchik. 2006. Reflectance quantities in optical remote sensing—definitions and case studies. Remote Sens. Environ. 103 (1):27–42. doi:10.1016/j.rse.2006.03.002.
- Schneider, C. A., W. S. Rasband, and K. W. Eliceiri. 2012. NIH Image to ImageJ: 25 years of image analysis. Nat. Methods. 9 (7):671–5. doi:10.1038/nmeth.2089.
- Shivola, A. 2000. Mixing rules with complex dielectric coefficients. Subsurf. Sens. Technol. Appl. 1 (4):393–415. doi:10.1023/A:1026511515005.
- Skiles, S. M., T. H. Painter, and G. S. Okin. 2017. A method to retrieve the spectral complex refractive index and single scattering optical properties of dust deposited in mountain snow. J. Glaciol. 63 (237):133–47. doi:10.1017/jog.2016.126.
- Smith, A. J. A., and R. G. Grainger. 2014. Simplifying the calculation of light scattering properties for black carbon fractal aggregates. Atmos. Chem. Phys. 14 (15):7825–36. doi:10.5194/acp-14-7825-2014.
- SnowTARTES. 2021. Accessed 7 March 2022. https://snowtartes.pythonanywhere.com/.
- Sorensen, C. M., J. Yon, F. Liu, J. Maughan, W. R. Heinson, and M. J. Berg. 2018. Light scattering and absorption by fractal aggregates including soot. J. Quant. Spectrosc. Radiat. Transf. 217:459–73. doi:10.1016/j.jqsrt.2018.05.016.
- Stagg, B. J., and T. T. Charalampopoulos. 1993. Refractive indices of pyrolytic graphite, amorphous carbon, and flame soot in the temperature range 25° to 600°C. Combust. Flame 94 (4):381–96. doi:10.1016/0010-2180(93)90121-I.
- Tanikawa, T., K. Kuchiki, T. Aoki, H. Ishimoto, A. Hachikubo, M. Niwano, M. Hosaka, S. Matoba, Y. Kodama, Y. Iwata, et al. 2020. Effects of snow grain shape and mixing state of snow impurity on retrieval of snow physical parameters from ground‐based optical instrument. J. Geophys. Res.: Atmos. 125:e2019. JD031858. doi:10.1029/2019JD031858.
- Toon, O. B., C. P. McKay, T. P. Ackerman, and K. Santhanam. 1989. Rapid calculation of radiative heating rates and photodissociation rates in inhomogeneous multiple scattering atmospheres. J. Geophys. Res. 94 (D13):16287–301. doi:10.1029/JD094iD13p16287.
- Wang, Z., C. B. Schaaf, M. J. Chopping, A. H. Strahler, J. Wang, M. O. Román, A. V. Rocha, C. E. Woodcock, and Y. Shuai. 2012. Evaluation of Moderate-resolution Imaging Spectroradiometer (MODIS) snow albedo product (MCD43A) over tundra. Remote Sens. Environ. 117:264–80. doi:10.1016/j.rse.2011.10.002.
- Warren, S. G. 2019. Optical properties of ice and snow. Philos. Trans. R. Soc. Lond., A. 377 (2146):1–17. doi:10.1098/rsta.2018.0161.
- Warren, S. G., and R. E. Brandt. 2008. Optical constants of ice from the ultraviolet to the microwave: A revised compilation. J. Geophys. Res. 113 (D14):1–10. doi:10.1029/2007JD009744.
- Weingartner, E., H. Burtscher, and U. Baltensperger. 1997. Hygroscopic properties of carbon and diesel soot particles. Atmos. Environ. 34 (15):2311–27. doi:10.1016/S1352-2310(97)00023-X.
- Wiscombe, W. J., and J. H. Joseph. 1977. The range of validity of the Eddington approximation. Icarus 32 (3):362–77. doi:10.1016/0019-1035(77)90008-2.
- Wiscombe, W. J., and S. G. Warren. 1980. A model for the spectral albedo of snow. I: pure snow. J. Atmos. Sci. 37 (12):2712–33. doi:10.1175/1520-0469(1980)037 < 2712:AMFTSA>2.0.CO;2.
- Yang, P., and Q. Fu. 2009. Dependence of ice crystal optical properties on particle aspect ratio. J. Quant. Spectrosc. Radiat. Transf. 110 (14–16):1604–14. doi:10.1016/j.jqsrt.2009.03.004.
- Yon, J., A. Bescond, and F. Liu. 2015. On the radiative properties of soot aggregates part 1: Necking and overlapping. J. Quant. Spectrosc. Radiat. Transf. 162:197–206. doi:10.1016/j.jqsrt.2015.03.027.