
 ?Mathematical formulae have been encoded as MathML and are displayed in this HTML version using MathJax in order to improve their display. Uncheck the box to turn MathJax off. This feature requires Javascript. Click on a formula to zoom.
Abstract
Submicron particles are formed during the detonation and deflagration of carbon-rich energetic materials known as high explosives (HE) that can be lofted and transported long distances in the atmosphere. Particles include refractory species like soot, a.k.a. black carbon (BC), and have impacts to climate and human health at local, regional, and global scales. Here, we contrast detonation soot aerosol physical, optical and chemical properties that are formed more efficiently in terms of emission factors and ratios with traditional combustion sources from biomass burning and fossil fuels. We utilize ambient aerosol techniques for the first time to identify soot from two well-known HE's (1) Comp B-3: 40% trinitrotoluene (TNT) and 60% 1,3,5-trinitro-1,3,5-triazinane (RDX) and (2) PBX 9501: 95% 1,3,5,7-tetranitro-1,3,5,7-tetrazoctane (HMX) with 2.5% Estane and a 2.5% mixture of bis(2,2-dinitropropyl)-acetal (BDNPA) and bis(2,2-dinitropropyl)-formal (BDNPF). Size distributions, optical and chemical properties are presented. Aggregate soot had small mobility diameters (<100 nm) and unique optical and chemical signatures depending on the explosive composite composition, detonation atmosphere (e.g., air, argon) and pressure. Single-scattering albedos (SSA) from 0.3 to 0.8 and absorption Angstrom exponents (AAE) from 0.5 to 2.0 measured across 405–870 nm wavelengths depended on the explosive composite composition and detonation conditions. Comp B-3 detonation soot was similar to other combustion soot sources, whereas PBX 9501 soot had high scattering relative to absorption. Carbonaceous chemical signatures included the presence of fullerenes that were distinct from ambient and laboratory-generated soot surrogates and the detection of trace metals, including aluminum, copper, iron, and zinc.
EDITOR:
1. Introduction
1.1. Atmospheric black carbon (BC) aerosol
Condensed-phase carbonaceous particulate matter can be transported long distances in the atmosphere from the emission source. These small particles, known as aerosols, impact air quality, visibility, and human health. Their impacts range from local to global scales also affecting solar radiation, cloud processes, weather and climate. Soot is one type of aerosol that is emitted dominantly from combustion sources and is a major health concern (Pope Citation2000; Davidson, Phalen, and Solomon Citation2005; Highwood and Kinnersley Citation2006) and driver of atmospheric warming (Hansen et al. Citation2000; Jacobson Citation2000; Bond, et al. Citation2013). Soot is defined as a black powdery or flaky substance that consists mostly of amorphous carbon that is produced by incomplete combustion of organic matter. One measurement-based definition of soot within the atmospheric community is known as BC (Lack et al. Citation2014). BC is defined as refractory (vaporizing ∼4000 K) carbon clusters of aggregated spheres that are graphitic in nature (sp2-bonded), insoluble in water and common organic solvents, and strongly absorb visible light with mass absorption coefficients >5 m2 g−1 at 550 nm (Bond et al. Citation2013; Petzold et al. Citation2013). Sometimes BC is referred to as refractory BC (rBC) as well. Throughout the text we will refer to soot when we are talking about the material in general and BC when we are talking about the specific measurement-based definition. BC from natural and anthropogenic sources, such as wildfires, fossil fuel emissions from vehicles, ships, power plants, etc., has been detected in the troposphere and the stratosphere tens of thousands of kilometers from the source (Schwarz et al. Citation2006; Ditas et al. Citation2018; Zheng et al. Citation2020). BC can also contain information about the source of emission and the environment due to its size, optical properties and chemical composition.
The properties of BC sources are dependent upon fuel chemistry, burn conditions and the atmospheric environment. Gas-phase hydrocarbon precursors transition to condensed-phase particles under high temperature conditions, ∼1500 K. Polycyclic aromatic hydrocarbons (PAHs), BC precursors, are formed from gas-phase fuels as well as solid fuels (Glassman and Yetter Citation2008). However, the pathways initiating particle formation and growth are still being elucidated for the most controlled sources, such as diesel engine emissions that are studied in the lab with ethylene-oxygen flames (Musculus, Miles, and Pickett Citation2014). A radical-driven hydrocarbon-clustering mechanism of resonance-stabilized hydrocarbon-radical chain reactions was recently proposed for the nucleation and growth of the primary soot particles (Johansson et al. Citation2018). Aerosol mass spectrometry was used to identify the aggregation known as cluster formation of aromatic and aliphatic cores with hydrogen-to-carbon ratios of ∼2 (Michelsen Citation2017). BC primary particles have been found to have agglomerate diameters of 10−50 nm, with individual core diameters of 1–4 nm (Ishiguro, Takatori, and Akihama Citation1997; Toth et al. Citation2015).
The nucleation of the primary particles, growth and aggregation is more complex for organic combustion sources in the atmosphere than within combustion engines. For example, the aerosol produced from cellulose in wood that burns during wildfires depends largely on the broad range of environmental conditions during combustion, e.g., temperature, pressure, oxygen availability, relative humidity, etc., as well as the type of fuel burned, e.g., grass, shrub, conifer, etc. Since the mechanisms of soot formation are complex, biomass burning has been studied in terms of the amount of particulates produced as either emission factors (per gram of fuel) or emission ratios (ER, relative to CO) for different fuel types and burn conditions (Crutzen and Andreae Citation1990; Delmas, Lacaux, and Brocard Citation1995; Akagi et al. Citation2011). For example, aerosol emission factors per the total mass of fuel burned and BC/CO ratios have been studied for a large range of different natural fuel types (Andreae and Merlet Citation2001; Andreae Citation2019). Physics-based models use these empirical factors to predict the total mass of soot produced for biomass burning sources using the measured emissions from observations for the different fuel types and environmental conditions (Josephson, Linn, and Lignell Citation2018). Thermochemical hydrodynamic codes also exist for the detonation of high explosive (HE) composite emissions (Cowperthwaite and Zwisler Citation1973). However, the chemistry behind the mechanisms and processing of the primary particle formation of BC and other aerosols including organic absorbing species are still being elucidated with observations of microphysical properties (Chakrabarty et al. Citation2010; China et al. Citation2013; Chakrabarty et al. Citation2014; China et al. Citation2015; Chylek et al. Citation2019; Romonosky et al. Citation2019; Lee et al. Citation2020). The state of the science in detonation soot formation chemistry similarly requires more research to understand how HE and environmental conditions influence soot formation and clustering dynamics (Watkins et al. Citation2017).
1.2. Detonation soot and direct aerosol measurements
Detonation soot is of interest to study for unique physical, chemical, and optical signatures that can help elucidate the chemistry of detonations as well as to understand the relevant impacts to climate and human health. Detonation soot has not been historically well-characterized in atmospheric samples as have other sources of ambient soot like combustion from biomass burning and vehicular engines. The ability to detect and attribute the particles to their source and atmospheric formation, growth, and aging processes has been aided over recent decades by the advent of chemical and microphysical in situ sampling. Direct online ambient aerosol techniques developed for climate science are ultra-sensitive with limits of detection (≤1 fg) in addition to providing real-time measurements at high-time resolution (≤1 s) in the atmosphere.
Here, we demonstrate, for the first time, the power of these highly sensitive and selective techniques to identify detonation soot from two HE composites (Comp B-3 and PBX 9501). We harness advancements in aerosol chemistry and real-time measurements that are ultra-sensitive and chemically selective to identify detonation soot. Detonation soot properties are contrasted with traditional combustion soot sources using field-deployable instrumentation.
2. Materials and methods
2.1. Detonation and fullerene soot
Preparations of the HE composites and controlled atmosphere detonations were conducted at Los Alamos National Laboratory. Comp B-3 is composed of 40% trinitrotoluene (TNT) and 60% 1,3,5-trinitro-1,3,5-triazinane (RDX). The polymer-bonded explosive (PBX) 9501 is composed of 95% 1,3,5,7-tetranitro-1,3,5,7-tetrazoctane (HMX), 2.5% Estane and 2.5% of BDNPA/BDNPF. The detonation experimental details under steady conditions are described in Huber et al. (Citation2018). In summary, HE composites were warm-pressed into ∼2.7 g pellets that were epoxied together with Aralhex B (a LANL urethane-based adhesive) to make ∼10.8 g detonation rate sticks. Detonations were initiated using an RP-1 detonator and conducted in a stainless-steel cylinder under air or argon as described in Huber et al. (Citation2018). Argon was used to study reactions in an inert atmosphere to understand the role of the atmospheric gases in soot formation chemistry. Detonation soot was collected by vacuum onto an Ag filter (Huber et al. Citation2018). Fullerene soot was obtained from Alpha Aesar (stock lot #40971, lot #L18U002). Fullerene soot is a laboratory standard comprised of fractal-like aggregates of spherical primary particles with a diameter of ∼50 nm (Moteki et al. Citation2009; Gysel et al. Citation2011). According to the manufacturer, the composition is ≥90% amorphous carbon (carbon black) and ≤10% fullerenes (mostly C60). All samples were atomized (TSI Model 3079 A, TSI Inc., Shoreview, MN, USA) from aqueous and ethanol solutions and dried with a diffusion drier (TSI Model 3062).
2.2. Modeling
The thermochemical equilibrium code TIGER written in FORTRAN IV for calculating the thermodynamic state of heterogeneous systems of known atomic composition was used to model soot production of Comp B-3 and PBX 9501 until equilibrium at standard temperature and pressure regimes was reached (Cowperthwaite and Zwisler Citation1973). TIGER produces the amount of gas-phase and condensed-phase products for detonation events to calculate emission factors and ratios. The standard pressed densities for PBX 9501 and Comp B-3 used as input values were 1.830 and 1.725 g/cc, respectively (Gibbs and Popolato Citation1980). These densities represent the typical densities of prepared charges and not the theoretical maximum density of these compositions. Equilibrium was assumed with no time dependence of the reaction. The reaction was modeled to completion under atmospheric conditions (1 atm in air) with all HE converted to gas-phase products, solid carbon (soot) and liquid water. PBX 9501 reached 34.9 GPa and 3573 K. Comp B-3 reached 27.0 GPa and 3590 K.
2.3. Aerosol instrumentation
2.3.1. Physical properties
A scanning mobility particle sizer (SMPS 3080, TSI Inc., Shoreview, MN, USA) was used to measure the size distribution of the submicron particles. The instrument has been described previously by Wang and Flagan (Citation1990). Particles are classified by electrical mobility using a differential mobility analyzer (DMA, TSI 3081) and counted by a condensation particle counter (CPC 3010). Size distributions are reported from 11 to 478 nm with ±1 standard deviation. Uncertainties in the measurement and inversion process for SMPS data have been quantified using Monte-Carlo simulations by Coquelin et al. (Citation2013).
2.3.2. Optical properties
Scattering and absorption coefficients (βsca and βabs) were measured by a PhotoAcoustic Soot Spectrometer (PASS, Droplet Measurement Technologies, Longmont, CO, USA) at 781, 532, and 405 nm that has been described elsewhere (Arnott, Moosmüller, and Walker Citation2000; Cross et al. Citation2010). Measurements of scattering (βsca) and extinction coefficients (βext) at 450 nm were made by the Cavity-Attenuated Phase Shift-Single Scattering Albedo Particulate Matter (PM) monitor (CAPS-PMSSA, Aerodyne Research, Inc., Billerica, MA, USA) that has been described previously (Onasch, Fortner, et al. Citation2015; Carrico et al. Citation2021). Truncation corrections for the scattering coefficient were not applied since they are only significant (>5%) for particles above 300 nm (Carrico et al. Citation2021). Absorption and extinction (absorption plus scattering) coefficients (βabs and βext) at 870 nm were made by a Photoacoustic Extinctiometer (PAX, Droplet Measurement Technologies, Longmont, CO, USA). Single-scattering Albedo (SSA) is reported from the photoacoustic measurements by summing the scattering and absorption coefficients as shown in EquationEquation (1)(1)
(1) . SSA is also reported directly with the CAPS extinction and scattering measurements.
(1)
(1)
Absorption Angstrom exponent (AAE) is used to describe the wavelength dependence of the aerosol absorption. AAE is calculated using EquationEquation (2)(2)
(2) from the photoacoustic data.
(2)
(2)
2.3.3. Chemistry
The Soot Particle Aerosol Mass Spectrometer (SP-AMS, Aerodyne Research, Inc., Billerica, MA, USA) was used for chemical composition and was run with the laser and thermal vaporizer (600° C) as has been described previously (Onasch et al. Citation2012; Avery et al. Citation2021). The instrument is selective for species that absorb the 1064 nm Nd:YAG laser wavelength and vaporize, such as particles containing BC. Chemical analysis was performed with the AMS analysis software (Squirrel version 1.60 F and Pika version 1.20 F) developed for SP-AMS analysis within Igor Pro (Wavemetrics, Inc.). Uncertainties in the peak fitting are <10% (Drewnick et al. 2004). Standard fragmentation table corrections were used (Allan et al. Citation2004).
2.4. Metal analysis
Roughly 100 mg detonation soot samples were dissolved by alternating the addition of ultra-high purity HNO3 and HCl (Optima, Fisher) while heating. A total of five HNO3/HCl cycles were performed on all samples. Once dissolved, samples were heated to dryness and brought up in adequate volumes of 3 M HNO3 to make solutions of 10 mg detonation soot per gram of solution. Any remaining insoluble carbonaceous material was transferred to the final solution and care was taken not to disturb it while taking aliquots. Inductively coupled plasma–optical emission spectroscopy (ICP-OES, iCAP 7600, Thermo Fisher Scientific, USA) was used to determine the presence and concentration of trace metals. Metal concentrations were determined through serial dilutions of samples and comparison to an in-house mixture of similar element standards (SPEX CertiPrep) to minimize matrix interferences. Uncertainties in the measurement technique are <4% for all samples and elements due to triplicate analysis of each aliquot.
3. Results and discussion
3.1. Fuel chemistry
HE detonations form submicron soot via shock-driven decomposition of HE above the speed of sound. The oxygen and nitrogen are supplied by the HE for the experiments in argon in contrast to combustion and the detonation experiments in air. Similar to controlled combustion soot, HE detonation soot also has aggregate structure with internal cores <10 nm in diameter but can also include nanodiamond cores (Greiner et al. Citation1988; Chen, Huang, and Yun Citation2003; Watkins et al. Citation2017). The leading detonation wave, known as the von Neumann (VN) spike is the highest pressure that will be reached during a detonation. Behind the VN spike is the chemical reaction zone (CRZ), where the HE is reduced to atoms and fragments before forming new carbon allotropes. At the end of the CRZ is the Chapman–Jouguet (CJ) state. The chemical reaction zone during a detonation reaches higher temperatures and pressures during the rapid shock-driven decomposition than combustion. When HE fails to detonate but still undergoes chemical reaction below the speed of sound, it is known as deflagration. In this sense, combustion reactions are considered deflagrations. shows the carbon phase diagram including the CJ pressures for two HE's, Composition B-3 and PBX 9501. Comp B-3 is composed of 40% trinitrotoluene (TNT) and 60% of 1,3,5-trinitro-1,3,5-triazinane (RDX) by weight. PBX 9501 is composed of 95% 1,3,5,7-tetranitro-1,3,5,7-tetrazoctane, octogen (HMX), 2.5% of a thermoplastic polyurethane (Estane® 5703) and 2.5% of a nitroplasticizer (50/50 wt% eutectic mixture of bis(2,2-dinitropropyl)-acetal (BDNPA) and bis(2,2-dinitropropyl)-formal (BDNPF; Gibbs and Popolato Citation1980). Also included in this Figure is the range of temperature and pressure for combustion fuels, e.g., ethylene flame, diesel engine and biomass burning. Combustion fuels undergo reaction under atmospheric pressure, ∼1 atm (10–4 GPa), whereas HE's reach much greater pressures, ∼25 − 35 Gpa, during detonation. HE's are organic in composition, but the solid phase products differ from those produced by combustion sources since detonation soot and other products are formed in high temperature and pressure regimes. The temperature range of the reactions are similar for HE's and some combustion sources that reach 3000 K, but combustion often occurs as low as 300 K. Using the thermochemical equilibrium code TIGER, the modeled Comp B-3 detonation reached temperatures of 3573 K and PBX 9501 peaked at 3590 K. The final state of Comp B-3 includes the production of nanodiamond due to the TNT while PBX 9501 is not known to form nanodiamond (Watkins et al. Citation2017). Soot, including graphite, is formed outside and behind the shock front region.
Figure 1. (a) CJ pressure–temperature phase diagram showing detonation pressure in PBX-9501 and Composition B-3 compared to the regime for standard fuel combustion. (b) Molecular structure of explosives Composition B-3 and PBX 9501 alongside non-explosive ethylene and cellulose.
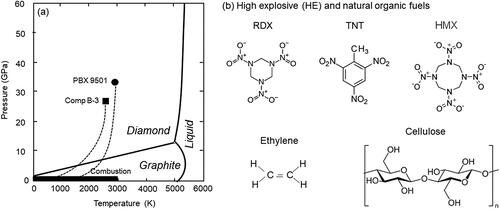
Similar to wood comprised of cellulose and other organics, the HE materials studied here are also organic, although some can be made with metals such as ammonium nitrate mixed with aluminum. HE composites examined here contain carbon, hydrogen, nitrogen, and oxygen. They differ from biomass burning fuels in that they have high concentrations of nitrogen. The three dominant HE molecules studied here, RDX, TNT, and HMX are included in along with ethylene and cellulose that represent combustion fuel molecular formulas.
The elemental composition in terms of oxygen-to-carbon (O/C) ratios is similar for HE and biomass burning fuels such as cellulose. For example, cellulose has an O/C ratio of 0.83, and TNT has an O/C ratio of 0.85. Atmospheric science also analyzes O/C ratios of aerosol particles produced from the combustion of biomass and fossil fuels (Aiken et al. Citation2008). Particulate O/C ratios are used to understand the extent of oxidation particles have undergone in the atmosphere, since the oxygen content of organic aerosols increases with age due to oxidation in the atmosphere (Jimenez et al. Citation2009). Similarly, HE's are analyzed for their oxidative potential by their oxygen balance percentage (OB%) as shown in EquationEquation (3)(3)
(3) .
(3)
(3)
The formula is based on the molecular weight and number of C, H, and O atoms present in the initial HE. HE's with higher OB% (less negative) produce more gas products than solid carbon products because the more oxygen that is present the more CO, CO2, H2O, NO, etc., can be formed (Ornellas Citation1982). shows the elemental ratios and OB% for the fuels studied here as were calculated in TIGER. The OB% for Comp B-3 is −42.58, which is less than PBX 9501 that is −21.62. Therefore, Comp B-3 has a lower OB% and is expected to be less efficient at forming gas-phase products than PBX 9501, and more efficient at forming leftover solid-phase products like soot. We also calculated OB% for combustion fuels. As to be expected, biomass burning fuels have significantly lower OB% values than the HE's, ranging from −118.52 to −225.71 for the examples listed in . OB% for wood is approximated assuming 42% mass cellulose, 25% pentose, and 33% lignin. Since fossil fuels do not contain oxygen, e.g., ethylene (C2H4), we did not include them in the table. Ethylene has a similar H/C value to some of the HE's in the table at 2, an O/C value of 0 and a calculated OB% of −342.86.
Table 1. Fuel chemistry of HE composite and biomass burning fuels including elemental ratios and oxygen balance.
Modeled equilibrium equations for detonations only include solid-phase carbon, a.k.a. soot. However, the chemical components of the solid-phase product that can form aerosol when lofted in the atmosphere are more complex due to the composition of the vessel, confiner and detonators that the detonation wave inherently interacts with that can incorporate the metals from those components into the detonation soot. For example, Huber et al. (Citation2018) found the presence of metals and metal oxides in the detonation soot from Comp B-3. Organics (CHNO) plus metals; e.g., Al, Zn, Pb, etc., and metal oxides have been detected with the submicron soot produced from HE detonations using offline analysis techniques (Firestone et al. Citation2018; Huber et al. Citation2018; Ringstrand et al. Citation2018).
3.2. Soot emissions
Investigation into the ability of different fuels and conditions to form soot are reported in atmospheric science in terms of emission factors (EF) when the fuel mass is available, and more commonly as ER. summarizes literature values of soot emissions from different combustion sources, including fossil fuel and biomass burning as well as the results from our TIGER calculations of the 2 HE's studied here. Missing values for fossil fuels were not provided in the literature. Soot and CO(g) production from HE materials was modeled using thermochemical equilibrium codes that predict the total g kg−1 of carbon produced for each HE, which were significantly higher than traditional combustion sources.
Table 2. Soot emission factors and ERs from different combustion and detonation sources.
Soot emission factors ranged from 5 mg soot/kg fuel for efficient light duty vehicles to 2.48 g soot/kg fuel for the high end of diesel engine vehicles. EF's from biomass burning fuels were higher than the fossil fuel sources, except for the high end of diesel vehicles, ranging from 0.42 to 0.53 g soot per kg fuel. Soot emission factors were calculated in TIGER to be 127.2 g/kg HE for Comp B-3 and 84.6 g/kg HE for PBX 9501, orders of magnitude higher than the emission factors from both vehicle emissions and biomass burning sources, equating to ∼10% of the original mass of fuel. HE detonation soot production is a fast process that uses internal oxygen that is fuel limited. This is in contrast to combustion and wildfire processes that are slower and steady with a constant supply of oxygen that facilitates production of CO2 and CO with much less soot and smoke. However, uncertainties still exist in the soot formation chemistry in TIGER that are being improved in newer models (Ticknor, Andrews, and Leiding Citation2020). Carbon behavior is subject to kinetic formation and behavior. We also used LANL's thermo-chemical code magpie (Ticknor, Andrews, and Leiding Citation2020) to monitor the amount of carbon produced in the Comp B-3 mixture starting at the CJ state following the isentrope to atmospheric pressure. This gave us a simple procedure to estimate the carbon mass fraction produced. The results of magpie produced 12% carbon by mass fraction at the CJ state, very similar to the TIGER output that are reported in . The mass fraction lowered upon release after the CJ state and then increased back to 12% at around 1 atm. We stress that this is only an estimate, and we do not anticipate this to be quantitatively correct, but it is a good estimate.
In addition to EF's, we also report the ER of soot to CO(g) for fossil fuels and natural fuels. We were not able to report ER's due to the uncertainty in the amount of CO(g) produced by TIGER in comparison with experimental results. More study is warranted to determine robust ER's for HE as are routinely reported for combustion sources. ER's are measured as the enhancement of a species over the background levels, e.g., ERX = ΔX/ΔCO. ER's vary depending on the burn conditions as well as the fuel type. Combustion sources have a large range of Δsoot/ΔCO ER reported in the literature, ranging from 1.1 to 7.6 (g/kg). Soot ER's for soot produced per mass of CO generated was not robust for HE's since the CO(g) produced is less than 1% of the total yield. However, this is a known deficiency of the TIGER model as Ornellas (Citation1982) measured CO and CO2, and found significant CO for Comp B-3. The measured soot emission factor from the experimental results was 39 g soot kg−1 fuel, which was lower than what is computed in TIGER at 127.2 g soot kg−1 fuel. Newer and more complex thermochemical equation of state models have improved chemical kinetics for soot formation and agree better with experimental results, but still produce high fractions of soot compared to combustion (Ticknor, Andrews, and Leiding Citation2020, Reeves et al. Citation2018; Bagge-Hansen et al. Citation2019; Hammons et al. Citation2020; Hammons et al. Citation2021). The soot ER to CO found by Ornellas (Citation1982) was 512 g soot kg−1 CO. While the production of CO found in the experiments was much higher than biomass burning sources, the efficiency of soot formation was still much greater in the model and experiments. The high soot emission factor and soot/CO ratio produced by HE could be used to differentiate soot sources from combustion versus detonation in the atmosphere.
Modified Combustion Efficiency, MCE = ΔCO2/(ΔCO + ΔCO2), is used in atmospheric sciences to describe the environmental burn conditions, with values closer to one representing more flaming combustion. Smoldering combustion is thought to produce MCE values <0.9 (Reid et al. Citation2005). Since minimal CO is produced for HE in the TIGER model, MCE values were equivalent to ∼1, equating to flaming conditions for the production of detonation soot. However, the MCE in the experimental results from Ornellas (Citation1982) found an MCE of 0.61 due to the higher emission of CO(g) in the experiments as compared to the model. Similar to soot ER, more research is needed to determine the MCE's for HE detonations.
3.3. Physical properties
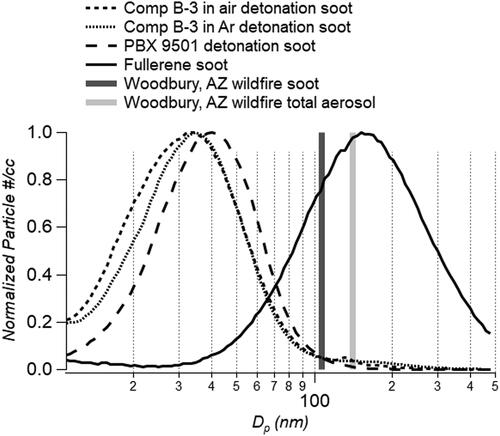
Fresh soot from modern combustion engines is comprised of particles below 100 nm diameter in volume equivalent diameter (Liggio et al. Citation2012) and mobility diameter (Maricq Citation2014). Wildfire soot, including the core plus the shell, are often larger in diameter due to inefficient combustion conditions and fuel types. Urban sources on average have soot mean number size distributions that peak between 60 and 70 nm mass mean diameter while biomass burning diameters are ∼120 nm mass mean diameter (Bond, et al. Citation2013). Most biomass burning plumes have single lognormal modes with total volumetric mean size distributions that peak at ∼300 nm diameter (Froyd et al. Citation2019; Brock et al. Citation2021). Soot core volume equivalent diameters sampled during the Woodbury wildfire that had been aged for approximately two days in the atmosphere were on average 107 nm in number diameter with the total submicron aerosol mean number diameter at 140 nm (Lee et al. Citation2020). Other wildfires have reported similar results (Schwarz et al. Citation2006; Schwarz et al. Citation2008; Sedlacek et al. Citation2012). shows HE aerosol size distributions were similar to soot sampled from fresh combustion sources. The detonation soot sampled from Comp B-3 and PBX 9501 had particle mean number diameters significantly below 100 nm, indicating more efficient chemical reactions. Comp B-3 mean diameter was slightly smaller than PBX 9501 diameter at 37.9 ± 2.6 and 41.3 ± 8.9 nm, respectively. Comp B-3 soot in air also had a second size distribution peaking at 130 nm. In comparison, laboratory-generated fullerene soot had a mean core diameter size of 165.0 ± 26.8 nm, shown in black in . Detonation soot mean number size distributions were smaller than combustion sources, including urban sources, vehicular emissions and biomass burning.
Figure 2. Mobility size distributions of HE detonation soot, laboratory-generated fullerene soot and ambient mean diameters from the Woodbury wildfire.
Small-angle X-ray scattering (SAXS) and transmission electron microscopy (TEM) by Huber et al. (Citation2018) provide further insight on the morphology of the detonation soot produced by Comp B-3 detonation soot in air and argon atmospheres. Huber et al. (Citation2018) showed that the samples in air have a different structure than the samples in argon. The samples in air were well-represented by a core-shell spherical form while the argon atmosphere samples were highly agglomerated and lack a shell-like structure. TEM confirmed lamellar shells with internal voids for the air samples and elongated carbon structures that lack internal voids. SAXS was also performed on PBX 9501 detonation soot which showed that the particles produced have a smooth agglomerate surface with no fractal-like agglomeration. SEM imagery was also performed, showing the presence of metals in the soot. Copper and zinc from detonators was identified as well as aluminum from the detonation containers that were coated with carbon. Variation in carbon morphology was also found with Comp B-3 detonation soot having smaller average particle sizes than PBX 9501, similar to our results.
3.4. Optical properties
Optical properties of laboratory-generated fullerene soot were contrasted with detonation soot and are shown in . Comp B-3 soot SSA and AAE's were typical of BC while the PBX 9501 soot fell within a grey carbon aerosol type (Chylek et al. Citation2019; Romonosky et al. Citation2019) likely indicating the presence of coatings on the BC cores. The SSA of the fullerene soot sampled here was typical of nascent or fresh soot, having SSA's between 0.30 and 0.42 across wavelengths from 405 nm to 870 nm. Comp B-3 detonation soot in air and argon environments both had similar SSA to fresh soot with values between 0.27 and 0.50. In contrast, PBX 9501 detonation soot had a significantly higher SSA with values between 0.57 and 0.79 from 405 nm to 870 nm. In the shorter wavelengths, 405 to 781 nm, PBX 9501 detonation soot SSA values were consistently high for a soot source at 0.77 ± 0.01. At the longest wavelength sampled, 870 nm, PBX 9501 detonation soot SSA was the lowest sampled at 0.57 ± 0.13, closer to the values measured for the Comp B-3 detonation soot. This decreasing SSA at longer wavelengths is uncommon for a soot sample. Based on the measurements made here the PBX 9501 sample could have thick coatings on the soot due to the high scattering relative to absorption in the visible region or could include brown carbon that has a strong wavelength dependence as well.
Figure 3. (a) SSA and (b) AAE of detonation soot compared with laboratory fullerene soot standard. Error bars denote standard deviation of the means.
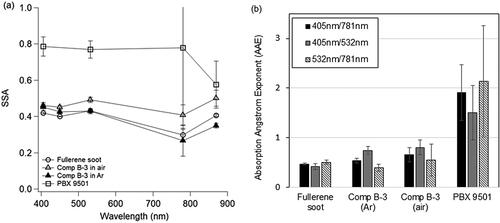
Fullerene soot and detonation soot AAE's measured by photoacoustic spectroscopy are shown in . AAE781 nm/405 nm values for fullerene soot were 0.46 ± 0.02 and 0.50 ± 0.03 for AAE781 nm/532 nm. Comp B-3 detonation soot in air and argon were similar to each other and the fullerene soot. Averaged Comp B-3 for air and argon had AAE781 nm/405 nm values of 0.46 ± 0.09, and AAE781 nm/532 nm had values of 0.59 ± 0.19. As was true for the SSA, the PBX 9501 detonation soot was also different from the Comp B-3 in terms of the AAE. PBX 9501 detonation soot had AAE's more typical of brown carbon absorption where there is a strong wavelength dependence instead of being wavelength independent as is typical for ambient and fresh soot samples. PBX 9501 detonation soot AAE405 nm/781 nm was 1.90 ± 0.56, and AAE532 nm/781 nm was 2.13 ± 1.12. Cazorla et al. (Citation2013) define soot-dominated samples as having AAE values between 0 to 1 while Romonosky et al. (Citation2019) and Chylek et al. (Citation2019) include values up to 1.7 based on Mie theory. All of the samples here fell within the AAE limits except for the PBX 9501 samples, which had AAE's >1.
Overall, the PBX 9501 detonation soot were outliers in that they scattered significantly more than the other samples, which were dominated by absorption in terms of extinction contribution, SSA, and AAE values ∼1, typical for BC samples. The PBX 9501 detonation soot was mostly scattering, and only weakly absorbing with a wavelength dependence more typical of other absorbing species.
3.5. Chemistry
3.5.1. Mass spectral signatures
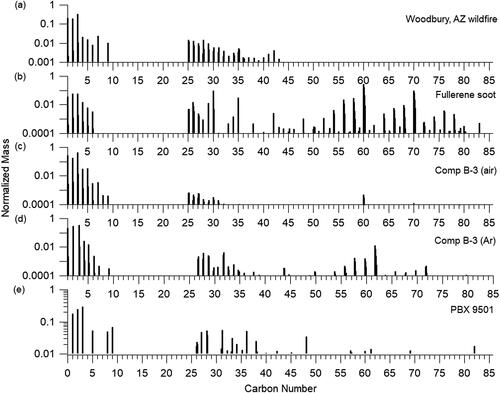
shows the organic mass spectral signatures up to m/z 115 for the Woodbury wildfire, fullerene soot, and the three detonation soot samples. The Woodbury biomass burning aerosol has significant signal from oxygen-containing ions, explicitly at m/z 28 (27.995) and 44 (43.989) due to CO+ and CO2+. These signals are prominent in Oxygenated Organic Aerosol, OOA (Zhang et al. Citation2005; Zhang et al. Citation2007; Ng et al. Citation2010).
Figure 4. Organic mass spectral signatures from the (a) Woodbury, AZ wildfire, (b) fullerene soot, and detonation soot from (c) Comp B-3 in air, (d) Comp B-3 in argon, and (e) PBX 9501. Signals are normalized to one for the highest peak signal.
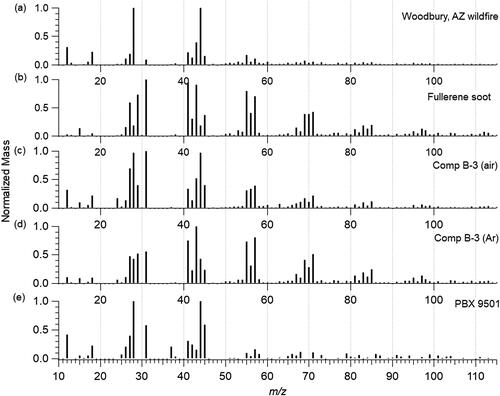
Both Comp B-3 detonation soot in air and argon include appreciable signal at m/z 55 (exact mass: 55.055) and 57 (57.07), as is seen in primary hydrocarbon-like organic aerosol (HOA) due to ions C4H7+ and C4H9+, respectively (Zhang et al. Citation2005). Signals at m/z 69 (69.070) and 71 (71.086) are also present due to C5H9+ and C4H11+ in both Comp B-3 samples that are also indicative of HOA. The main difference is that Comp B-3 detonation soot in air includes significant signal due to oxygen in the mass spectrum seen at m/z 28 (27.995) and 44 (43.989) due to CO+ and CO2+ that are less prevalent in the Comp B-3 detonation soot in argon. This is similar to results from Huber et al. (Citation2018) in which C-O bonds were found at the surface of the soot for the experiments in air, while oxygen was not present for the experiments in argon. Signal at m/z 31 (31.018) is also prevalent in both due to CH3O+. The argon sample also includes higher signals at m/z 41 (41.039) and 43 (43.055) due to C3H5+ and C3H7+, both of which are higher than the signals at m/z 55 and 57 which are dominant in HOA. The lack of CO and CO2+ in the Comp B-3 in argon sample with the higher presence of m/z 41 and 43 could be used to identify the different environments of the explosions. PBX 9501 detonation soot does not include high HOA signals like the Comp B-3 data, which could be explained by the higher oxygen content in PBX 9501. The highest signal in the PBX 9501 sample is at m/z 28 and 44, which could include signal from the gas-phase (Allan et al. Citation2004). The next largest signal is at m/z 41.039 from C3H5+ similar to the Comp B-3 in argon sample. HOA fragment ions are included but are not the largest sampled.
Another type of aerosol that can be identified using mass spectral signatures are biomass burning particles. The presence of levoglucosan has been used on filters by gas chromatography-mass spectrometry for a long time. More recently, the main fragment of levoglucosan has been identified using electron impact aerosol mass spectrometry at m/z 60 to identify primary biomass burning aerosol (Aiken et al. Citation2009; Cubison et al. Citation2011). The mass spectral signature from the Woodbury plume does not include a high m/z 60 due to the amount of oxidation that has occurred in the atmosphere as this sample was aged approximately two days since emission (Lee et al. Citation2020). It is significant yet unsurprising to note that none of the detonation soot samples include appreciable signal at m/z 60. Other single-particle methods for biomass burning identification use a combination of potassium and organic markers with a lack of crustal, marine, and industrial metals (Hudson et al. Citation2004). Potassium sources can confound bulk measurements (Legrand et al. Citation2016; Sullivan et al. Citation2019), and are not used here.
3.5.2. Carbon ion clusters
shows the carbon ion series for all samples. All samples have high signals for the carbon ion series in general, with the most at m/z 36 (C3+). Carbon ion series for the SP-AMS have been defined previously (Corbin et al. Citation2014; Onasch, Fortner, et al. Citation2015). All samples had appreciable signal for the low-Cx+ ion series (C1-5), defined as rBC at m/z 12 − 60. The mid-carbon series, C6-31, from m/z 72 − 372 represents 2-D linear chain and ring structures. The mid-carbon ion series is not as prevalent but is still detectable in all samples. The fullerene soot differentiates from the Woodbury plume in the largest signal at m/z 720 due to C60+ from the fullerene parent ion. Doubly charged fullerene ions are present at C30+ and C35+ within the fullerene standard and both Comp B-3 detonation soot. The high-carbon series C32-82, from m/z 384 − 984 includes the 3-D fullerene ions. The structure of fullerene ions is seen clearly in the fullerene soot sample, with the highest signal at C60+. This structure is not seen in the Woodbury wildfires plume but is present in the detonation soot samples. The Comp B-3 detonation soot in argon has the highest signals for fullerene ions. The fullerene ion signals are also discernable in the Comp B-3 detonation soot in air. The PBX 9501 detonation soot is most likely signal limited but does show carbon ions detected in this range.
Figure 5. Carbon ion clusters (Cx+ family) from the (a) Woodbury, AZ wildfire, (b) fullerene soot, and detonation soot from (c) Comp B-3 in air, (d) Comp B-3 in argon, and (e) PBX 9501. Signals are normalized to one for the highest peak signal.
3.5.3. Trace metal analysis
High-energy diffraction has been used previously for the detection of metal and metal oxides occurring in detonation soot due to metal components in the explosion that include brass and stainless steel from the detonators. Huber et al. (Citation2018) detected the presence of copper, zinc, and their metal oxides in Comp B-3 detonation soot in air and argon. The sample in argon detected the metals while the sample in air detected metal oxides. Here, we used ICP-OES to detect ten different metals in the detonation soot samples as shown in .
Figure 6. Metal content in HE detonation soot as detected by ICP-OES.
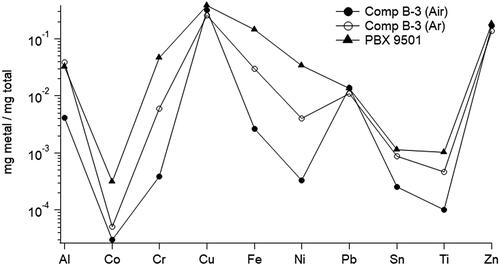
The main components of stainless steel (iron, chromium, and nickel) were detected in all of the detonation soot samples as were those of brass (copper, zinc, aluminum, iron, lead, arsenic, nickel, and titanium). Copper and zinc were present in the highest concentrations, on average 0.36 ± 0.09 and 0.17 ± 0.03 mg metal per mg total soot from all samples. The ratio on average of copper to zinc in all samples was 2.02 ± 0.17 similar to that of brass used in the detonator caps. In addition to the metals present in stainless steel and brass, trace quantities of cobalt, 0.11 ± 0.13 µg/mg, and tin, 0.68 ± 0.39 µg/mg, were also detected. The SP-AMS was also able to detect metals, including copper, zinc, aluminum and nickel by the presence of metal and metal oxide ions. However, the amount was not quantified with comparison to the ICP-OES data since the samples included coarse soot in addition to the submicron soot sampled by the SP-AMS.
4. Conclusions
To study climate impacts, soot size, mass, and number concentrations are measured in real-time from aircraft and ground sites. Their long-range transport in the troposphere and stratosphere from large fuel and energetic sources, such as wildfires and oil fires, has been observed over distances of thousands of kilometers and timelines of weeks to months (Middlebrook et al. Citation2012; Zheng et al. Citation2020). Chemical and microphysical properties of ambient soot particles depend on fuel, source conditions, and the environment. These dependencies are well-characterized for biomass burning and fossil fuel combustion. In contrast, analogous dynamic aerosol processes of explosions and high fluence fires have been less well-studied. Here, we contrasted detonation soot physical, optical and chemical properties with biomass burning and fossil fuel emission sources that have been more extensively studied over the last decade. Detonation soot properties were analyzed using online field-deployable aerosol instrumentation.
We harness recent advancements in aerosol chemistry and real-time measurements that are ultra-sensitive and to identify detonation soot. Detonation soot was sampled from the detonation of HE composites using online aerosol techniques for the first time. Comp B-3 and PBX 9501 detonation soot were compared with laboratory-generated fullerene soot and previously published combustion soot from biomass burning. Detonation soot is similar in size (<100 nm) to fresh efficient combustion engines and is smaller than biomass burning soot. Optically, fuel efficient HE composites like PBX 9501 produce coated soot that are highly scattering in the visible (SSA ∼ 0.8). The SSA of Comp B-3 detonation soot ranges between 0.3 and 0.5 for the wavelengths sampled, which is similar to nascent or primary combustion soot that has not aged in the atmosphere. Overall, the Comp B-3 detonation soot is similar to soot from combustion sources, whereas the soot from PBX 9501 is different, having a high SSA ∼0.8 and AAE's above 1, potentially indicating the presence of coatings that may include brown carbon or metal on the cores that should be a subject for future work. We found that the SSA of PBX 9501 detonation soot was higher than that of Comp B-3 detonation soot at all wavelengths (even with the large uncertainties at 780 and 870 nm). PBX 9501 detonation at higher temperatures and pressures and higher oxygen balance than Comp B-3 resulted in different detonation physicochemical regimes that were responsible for this finding. The higher SSA was also consistent with the chemical analysis discussed later that showed that the fullerene cluster ion signals were high for Comp B-3 detonation soot and below the detection limit for PBX 9501 detonation soot. PBX 9501 detonation soot also did not include high hydrocarbon-like organic aerosol signals like the Comp B-3 detonation soot, which could be explained by the higher oxygen content in PBX 9501 detonation soot shown in m/z 27 and 43. The Comp B-3 detonation soot in argon had the highest signal for fullerene ions. The fullerene ion signals were also discernable in the Comp B-3 detonation soot in air. The PBX 9501 detonation soot is most likely signal-limited but does show carbon ions detected in this range. Chemically, the mass spectral signatures include typical rBC masses as well as 2-D and 3-D carbon structures as was found previously using SAXS. Organic hydrocarbon signatures were also seen as well as the presence of metals, including aluminum, copper, iron, lead, nickel, and zinc that have been measured by offline techniques as well as the online aerosol instrumentation used here. Our study provides new information on detonation soot that can be used to identify ignition sources using soot measurements that are used in the atmospheric analysis of soot from wildfire and fossil fuel combustion for climate and health.
| Nomenclature | ||
| BDNPA | = | bis(2,2-dinitropropyl)-acetal |
| BDNPF | = | bis(2,2-dinitropropyl)-formal |
| Comp B-3 | = | Composition B-3 |
| HE | = | high explosive |
| HMX | = | 1,3,5,7-Tetranitro-1,3,5,7-tetrazoctane, High Melting eXplosive, octogen |
| MW | = | molecular weight |
| OB | = | oxygen balance |
| PBX | = | plastic-bonded explosive |
| PBX 9501 | = | Plastic-bonded explosive 9501 |
| RDX | = | 1,3,5-trinitro-1,3,5-triazinane, Research Department eXplosive |
| TNT | = | trinitrotoluene |
Acknowledgments
The authors thank Todd Williamson and Patrick Bowden for discussions and advice on detonation soot production and analysis. We thank P. Bowden, A. Cartelli, E. Francois, L. Gibson, S. Jackson, and S. Vincent for shot assembly and detonation support. Research presented in this article was supported by the Laboratory Directed Research and Development program of Los Alamos National Laboratory under project numbers (LANL No. 20150050DR and 20200035DR). Los Alamos National Laboratory is operated by Triad National Security, LLC for the National Nuclear Security Administration of the U.S. Department of Energy under contract No. 89233218CNA000001.
Declaration of interest statement
Combustion soot has been historically well-studied, while detonation soot has not. Here we apply modern analytical aerosol techniques to three HE detonation soot samples to identify signatures that can be detected in the field. Detonation soot is formed at much higher temperatures and pressures than traditional combustion soot sources, yet has similarities in the size, optical properties and chemistry. Here, we exploit modern online field-deployable aerosol instrumentation to characterize detonation soot. Of the detonation soot sampled here, a large range in optical properties were observed, indicating the breadth of detonation soot signatures possible in the atmosphere due to the different HEs used and the conditions of the detonation.
Additional information
Funding
References
- Aiken, A. C., P. F. DeCarlo, J. H. Kroll, D. R. Worsnop, J. A. Huffman, K. S. Docherty, I. M. Ulbrich, C. Mohr, J. R. Kimmel, D. Sueper, et al. 2008. O/C and OM/OC Ratios of primary, secondary, and ambient organic aerosols with high-resolution time-of-flight aerosol mass spectrometry. Environ. Sci. Technol. 42 (12):4478–85. doi:10.1021/es703009q.
- Aiken, A. C., D. Salcedo, M. J. Cubison, J. A. Huffman, P. F. DeCarlo, I. M. Ulbrich, K. S. Docherty, D. Sueper, J. R. Kimmel, D. R. Worsnop, et al. 2009. Mexico City aerosol analysis during MILAGRO using high resolution aerosol mass spectrometry at the urban supersite (T0) – Part 1: Fine particle composition and organic source apportionment. Atmos. Chem. Phys. 9 (17):6633–53. and doi:10.5194/acp-9-6633-2009.
- Akagi, S. K., R. J. Yokelson, C. Wiedinmyer, M. J. Alvarado, J. S. Reid, T. Karl, J. D. Crounse, and P. O. Wennberg. 2011. Emission factors for open and domestic biomass burning for use in atmospheric models. Atmos. Chem. Phys. 11 (9):4039–72. doi:10.5194/acp-11-4039-2011.
- Allan, J. D., A. E. Delia, H. Coe, K. N. Bower, M. R. Alfarra, J. L. Jimenez, A. M. Middlebrook, F. Drewnick, T. B. Onasch, M. R. Canagaratna, et al. 2004. A generalised method for the extraction of chemically resolved mass spectra from Aerodyne aerosol mass spectrometer data. J. Aerosol Sci. 35 (7):909–22. doi:10.1016/j.jaerosci.2004.02.007.
- Andreae, M. O. 2019. Emission of trace gases and aerosols from biomass burning – an updated assessment. Atmos. Chem. Phys. 19 (13):8523–46. doi:10.5194/acp-19-8523-2019.
- Andreae, M. O, and P. Merlet. 2001. Emission of trace gases and aerosols from biomass burning. Global Biogeochem. Cycles 15 (4):955–66. doi:10.1029/2000GB001382.
- Arnott, W. P., H. Moosmüller, and J. W. Walker. 2000. Nitrogen dioxide and kerosene-flame soot calibration of photoacoustic instruments for measurement of light absorption by aerosols. Rev. Sci. Instrum. 71 (12):4545. doi:10.1063/1.1322585.
- Avery, A. M., L. R. Williams, E. C. Fortner, W. A. Robinson, and T. B. Onasch. 2021. Particle detection using the dual-vaporizer configuration of the soot particle Aerosol Mass Spectrometer (SP-AMS). Aerosol Sci. Technol. 55 (3):254–67. doi:10.1080/02786826.2020.1844132.
- Bagge-Hansen, M., S. Bastea, J. A. Hammons, M. H. Nielsen, L. M. Lauderbach, R. L. Hodgin, P. Pagoria, C. May, S. Aloni, A. Jones, et al. 2019. Detonation synthesis of carbon nano-onions via liquid carbon condensation. Nat. Commun. 10 (1):3819. doi:10.1038/s41467-019-11666-z.
- Bond, T. C., et al. 2013. Bounding the role of black carbon in the climate system: A scientific assessment. JGR Atmospheres. 118:5380–552.
- Brock, C. A., K. D. Froyd, M. Dollner, C. J. Williamson, G. Schill, D. M. Murphy, N. J. Wagner, A. Kupc, J. L. Jimenez, P. Campuzano-Jost, et al. 2021. Ambient aerosol properties in the remote atmosphere from global-scale in situ measurements. Atmos. Chem. Phys. 21 (19):15023–63. doi:10.5194/acp-21-15023-2021.
- Carrico, C. M., T. J. Capek, K. J. Gorkowski, J. T. Lam, S. Gulick, J. Karacaoglu, J. E. Lee, C. Dungan, A. C. Aiken, T. B. Onasch, et al. 2021. Humidified single-scattering albedometer (H-CAPS-PMSSA): Design, data analysis, and validation. Aerosol Sci. Technol. 55 (7):749–20. doi:10.1080/02786826.2021.1895430.
- Cazorla, A., R. Bahadur, K. J. Suski, J. F. Cahill, D. Chand, B. Schmid, V. Ramanathan, and K. A. Prather. 2013. Relating aerosol absorption due to soot, organic carbon, and dust to emission sources determined from in-situ chemical measurements. Atmos. Chem. Phys. 13 (18):9337–50. doi:10.5194/acp-13-9337-2013.
- Chakrabarty, R. K., N. D. Beres, H. Moosmuller, S. China, C. Mazzoleni, M. K. Dubey, L. Liu, and M. I. Mishchenko. 2014. Soot superaggregates from flaming wildfires and their direct radiative forcing. Sci. Rep. 4:5508. doi:10.1038/srep05508.
- Chakrabarty, R. K., H. Moosmüller, L. W. A. Chen, K. Lewis, W. P. Arnott, C. Mazzoleni, M. K. Dubey, C. E. Wold, W. M. Hao, and S. M. Kreidenweis. 2010. Brown carbon in tar balls from smoldering biomass combustion. Atmos. Chem. Phys. 10 (13):6363–70. doi:10.5194/acp-10-6363-2010.
- Chen, P., F. Huang, and S. Yun. 2003. Characterization of the condensed carbon in detonation soot. Carbon 41 (11):2093–9. doi:10.1016/S0008-6223(03)00229-X.
- China, S., G. Kulkarni, B. V. Scarnato, N. Sharma, M. Pekour, J. E. Shilling, J. Wilson, A. Zelenyuk, D. Chand, S. Liu, et al. 2015. Morphology of diesel soot residuals from supercooled water droplets and ice crystals: implications for optical properties. Environ. Res. Lett. 10 (11):114010. doi:10.1088/1748-9326/10/11/114010.
- China, S., C. Mazzoleni, K. Gorkowski, A. C. Aiken, and M. K. Dubey. 2013. Morphology and mixing state of individual freshly emitted wildfire carbonaceous particles. Nat. Commun. 4:2122. doi:10.1038/ncomms3122.
- Chylek, P., J. E. Lee, D. E. Romonosky, F. Gallo, S. Lou, M. Shrivastava, C. M. Carrico, A. C. Aiken, and M. K. Dubey. 2019. Mie scattering captures observed optical properties of ambient biomass burning plumes assuming uniform black, brown, and organic carbon mixtures. J. Geophys. Res. Atmos. 124 (21):11406–27. doi:10.1029/2019JD031224.
- Coquelin, L., N. Fischer, C. Motzkus, T. Mace, F. Gensdarmes, L. Le Brusquet, and G. Fleury. 2013. Aerosol size distribution estimation and associated uncertainty for measurement with a Scanning Mobility Particle Sizer (SMPS). J. Phys: Conf. Ser. 429:12018. doi:10.1088/1742-6596/429/1/012018.
- Corbin, J. C., B. Sierau, M. Gysel, M. Laborde, A. Keller, J. Kim, A. Petzold, T. B. Onasch, U. Lohmann, and A. A. Mensah. 2014. Mass spectrometry of refractory black carbon particles from six sources: carbon-cluster and oxygenated ions. Atmos. Chem. Phys. 14 (5):2591–603. doi:10.5194/acp-14-2591-2014.
- Cowperthwaite, M, and W. H. Zwisler. 1973. TIGER Computer Program Documentation. SRI Publication No. 2106, Stanford Research Institute, Menlo Park, CA, USA.
- Cross, E. S., T. B. Onasch, A. Ahern, W. Wrobel, J. G. Slowik, J. Olfert, D. A. Lack, P. Massoli, C. D. Cappa, J. P. Schwarz, et al. 2010. Soot particle studies—instrument inter-comparison—project overview. Aerosol Sci. Technol. 44 (8):592–611. doi:10.1080/02786826.2010.482113.
- Crutzen, P. J, and M. O. Andreae. 1990. Biomass burning in the tropics: Impact on atmospheric chemistry and biogeochemical cycles. Science 250 (4988):1669–78. doi:10.1126/science.250.4988.1669.
- Cubison, M. J., A. M. Ortega, P. L. Hayes, D. K. Farmer, D. Day, M. J. Lechner, W. H. Brune, E. Apel, G. S. Diskin, J. A. Fisher, et al. 2011. Effects of aging on organic aerosol from open biomass burning smoke in aircraft and laboratory studies. Atmos. Chem. Phys. 11 (23):12049–64. doi:10.5194/acp-11-12049-2011.
- Davidson, C. I., R. F. Phalen, and P. A. Solomon. 2005. Airborne particulate matter and human health: A review. Aerosol Sci. Technol. 39 (8):737–49. doi:10.1080/02786820500191348.
- Delmas, R., J. Lacaux, and D. Brocard. 1995. Determination of biomass burning emission factors: Methods and results. Environ. Monit. Assess. 38 (2/3):181–204. doi:10.1007/BF00546762.
- Ditas, J., N. Ma, Y. Zhang, D. Assmann, M. Neumaier, H. Riede, E. Karu, J. Williams, D. Scharffe, Q. Wang, et al. 2018. Strong impact of wildfires on the abundance and aging of black carbon in the lowermost stratosphere. Proc Natl Acad Sci U S A 115 (50):E11595–E11603.
- Firestone, M. A., B. Ringstrand, B. Mogavero, J. T. Despard, K. Kelso, R. L. Gustavsen, D. M. Dattelbaum, D. W. Podlesak, and S. Seifert. 2018. Aqueous density fractionation of nanocarbons from colliding-wave PBX9502 detonation soot.
- Forestieri, S. D., S. Collier, T. Kuwayama, Q. Zhang, M. J. Kleeman, and C. D. Cappa. 2013. Real-time black carbon emission factor measurements from light duty vehicles. Environ. Sci. Technol. 47 (22):13104–12. doi:10.1021/es401415a.
- Froyd, K. D., D. M. Murphy, C. A. Brock, P. Campuzano-Jost, J. E. Dibb, J.-L. Jimenez, A. Kupc, A. M. Middlebrook, G. P. Schill, K. L. Thornhill, et al. 2019. A new method to quantify mineral dust and other aerosol species from aircraft platforms using single-particle mass spectrometry. Atmos. Meas. Tech. 12 (11):6209–39. doi:10.5194/amt-12-6209-2019.
- Gibbs, T. R, and A. Popolato. 1980. LASL Explosive Property Data. Berkeley, CA, USA: University of California Press.
- Glassman, I, and R. A. Yetter. 2008. Combustion. Burlington, MA, USA: Academic Press.
- Greiner, N. R., D. S. Phillips, J. D. Johnson, and F. Volk. 1988. Diamonds in detonation soot. Nature 333 (6172):440–2. doi:10.1038/333440a0.
- Gysel, M., M. Laborde, J. S. Olfert, R. Subramanian, and A. J. Gröhn. 2011. Effective density of Aquadag and fullerene soot black carbon reference materials used for SP2 calibration. Atmos. Meas. Tech. 4 (12):2851–8. doi:10.5194/amt-4-2851-2011.
- Hammons, J. A., M. H. Nielsen, M. Bagge-Hansen, S. Bastea, C. May, W. L. Shaw, A. Martin, Y. Li, N. Sinclair, L. M. Lauderbach, et al. 2021. Submicrosecond aggregation during detonation synthesis of nanodiamond. J. Phys. Chem. Lett. 12 (22):5286–93. doi:10.1021/acs.jpclett.1c01209.
- Hammons, J. A., M. H. Nielsen, M. Bagge-Hansen, L. M. Lauderbach, R. L. Hodgin, S. Bastea, L. E. Fried, M. R. Cowan, D. A. Orlikowski, and T. M. Willey. 2020. Observation of variations in condensed carbon morphology dependent on Composition B detonation conditions. Prop, Explos, Pyrotech. 45 (2):347–55. doi:10.1002/prep.201900213.
- Hansen, J., M. Sato, R. Ruedy, A. Lacis, and V. Oinas. 2000. Global warming in the twenty-first centrury: An alternative scenario. Proc. Natl. Acad. Sci. U S A 97 (18):9875–80. doi:10.1073/pnas.170278997.
- Highwood, E. J, and R. P. Kinnersley. 2006. When smoke gets in our eyes: The multiple impacts of atmospheric black carbon on climate, air quality and health. Environ. Int. 32 (4):560–6. doi:10.1016/j.envint.2005.12.003.
- Huber, R. C., B. S. Ringstrand, D. M. Dattelbaum, R. L. Gustavsen, S. Seifert, M. A. Firestone, and D. W. Podlesak. 2018. Extreme condition nanocarbon formation under air and argon atmospheres during detonation of composition B-3. Carbon 126:289–98. doi:10.1016/j.carbon.2017.10.008.
- Hudson, P. K., D. M. Murphy, D. J. Cziczo, D. S. Thomson, J. A. de Gouw, C. Warneke, J. Holloway, H.-J. Jost, and G. Hübler. 2004. Biomass-burning particle measurements: Characteristic composition and chemical processing. J. Geophys. Res. 109 (D23):1–11. doi:10.1029/2003JD004398.
- Ishiguro, T., Y. Takatori, and K. Akihama. 1997. Microstructure of diesel soot particles probed by electron microscopy: First observation of inner core and outer shell. Combust. Flame 108 (1-2):231–4. doi:10.1016/S0010-2180(96)00206-4.
- Jacobson, M. Z. 2000. A physically-based treatement of elemental carbon optics: Implications for global direct forcing of aerosols. Geophys. Res. Lett. 27 (2):217–20. doi:10.1029/1999GL010968.
- Jimenez, J. L., M. R. Canagaratna, N. M. Donahue, A. S. H. Prevot, Q. Zhang, J. H. Kroll, P. F. DeCarlo, J. D. Allan, H. Coe, N. L. Ng, E., et al. 2009. Evolution of organic aerosols in the atmosphere. Science 326 (5959):1525–9. and doi:10.1126/science.1180353.
- Johansson, K. O., M. P. Head-Gordon, P. E. Schrader, K. R. Wilson, and H. A. Michelsen. 2018. Resonance-stabilized hydrocarbon-radical chain reactions may explain soot inception and growth. Science 361 (6406):997–1000. doi:10.1126/science.aat3417.
- Josephson, A. J., R. R. Linn, and D. O. Lignell. 2018. Modeling soot formation from solid complex fuels. Combust. Flame 196:265–83. doi:10.1016/j.combustflame.2018.06.020.
- Lack, D. A., H. Moosmuller, G. R. McMeeking, R. K. Chakrabarty, and D. Baumgardner. 2014. Characterizing elemental, equivalent black, and refractory black carbon aerosol particles: a review of techniques, their limitations and uncertainties. Anal. Bioanal. Chem. 406 (1):99–122. doi:10.1007/s00216-013-7402-3.
- Lee, J. E., M. K. Dubey, A. C. Aiken, P. Chylek, and C. M. Carrico. 2020. Optical and chemical analysis of absorption enhancement by mixed carbonaceous aerosols in the 2019 Woodbury, AZ, Fire Plume. Journal of Geophysical Research: Atmospheres 125 (15)
- Legrand, M., J. McConnell, H. Fischer, E. W. Wolff, S. Preunkert, M. Arienzo, N. Chellman, D. Leuenberger, O. Maselli, P. Place, et al. 2016. Boreal fire records in Northern hemisphere ice cores: A review. Clim. Past 12 (10):2033–59. doi:10.5194/cp-12-2033-2016.
- Liggio, J., M. Gordon, G. Smallwood, S. M. Li, C. Stroud, R. Staebler, G. Lu, P. Lee, B. Taylor, and J. R. Brook. 2012. Are emissions of black carbon from gasoline vehicles underestimated? Insights from near and on-road measurements. Environ. Sci. Technol. 46 (9):4819–28. doi:10.1021/es2033845.
- Maricq, M. M. 2014. Examining the relationship between black carbon and soot in flames and engine exhaust. Aerosol Sci. Technol. 48 (6):620–9. doi:10.1080/02786826.2014.904961.
- Michelsen, H. A. 2017. Probing soot formation, chemical and physical evolution, and oxidation: A review of in situ diagnostic techniques and needs. Proc. Combust. Inst. 36 (1):717–35. doi:10.1016/j.proci.2016.08.027.
- Middlebrook, A. M., D. M. Murphy, R. Ahmadov, E. L. Atlas, R. Bahreini, D. R. Blake, J. Brioude, J. A. de Gouw, F. C. Fehsenfeld, G. J. Frost, et al. 2012. Air quality implications of the Deepwater horizon oil spill. Proc. Natl. Acad. Sci. U S A 109 (50):20280–5. doi:10.1073/pnas.1110052108.
- Moteki, N., Y. Kondo, N. Takegawa, and S-i Nakamura. 2009. Directional dependence of thermal emission from nonspherical carbon particles. J. Aerosol Sci. 40 (9):790–801. doi:10.1016/j.jaerosci.2009.05.003.
- Musculus, M. P. B., P. C. Miles, and L. M. Pickett. 2014. Conceptual models for partially premixed low-temperature diesel combustion. Prog. Energy Combust. Sci. 41:94. doi:10.1016/j.pecs.2013.12.001.
- Ng, N. L., M. R. Canagaratna, Q. Zhang, J. L. Jimenez, J. Tian, I. M. Ulbrich, J. H. Kroll, K. S. Docherty, P. S. Chhabra, R. Bahreini, et al. 2010. Organic aerosol components observed in Northern hemispheric datasets from Aerosol Mass Spectrometry. Atmos. Chem. Phys. 10 (10):4625–41. doi:10.5194/acp-10-4625-2010.
- Onasch, T. B., E. C. Fortner, A. M. Trimborn, A. T. Lambe, A. J. Tiwari, L. C. Marr, J. C. Corbin, A. A. Mensah, L. R. Williams, P. Davidovits, et al. 2015. Investigations of SP-AMS carbon ion distributions as a function of refractory black carbon particle type. Aerosol Sci. Technol. 49 (6):409–22. doi:10.1080/02786826.2015.1039959.
- Onasch, T. B., P. Massoli, P. L. Kebabian, F. B. Hills, F. W. Bacon, and A. Freedman. 2015. Single scattering Albedo monitor for airborne particulates. Aerosol Sci. Technol. 49 (4):267–79. doi:10.1080/02786826.2015.1022248.
- Onasch, T. B., A. Trimborn, E. C. Fortner, J. T. Jayne, G. L. Kok, L. R. Williams, P. Davidovits, and D. R. Worsnop. 2012. Soot particle aerosol mass spectrometer: Development, validation, and initial application. Aerosol Sci. Technol. 46 (7):804–17. doi:10.1080/02786826.2012.663948.
- Ornellas, D. L. 1982. Calorimetric determinations of the heat and products of detonation for explosives: October 1961 to April 1982. Report UCRL-52821, Lawrence Livermore Laboratory.
- Petzold, A., A. Döpelheuer, C. A. Brock, and F. Schröder. 1999. In situ observations and model calculations of black carbon emission by aircraft at cruise altitude. J. Geophys. Res. 104 (D18):22171–81. doi:10.1029/1999JD900460.
- Petzold, A., J. A. Ogren, M. Fiebig, P. Laj, S. M. Li, U. Baltensperger, T. Holzer-Popp, S. Kinne, G. Pappalardo, N. Sugimoto, et al. 2013. Recommendations for reporting "black carbon" measurements. Atmos. Chem. Phys. 13 (16):8365–79. doi:10.5194/acp-13-8365-2013.
- Pope, C. A. 2000. What do epidemiologic findings tell us about health effects of environmental aerosols? J. Aerosol Med. 13 (4):335–54. doi:10.1089/jam.2000.13.335.
- Reeves, R. V., G. C. Egan, G. L. Klunder, M. R. Manaa, and S. Bastea. 2018. An experimental characterization of condensed phase soot from overdriven detonation of composition B. AIP Conference Proceedings 1979 (100033):1–7.
- Reid, J., R. Koppmann, T. Eck, and D. Eleuterio. 2005. A review of biomass burning emissions part II: intensive physical properties of biomass burning particles. Atmos. Chem. Phys. 5 (3):799–825. doi:10.5194/acp-5-799-2005.
- Ringstrand, B. S., B. Mogavero, J. T. Despard, M. Firestone, and D. Podlesak. 2018. Discontinuous density gradient fractionation of detonation soot for complete nanocarbon characterization.
- Romonosky, D. E., S. L. Gomez, J. Lam, C. M. Carrico, A. C. Aiken, P. Chylek, and M. K. Dubey. 2019. Optical properties of laboratory and ambient biomass burning aerosols: Elucidating black, brown, and organic carbon components and mixing regimes. J. Geophys. Res. Atmos. 124 (9):5088–105. doi:10.1029/2018JD029892.
- Schwarz, J. P., R. S. Gao, D. W. Fahey, D. S. Thomson, L. A. Watts, J. C. Wilson, J. M. Reeves, M. Darbeheshti, D. G. Baumgardner, G. L. Kok, et al. 2006. Single-particle measurements of midlatitude black carbon and light-scattering aerosols from the boundary layer to the lower stratosphere. J. Geophys. Res. 111 (D16):1–15. doi:10.1029/2006JD007076.
- Schwarz, J. P., R. S. Gao, J. R. Spackman, L. A. Watts, D. S. Thomson, D. W. Fahey, T. B. Ryerson, J. Peischl, J. S. Holloway, M. Trainer, et al. 2008. Measurement of the mixing state, mass, and optical size of individual black carbon particles in urban and biomass burning emissions. Geophys. Res. Lett. 35 (13):1–10. doi:10.1029/2008GL033968.
- Sedlacek, A. J., E. R. Lewis, L. Kleinman, J. Xu, and Q. Zhang. 2012. Determination of and evidence for non-core-shell structure of particles containing black carbon using the Single-Particle Soot Photometer (SP2). Geophys. Res. Lett. 39 (6):1–6. doi:10.1029/2012GL050905.
- Sullivan, A. P., H. Guo, J. C. Schroder, P. Campuzano‐Jost, J. L. Jimenez, T. Campos, V. Shah, L. Jaeglé, B. H. Lee, F. D. Lopez‐Hilfiker, et al. 2019. Biomass burning markers and residential burning in the WINTER aircraft campaign. J. Geophys. Res. Atmos. 124 (3):1846–61. doi:10.1029/2017JD028153.
- Ticknor, C., S. A. Andrews, and J. A. Leiding. 2020. Magpie: A new thermochemical code. AIP Conference Proceedings.
- Toth, P., A. B. Palotas, T. A. Ring, E. G. Eddings, R. Vander Wal, and J. S. Lighty. 2015. The effect of oxidation pressure on the equilibrium nanostructure of soot particles. Combust. Flame 162 (6):2422–30. doi:10.1016/j.combustflame.2015.02.009.
- Wang, S. C., and R. C. Flagan. 1990. Scanning Electrical Mobility Spectrometer. Aerosol Sci. Technol. 13 (2):230–40. doi:10.1080/02786829008959441.
- Watkins, E. B., K. A. Velizhanin, D. M. Dattelbaum, R. L. Gustavsen, T. D. Aslam, D. W. Podlesak, R. C. Huber, M. A. Firestone, B. S. Ringstrand, T. M. Willey, et al. 2017. Evolution of carbon clusters in the detonation products of the Triaminotrinitrobenzene (TATB)-based explosive PBX 9502. J. Phys. Chem. C 121 (41):23129–40. doi:10.1021/acs.jpcc.7b05637.
- Yu, Z., L. D. Ziemba, T. B. Onasch, S. C. Herndon, S. E. Albo, R. Miake-Lye, B. E. Anderson, P. L. Kebabian, and A. Freedman. 2011. Direct measurement of aircraft engine soot emissions using a cavity-attenuated phase shift (CAPS)-based extinction monitor. Aerosol Sci. Technol. 45 (11):1319–25. doi:10.1080/02786826.2011.592873.
- Zavala, M., L. T. Molina, T. I. Yacovitch, E. C. Fortner, J. R. Roscioli, C. Floerchinger, S. C. Herndon, C. E. Kolb, W. B. Knighton, V. H. Paramo, et al. 2017. Emission factors of black carbon and co-pollutants from diesel vehicles in Mexico City. Atmos. Chem. Phys. 17 (24):15293–305. doi:10.5194/acp-17-15293-2017.
- Zhang, Q., M. R. Alfarra, D. R. Worsnop, J. D. Allan, H. Coe, M. R. Canagaratna, and J. L. Jimenez. 2005. Deconvolution and quantification of hydrocarbon-like and oxygenated organic aerosols based on aerosol mass spectrometry. Environ. Sci. Technol. 39:4938–4952.
- Zhang, Q., J. L. Jimenez, M. R. Canagaratna, J. D. Allan, H. Coe, I. Ulbrich, M. R. Alfarra, A. Takami, A. M. Middlebrook, Y. L. Sun, et al. 2007. Ubiquity and dominance of oxygenated species in organic aerosols in anthropogenically-influenced Northern Hemisphere midlatitudes. Geophys. Res. Lett. 34 (13):n/a–/a. n/a-n/a. doi:10.1029/2007GL029979.
- Zheng, G., A. J. Sedlacek, A. C. Aiken, Y. Feng, T. B. Watson, S. Raveh-Rubin, J. Uin, E. R. Lewis, and J. Wang. 2020. Long-range transported North American wildfire aerosols observed in marine boundary layer of eastern North Atlantic. Environ. Int. 139:105680. doi:10.1016/j.envint.2020.105680.