
 ?Mathematical formulae have been encoded as MathML and are displayed in this HTML version using MathJax in order to improve their display. Uncheck the box to turn MathJax off. This feature requires Javascript. Click on a formula to zoom.
Abstract
Particle deposition can occur at several locations of ventilation ducts, including straight region and bend region, where could be a reservoir for microbes and affect the air quality of the built environment. Recently, an energy-efficient air cleaning technique was proposed by mounting washable patterned substrates on the ventilation ducting systems. The patterned surfaces act as a filter and enhance particle deposition, but the deposition has been mainly studied for the straight ducting with fully developed turbulent flow. In this work, the particle deposition study on patterned surface is extended to bend regions where the turbulent flow is not fully developed. The deposition rates of submicron- and micron-particles with seven particle sizes (0.1, 0.3, 0.5, 1.0, 2.0, 3.0, and 5.0 μm) on patterned bends were calculated. Bends of 45°, 60°, 90°, 150°, and 180° were numerically investigated. It was found that the non-dimensional deposition velocity for the patterned bend duct of obtuse angles is larger than that of acute angles. The deposition velocity of the patterned bends is not as large as a high-grade filter, but the enhanced pressure drop caused by the patterned bend regions is much lower than the filter, thus achieving the same magnitude of overall efficiency. Given the fact that the patterned surfaces can be easily cleaned and reused, they are suitable to be installed at both bend regions and straight duct as a technique of regular duct cleaning and a supplementary air cleaning technique in ventilation ducting systems.
Copyright © 2022 American Association for Aerosol Research
EDITOR:
1. Introduction
The aerosol deposition onto a surface from a turbulent flow has been extensively studied in the past few decades due to its significance in numerous applications. In early applications, the need to control micro-contamination in microelectronics and modern electronic products has generated considerable interest (Cooper Citation1986). Accumulation of dust may reduce the heat dissipation from electronic components and cause localized hot spots (Garimella and Schlitz Citation1995). The study of aerosol deposition can help to decrease the dust accumulation around tiny electronic components. This has led to a significant rise of studies in preventing micro-contamination from submicron aerosol particles in these devices (Cheong Citation1997; De Bellis and Catalano Citation2012; Ma et al. Citation2015). Another emerging application field in recent years is respiratory disease transmission through aerosol (Piri et al. Citation2021; Xu et al. Citation2021; Dai and Zhao Citation2022; Wang et al. Citation2022). The relationship between exposure to airborne particles and infection has received considerable attention in the 2019 novel coronavirus (Li et al. Citation2020). Coronavirus is believed to be transmitted from person-to-person through large respiratory droplets (Chan et al. Citation2020). Other routes include the inhalation of aerosols when the aerosol-generating procedures were taken by human activities (Huang et al. Citation2020) and hand touching on facial membranes (Kanamori Citation2021). Sufficient evidence demonstrates that the ventilation and air movements in built environment can help the spread of aerosols and enhance the disease transmission (Li et al. Citation2007; Wu, Leung, and Leung Citation2020; Azimi et al. Citation2021; Cheng et al. Citation2022).
Aerosols are transported by a ventilation ducting system which pumps fresh outdoor air into a building and recirculates the contaminated indoor air due to human activity or particle resuspension (McQuiston, Parker, and Spitler Citation2004; Li et al. Citation2007; Sundell et al. Citation2011; Qian, Peccia, and Ferro Citation2014; Chen et al. Citation2020). Therefore, in the transportation process the airborne aerosols deposit at various places in a ventilation ducting system. When the flow paths through branches or bends of the ventilation ducts, the flow dynamics are more complex, causing a higher deposition rate, compared with the straight duct area. For example, Sippola and Nazaroff (Citation2005) studied the deposition of particles with 1–16 μm diameter at S-connectors, bends, and straight ducts with developing and fully developed turbulent flow. They concluded that the measured deposition rates on these places with a developing condition were greater than the deposition rates in a fully developed flow. The possible deposition mechanisms can be due to impaction at the S-connectors or bend regions. Sun, Lu, and Jiang (Citation2012) numerically studied the particle deposition velocities in bends and straight ducts. Results indicated that the deposition velocity on bends were one or two orders of magnitude higher than that in straight ducts. They suggested a general idea of “in bends and behind bends” to explain the enhanced particle deposition by the bends. The total deposition rate induced by the bends was mainly caused by the deposition behind bends. Sun et al. (Citation2013) further experimentally studied the particle deposition on 90° bends by measuring the particle concentration at the inlet and outlet. They concluded that the dominant mechanism for deposition velocity enhancement was the impaction of the particles on the outer bend wall. The deposition velocity for smaller particles was higher than that in straight ducts, but the total deposition rate was enhanced mainly by larger particles. Jiang, Lu, and Sun (Citation2011) found that particles of a smaller size can passed through the 90° bend, while larger particles mostly accumulated on the outer bend, as indicated by their developed computational fluid dynamics (CFD) model. Based on these studies, it can be seen that a 90° bend region has a higher deposition rate due to inertial impaction, compared with the straight duct. Indeed, the cleaning of the bend regions of the ventilation duct is relatively difficult compared with the straight duct (Meng et al. Citation2015). Therefore, further studies are needed to understand the particle deposition and cleaning of bend regions which may serve as a reservoir for the microbe to proliferate.
In addition, particle deposition is enhanced in straight duct by the surface structures which introduce disturbance for the boundary layer and enhance deposition rate. Lai, Byrne, and Goddard (Citation1999) used neutron activation analysis to investigate the particle deposition from turbulent flow on smooth and 2 D ribbed surfaces. The monodisperse tracer particles with diameter of 0.7–7.1 µm were studied. The particle deposition enhancement on the ribbed surface was as high as seven times compared with a smooth surface. Lai, Byrne, and Goddard (Citation2001, Citation2002) also studied particle deposition enhancement on three-dimensional arrays of square ribs with the height of 6 mm in turbulent flow. The enhancement ratio can be as high as 20 for 0.7 µm particles. They found that three-dimensional ribs can achieve a much higher particle deposition enhancement than a 2-D ribbed surface. Nunayon, Zhang, and Lai (Citation2018) studied deposition enhancement for ultrafine particles by twisted tape. They measured particle concentration at the upstream and downstream of the twisted tape to monitor the decrease of particle concentration over time. The duct with twisted tape had a higher particle deposition velocity ratio (3.3 times) than the smooth duct.
Inspired by the particle enhancement due to surface structure, our group recently proposed to attach a patterned substrate on a ventilation duct as an air cleaning technique (Xu et al. Citation2020a). Particle deposition on semi-circular patterned surfaces with different pitch-to-height ratios in a turbulent flow was investigated. By considering both particle separation from air and pressure drop, it was found that the semi-circular patterns with different pitch-to-height ratios achieved 7–8 times enhancement of the energy efficiency compared with a HEPA filter. In addition, the proposed patterned surface can be easily removed out of the ventilation duct for regular cleaning. Our previous work focused on the submicron particle deposition on the patterned surface in a straight ventilation duct. It is expected that the patterned surface at bend regions may also enhance the particle deposition and achieve the same magnitude of overall efficiency. Installing washable patterned surface possibly both avoids the difficulty of directly cleaning the bend regions and work as a supplementary air cleaning technology by enhancing particle deposition. Thus, in this work, the objective is to extend the air cleaning strategy proposed in our previous work to the bend regions of the ventilation duct. The patterned surface is placed on the bend regions with different bend degrees (45°, 60°, 90°, 120°, 150°, and 180°). This work also extends the study of particle deposition on bend smooth duct to various angle degrees, other than 90°. Numerical method is employed to study the deposition rate of submicron- and micron- particles (0.1–5 µm in diameter) at the smooth and patterned bend regions. The numerical model is the same as our previous work and has been validated with both benchmark cases and experimental results in previous work (Xu et al. Citation2020b). The patterns’ pitch-to-height ratio (p/e) and different bend angles are important in the deposition process. The pitch (p) represents the offset between two semi-circular ribs, and the height (e) represents the radius of the semi-circular pattern. Based on our previous optimization studies (Xu et al. Citation2020a, Citation2020b), semi-circular patterned ribs are employed, and the height (or radii) of the ribs is chosen to be 2000 µm, and the p/e is 3 in this study.
2. Methodology
2.1. Numerical setup and geometries for different degree bend ducts
Particle deposition in 2-D bend ducts with the angle of 45°, 60°, 90°, 120°, 150°, and 180° was simulated in this work. The software ANSYS Fluent 16.0 was employed to solve the continuous air phase and the particle movement. The Reynolds stress turbulent model (RSM) coupled with enhanced wall treatment was used to reproduce the instantaneous anisotropic turbulent flow (Tian and Ahmadi Citation2007). The one-way coupled Lagrangian method with a discrete random walk model was used to track the movement of each released particle. The governing equations for the mass and momentum EquationEquations (1)(1)
(1) and Equation(2)
(2)
(2) were solved for air phase.
(1)
(1)
(2)
(2)
The instantaneous fluid velocity was reproduced to solve particle trajectories by one-way Lagrangian approach. It was calculated as the sum of mean fluid velocity () and fluctuating velocity (
).
(3)
(3)
The turbulence eddy was determined by the Gaussian distributed random velocity fluctuations
and
in three directions.
(4)
(4)
where
is a random number between 0 and 1 following the normal distribution, the other term is the local root mean square value of the velocity fluctuations. Tian and Ahmadi (Citation2007) and Zhang and Chen (Citation2009) found that the turbulent velocity fluctuation in the wall-normal direction is critical on particle deposition velocity. Thus, a near wall correction was employed to the boundary layer of
(5)
(5)
where
and
A was chosen as 0.008 based on the DNS results of Ounis, Ahmadi, and McLaughlin (Citation1991). So, the near-wall turbulence kinetic energy was altered as follows and applied to the first two layers of the mesh next to the wall.
(6)
(6)
The predicted normal component of Reynolds stress term by EquationEquation (4)(4)
(4) was improved and the particle deposition velocity was more reasonable as indicated by Lai and Chen Citation2006.
The particle-particle interaction was not considered in this work. It was assumed that the airflow was not affected by the particle due to the small volume of particles compared with the continuous air phase. The Lagrangian discrete phase model (DPM) was employed to track the particle movement. The drag force, gravitational force, Brownian force, and lift force were considered and exerted onto particles.
(7)
(7)
For the submicron-sized particles, the drag force, was calculated by the Stokes’s law as follows.
(8)
(8)
The coefficient, is the Cunningham correction
(9)
(9)
where
is the air molecular mean free path with the value of 0.067 µm.
For the micron-sized particles, the drag force, was calculated by the form of Stokes’s law as follows.
(10)
(10)
where
is the drag coefficient and
is the Reynolds number of the particle.
(11)
(11)
(12)
(12)
The Brownian force, was given by the equation as follows.
(13)
(13)
where is zero-mean unit-variance-independent Gaussian random number,
is the spectral intensity given by the equation as follows.
(14)
(14)
where is the gas constant with value of 1.38 × 10⁻²³, T is the absolute temperature of air with value of 288 K in this work,
is the density of particle with value of 2450 kg/m3. The Saffman’s lift force of particles is defined by Saffman (Citation1965).
Experimental data of particle deposition in a fully developed straight duct in previous work was employed to validate the numerical modeling in this work (Xu et al. Citation2020a). The height and width of the wind tunnel duct were 20 mm and 200 mm, respectively. The width to height ratio was 10, which indicated that the flow field in wind tunnel can be regarded as a 2-D fluid flow (Mehta and Bradshaw Citation1979). The ribbed surfaces employed in the experiment also had the 2-D patterns. Thus, the 2-D numerical simulation was conducted in this work. The schematic of the computational domains for ducts of different bend angles are given in , and the patterned surface was located at the bend region. The surface patterns with the height of 2000 µm and the pitch-to-height ratio (p/e) of 3 were studied. The dynamic viscosity of air phase was 1.789 × 10⁻⁵ N·s/m2, and density was 1.225 kg/m3 at isothermal temperature of 288 K. The Reynolds number based on average velocity in the centerline and channel height was 7989. No-slip and adiabatic boundary conditions were applied at the wall. The second-order upwind scheme was used to solve the momentum equations and transport equations related with the Reynolds stress turbulent model (RSM).
Figure 1. Schematic of computational domain of different degree bend duct: (a) 45°, (b) 60°, (c) 90°, (d) 120°, (e) 150°, and (f) 180°. The bend ducts are at the vertical direction. The legend color represents air velocity (m/s).
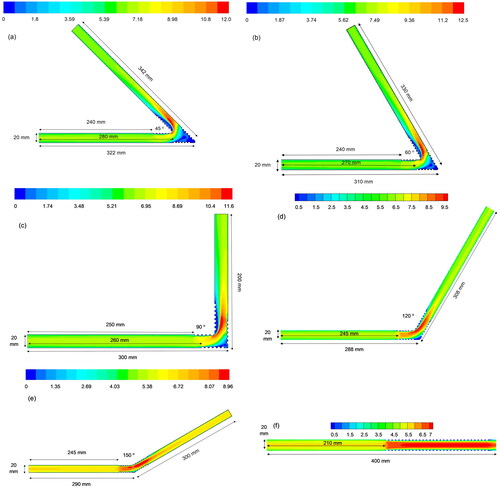
Mesh independence study for the particle deposition cases was tested in the previous study (Xu et al. Citation2020a) to indicate that 11 inflation layers with the first mesh size of 5 × 10⁻⁵ m at the growth rate of 1.1 can be well applied. The mesh size in the freestream was 3 × 10⁻⁴ m. First, a steady flow was achieved and the turbulent flow before the bend region was ensured to be fully developed. Then, 30,000 particles were released before the bend region, which was enough to achieve the statistical stable results (Xu et al. Citation2020a, Citation2020b). Seven particle size groups ranging from submicron to micron (0.1, 0.3, 0.5, 1.0, 2.0, 3.0 and 5.0 µm) were investigated. The color contour in represents the velocity magnitude of the air phase (red represents a high-velocity region, and blue is the low-velocity region).
The deposition velocity in the numerical study is defined by
(15)
(15)
(16)
(16)
where Nd is the number of deposited particles, N0 is the initially released particle number,
A and V are the deposition area in the duct and the volume of duct space, respectively, and
is the duration for particles to pass through the duct.
is the deposition enhancement ratio,
is the deposition velocity on the patterned rough surface,
is the deposition velocity on the smooth surface. A similar method to calculate deposition velocity in a
bend duct has been successfully employed in a reference (Sun, Lu, and Jiang Citation2012). The non-dimensional deposition velocity in smooth ducting with different degree bends can be calculated by using the deposition velocity divided by the friction velocity.
(17)
(17)
where
is the friction velocity, which is an assessment of the intensity of a turbulent flow. In the different degree bend duct system, the friction velocity is calculated by EquationEquation (16)
(16)
(16) . The friction velocity may be different for different bend angles because the pressure drop along the channel is different.
(18)
(18)
where
is the average flow velocity in the duct, and f is the Fanning friction factor which is given by EquationEquation (19)
(19)
(19) .
(19)
(19)
where
is the pressure difference between the inlet and outlet,
is the duct length, and
is the air density,
is the hydraulic diameter defined by EquationEquation (20)
(20)
(20) .
(20)
(20)
where
is the cross-section area of the duct and p is the perimeter of duct cross-section normal to the flow direction.
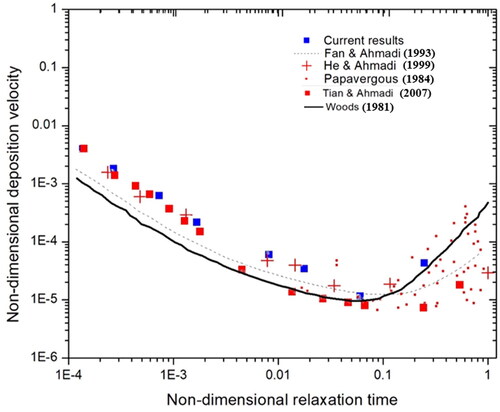
2.2. Comparison of particle deposition on smooth surface with benchmark cases
The numerical model for a smooth surface in a straight duct was validated by comparing with other references. The experimental data from Papavergos and Hedley (Citation1984), the empirical equations of Fan and Ahmadi (Citation1993) as well as Wood (Citation1981), plus the simulation results of He and Ahmadi (Citation1999), as well as Tian and Ahmadi (Citation2007) were compared. shows that the deposition velocities from a “V-shape” for the size range of 0.01 to 5 µm. The non-dimensional deposition velocity and relaxation time in are defined in EquationEquation (17)(17)
(17) and Equation(21)
(21)
(21) respectively. Here, S is the density ratio of particle to air, d is the particle diameter, υ is the kinematic viscosity of air, and
is the Stokes Cunningham correlation.
(21)
(21)
Figure 2. Submicron particle deposition on a smooth surface.
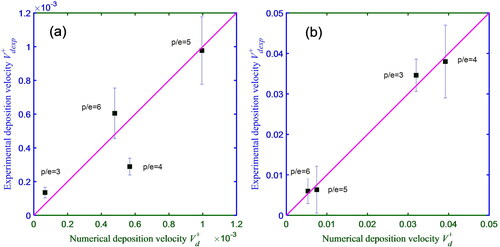
2.3. Comparison of particle deposition on patterned surface with experimental results
The numerical model for particle deposition on patterned surfaces was validated by previous experimental data (Xu et al. Citation2020b). The experiment was conducted in a fully developed straight wind tunnel. The sample was put on the bottom wall of the test area of the wind tunnel. The test area has a rectangular cross-section with size of 20 × 200 mm (height × width). It was at 3 m downstream of the inlet (i.e., 150 times of the channel height) to ensure the fully developed turbulent flow. The freestream velocity in the test area was set as 6 m/s which is the same as the simulation. The substrate has parallel half-circular pillars on the surface, whose height was set at 2000 µm. Four pitch-to-height ratios of 3, 4, 5, and 6 were studied. The patterned surfaces were fabricated by a 3 D printer using photopolymer material.
A condensation monodisperse particle generator (Model 3475, TSI Incorporated, USA) was used to generate the submicron and micron-sized particles. Two kinds of particle size were studied for validation: 0.5 µm and 2.5 µm. The generator condensed organic vapor to solid nuclei so as to generate high concentration monodisperse particles. The generated particles were neutralized, and deposited aerosols can be removed from the surface after the experiment by water flushing. Generally, the deposited particles on a surface can be regarded as two scenarios: with resuspension and without resuspension (Lai, Byrne, and Goddard Citation1999). In the experiment, di-2-ethyl hexyl sebacate (DEHS) is used as aerosol material. The contact angle of DEHS on the surface is nearly 23° (i.e., hydrophilic), indicating high adhesion between the aerosol and solid substrate. It was also observed that the DEHS aerosols remained on the surface without resuspension for a long time. Thus, it was assumed that the deposited aerosols would not resuspend from the substrate.
The particle concentration for particles in the air was measured by a scanning mobility particle sizer (SMPS) (Model 3080, TSI Incorporated, USA) and an aerosol spectrometer (GRIMM Model 1.108, Technik GmbH & Co, KG). The particle deposition on the patterned surface was observed by a microscope (Ni-E, Nikon, Japan). The detailed method was shown in the previous work of Xu et al. (Citation2020a). The deposition velocity on a surface is calculated by EquationEquation (22)(22)
(22) .
(22)
(22)
where J is the particle flux deposited to the surface,
is the particle number concentration in air,
is the friction velocity. The numerical model was validated by the comparison between the experimental and the numerical deposition velocity for the particle sizes of 0.5 µm and 2.5 µm as shown in . The simulation results reasonably agree with the experimental data and capture the trend due to different pitch-to-height ratio.
Figure 3. Comparison between experimental and numerical deposition velocity for (a) submicron particle of 0.5 µm and (b) micron particle of 2.5 µm with different pitch-to-height (p/e) ratios.
3. Results and discussion
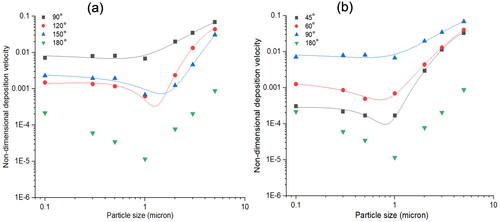
3.1. Particle deposition on different degree bends with smooth surface
A comparison of non-dimensional deposition velocity for ducts with different degree bends is shown in . displays the non-dimensional deposition velocity vs. particle size for bends larger than 90°. The 90° bend has the highest non-dimensional deposition velocity. The curve of the non-dimensional deposition velocity in the 120° and 150° bend resembles that of the “V” curve of the straight duct (bend degree of 180°). For submicron particles, the non-dimensional deposition velocity in the bend of 120° is higher than that in the bend of 150°, while the non-dimensional deposition velocity in the bend of 150° is higher for micron-sized particles. The dimensionless deposition velocities in the bend of 120° and 150° are nearly 60 times higher than that in a straight smooth duct for the particle size of 1 It can be observed that the increase of the particle deposition with size larger than 1 µm are larger than those for the smaller particles, probably due to a larger inertia impaction effect at the bend. displays the non-dimensional deposition velocity vs. particle size for bends smaller than 90°. The non-dimensional deposition velocity increases as the bend degree increases. In short, air duct bends can enhance the deposition velocity at the trough region of the “V” curve.
Figure 4. Comparison of non-dimensional deposition velocity on different degree bend ducts with smooth surface: (a) bend degree > 90° (b) bend degree < 90°.
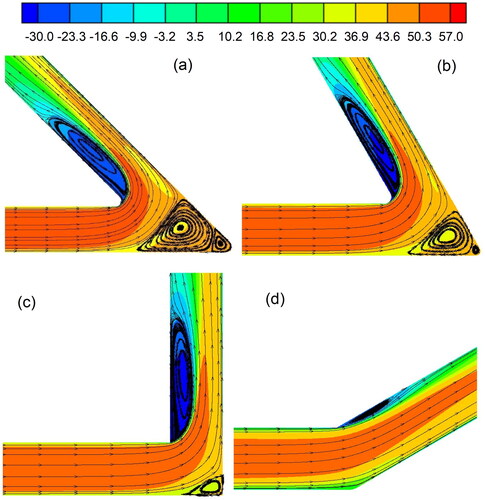
displays the pressure contour and streamlines for the bend angles of 45°, 60°, 90°, and 150° (a, b, c, and d). The non-dimensional deposition velocity increases gradually from the bend angle of 45° to that of 60°, then reaches the maximum at a bend angle of 90°. In , the recirculation flow at the corner of the bend is larger than that in , and therefore, lesser particles are brought to the near wall region, and the bend-induced impaction is less severe at bend angles of 45° and 60° compared with that of 90°. Although a larger recirculation region appears at the low-pressure zone in near the left wall of the downstream duct that prevents the particles to approach, the flow in the horizontal duct directly hits the right wall of the vertical duct, and therefore more particles deposit within the bend region due to the enhanced inertial effect. The streamline in a 150° bend air duct () is smoother than the 90° bend air duct (), thus the bend-induced impaction effect of obtuse angles is larger than that of acute angles, but not as good as that of a right angle.
Figure 5. Pressure contour and streamline for the smooth bend duct with angle of (a) 45°, (b) 60°, (c) 90°, and (d) 150°. The legend color represents the total pressure (Pa).
3.2. Particle deposition enhancement and efficiency index on different degree bends with patterned surface
compares the deposition enhancement ratio by a patterned surface for different degree bend air ducts. It is found that in general, for all angles of bends, when particle size increases from sub-micron range, the enhancement ratio increases gradually and reaches the maximum at the particle size of around 1 µm. Then the enhancement ratio drops dramatically in the micron size range. Moreover, the enhancement ratio by obtuse angles (>90°) is larger than that of acute angles (<90°). The bend angle of 120° has the highest enhancement ratio by a patterned surface for particle sizes smaller than 1 µm, while for micron particles, the bend angle of 150° has the highest ratio. The bend angle of 90° has the lowest enhancement ratio compared with the bend angles of 45°, 60°, 120°, and 150°, and the enhancement ratios are smaller than 10 in the 90° bend duct for all particle sizes. Bend ducts of 120° and 150° have the highest deposition enhancement ratio compared with other angles.
Figure 6. Comparison of (a) particle deposition enhancement ratio and (b) efficiency index for patterned surface in different degree air duct bends.
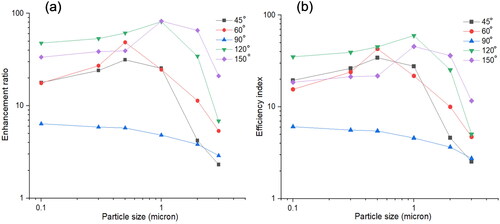
The pressure drop in duct bends is higher than that of the straight duct. If the patterned surface is installed at the bend area, the fluid drag induced in the bend duct is also higher, which may cause the fan of the ventilation system to consume more energy. Therefore, the combined performance of the deposition enhancement and friction factor should be considered. An efficiency index is defined in EquationEquation (23)(23)
(23) (Xu et al. Citation2020b).
(23)
(23)
where
and
the friction factors for a patterned rough surface and a smooth surface, respectively. The friction factor is calculated by EquationEquation (4)
(4)
(4) and is a function of pressure drop along the ducting system. The pressure drops of the duct with patterned surface for the bend angles of 45°, 60°, 90°, 120°, and 150° are 42 Pa, 46.64 Pa, 36.62 Pa, 28.13 Pa, and 24.47 Pa, respectively. The bend angle of 90° has the smallest efficiency index compared with all the other angles, as shown in , due to the low enhancement ratio. The bend angle of 120° has the highest efficiency index for particle sizes smaller than or equal to 1 µm, while the bend angle of 150° has the best performance for micron particles.
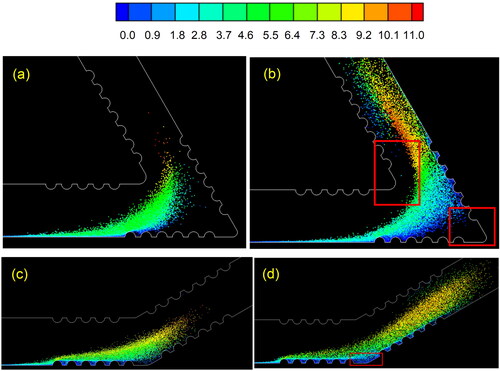
displays the particle trajectory of 0.1 µm particles in a 60° bend air duct with a patterned surface. The particles are released from the region near the lower wall in front of the patterned surface. The colors of the particles in red, yellow, green to blue represent their velocities in high to low, respectively. The numerical simulation is based on a transient study, thus the particle trajectory at different time steps can be observed to indicate the mechanism of deposition enhancement. show the particle locations at time 0.015 s and 0.02 s after release respectively. Most of the submicron particles follow the flow field into the bend area, but they do not reach the near wall cavity between two consecutive semi-circular ribs as indicated in the red boxes. Only a few particles recirculate to the patterned surface on the left wall, thus the deposition enhancement effect by the patterned surface is limited. display the 0.1 µm particle trajectory for the bend duct angle of 150°. Particles follow the flow field from the horizontal duct into the bend area. Similar to the case of the acute angle, submicron particles didn’t approach the left wall, but most of the particles prefer to accumulate at the right corner of the bend, as shown by the red box region. As shown in , a larger amount of particles closely disperse to the wall in the case of the obtuse angle so that a larger chance for the patterned surface to take effect to enhance deposition.
Figure 7. Particle deposition by patterned surface on 60° bend air duct at time (a) 0.015 s, (b) 0.02 s, and on 150° bend air duct at time (c) 0.015 s, and (d) 0.02 S. The legend color represents the particle velocity (m/s).
3.3. Overall efficiency in ventilation ducting systems and implications
The overall efficiency of ventilation ducting systems using the patterned surface at the bend region is compared with a high-efficiency particulate air (HEPA) filter. HEPA filter is commonly installed in ventilation ducts to remove submicron particles from airflow. Ventilation ducting systems typically use absolute filters for microparticle filtration. By using the ultra-soft glass microfibres, the EPA, HEPA and ULPA filters achieve very high removal ratios for submicron particles. According to the technical manual in one type of HEPA filter (Model H13-P20, Klima-Service Incorporated, CZ), it can achieve separation efficiency of up to 99.95% for particles of 0.5 µm. Flow rate through the filer can be up to 4000 m3/h with a dimension of 610 × 610 × 292 mm. The pressure drop along this dimension is 500 Pa. In our numerical simulation cases, 30,000 particles were released in the ventilation ducting systems. To compare at a similar level, the deposited particle number in a HEPA filter is nearly 29,985, and the corresponding deposition velocity is calculated based on EquationEquation (1)(1)
(1) .
The enhancement ratio of the deposition velocity combined with the increase of pressure drop accounts for the overall efficiency in . The non-dimensional deposition velocity for the bend angles of ≥90° is larger than that for bend angles of ≤90°. The deposition velocity of a HEPA filter was around 3–20 times of the patterned surfaces. The enhancement ratio of the HEPA filter (compared with the case without filter) was also much higher than the patterned surface. However, the pressure drop caused by the patterned surface is much lower than the HEPA filter. The HEPA filter in the ventilation duct causing significant pressure drop will result in large energy consumption and lead to high cost of buildings. By referring to the overall efficiency, the straight duct with a bend angle of 180° achieved the highest value compared with HPEA filter or other bend angles. The overall efficiencies of other bend angles are at the same magnitude to the HPEA filter, such as the bend angle of 120° or 60°.
Table 1. Comparison between HEPA filter and patterned surface in ducts with different bend angles.
The smooth bend regions could accumulate many dusts, because of the higher deposition velocity than the straight duct, and are difficult to regularly clean and disinfect. The patterned surface at bend regions can further achieve up to 5−61 times particle deposition enhancement of the smooth bends. Given the fact that the patterned substrates can be easily removed out of the ventilation duct for regular cleaning, they could be fabricated and attached at the bend regions. The patterned substrates can both avoid the direct cleaning of bend regions and enhance particle removal without causing obvious pressure drop. Thus, it is suggested to attach the washable patterned surfaces at the bend regions of the ventilation ducting system.
By considering the ultra-low pressure drop, the patterned substrates can be directly installed at both the straight and bend areas of the ventilation duct, as a supplementary of filters. The patterned surfaces can increase different-sized particle deposition and then reduce the airborne transmission without causing a significant additional pressure drop. Thus, there is no need to modify the current ventilation ducting system such as fan power when installing the patterned surfaces.
Some limitations exist in this work. Aerosol resuspension was neglected in the simulations. In real life, solid particles are also common and have different shapes, which will cause different adhesive forces with the substrate and may resuspend from the surface. The partial resuspension of solid particles could be experimentally and numerically investigated in further studies. The turbophoresis force for the surfaces with small roughness was not considered in our simulation model. The micron-scale surface structures are irregular and complicated and result in different roughness in a large range. Further studies considering the particle turbophoresis are essential for ventilation ducts. The results of this work were based on the 2-D simulation. In a real 3-D ventilation duct, the flow field should be more complex than the simulation and affect the particle deposition. For example, the secondary flow, characterized by the Dean number, may influence bend deposition and become important as particle inertia increases. Further studies of particle deposition in a real-sized ventilation duct are recommended. In addition, the patterned bends can achieve similar efficiency index with the filters because of the small pressure drop, but the patterns attached on the wall attract less aerosols from air than the filters which cut the cross-section of the airflow. Thus, the patterned surfaces attached in ventilation duct could work as a supplementary air cleaning technique instead of an alternative technique to filters.
4. Conclusions
In this work, numerical simulation was conducted to study particle deposition on bend regions of airduct with patterned inner surface. The numerical model was compared and validated with both benchmark and experimental data. It was then applied to study particle deposition in the bend angles of 45°, 60°, 90°, 120°, 150°, and 180°. For the smooth bends, the bend angle of 90° was shown to have the higher non-dimensional deposition velocity because of the enhanced inertia effect. When the patterned surface was installed, the 120° and 150° bend ducts had the higher deposition velocity compared with other angles. By combining the particle deposition enhancement and energy consumption, the efficiency of bend angle of 180° was larger than the HEPA filter and other bend angles. The efficiency of bend regions was at the same magnitude to the filter. While the pressure drop caused by the straight duct and bend regions was much lower than the filter. Given the fact that the bend regions are difficult to clean, the patterned substrates could be attached at bend regions, which can be removed from the ventilation duct and cleaned regularly. Therefore, it is recommended to use our proposed patterned surface in both straight and bend areas in a ventilation ducting system.
Disclosure statement
No potential conflict of interest was reported by the authors.
Additional information
Funding
References
- Azimi, P., Z. Keshavarz, J. G. C. Laurent, B. Stephens, and J. G. Allen. 2021. Mechanistic transmission modeling of COVID-19 on the Diamond Princess cruise ship demonstrates the importance of aerosol transmission. P. Natl. Acad. Sci. USA. 118 (8):1–8.
- Chan, J. F.-W., S. Yuan, K.-H. Kok, K. K.-W. To, H. Chu, J. Yang, F. Xing, J. Liu, C. C.-Y. Yip, R. W.-S. Poon, et al. 2020. A familial cluster of pneumonia associated with the 2019 novel coronavirus indicating person-to-person transmission: a study of a family cluster. Lancet. 395 (10223):514–23. doi:10.1016/S0140-6736(20)30154-9.
- Chen, C., M. Yao, X. Luo, Y. Zhu, Z. Liu, H. Zhuo, and B. Zhao. 2020. Outdoor-to-indoor transport of ultrafine particles: Measurement and model development of infiltration factor. Environ. Pollut. 267:115402.
- Cheng, P., K. Luo, S. Xiao, H. Yang, J. Hang, C. Ou, B. J. Cowling, H. L. Yen, D. S. C. Hui, S. Hu, et al. 2022. Predominant airborne transmission and insignificant fomite transmission of SARS-CoV-2 in a two-bus COVID-19 outbreak originating from the same pre-symptomatic index case. J. Hazard. Mater. 425:128051. doi:10.1016/j.jhazmat.2021.128051.
- Cheong, K. 1997. Deposition of aerosol particles in ductwork. Appl. Energy. 57 (4):253–61. doi:10.1016/S0306-2619(97)00025-1.
- Cooper, D. W. 1986. Particulate contamination and microelectronics manufacturing: an introduction. Aerosol Sci. Technol. 5 (3):287–99. doi:10.1080/02786828608959094.
- Dai, H, and B. Zhao. 2022. Reducing airborne infection risk of COVID-19 by locating air cleaners at proper positions indoor: Analysis with a simple model. Build. Environ. 213:108864. doi:10.1016/j.buildenv.2022.108864.
- De Bellis, F, and L. A. Catalano. 2012. CFD optimization of an immersed particle heat exchanger. Appl. Energy. 97:841–8. doi:10.1016/j.apenergy.2012.02.013.
- Fan, F. G, and G. Ahmadi. 1993. A sublayer model for turbulent deposition of particles in vertical ducts with smooth and rough surfaces. J. Aerosol. Sci. 24 (1):45–64. doi:10.1016/0021-8502(93)90084-M.
- Garimella, S, and D. Schlitz. 1995. Heat transfer enhancement in narrow channels using two and three-dimensional mixing devices. J. Heat Transf. 117 (3):590–6. doi:10.1115/1.2822618.
- He, C, and G. Ahmadi. 1999. Particle deposition in a nearly developed turbulent duct flow with electrophoresis. J. Aerosol. Sci. 30 (6):739–58. doi:10.1016/S0021-8502(98)00760-5.
- Huang, C., Y. Wang, X. Li, L. Ren, J. Zhao, Y. Hu, L. Zhang, G. Fan, J. Xu, X. Gu, et al. 2020. Clinical features of patients infected with 2019 novel coronavirus in Wuhan, China. Lancet 395 (10223):497–506. doi:10.1016/S0140-6736(20)30183-5.
- Jiang, H., L. Lu, and K. Sun. 2011. Experimental study and numerical investigation of particle penetration and deposition in 90 bent ventilation ducts. Build. Environ. 46 (11):2195–202. doi:10.1016/j.buildenv.2011.04.033.
- Kanamori, H. 2021. Rethinking environmental contamination and fomite transmission of SARS-CoV-2 in the healthcare. J. Infect. 82 (1):e17–e18. doi:10.1016/j.jinf.2020.08.041.
- Lai, A. C., M. A. Byrne, and A. J. Goddard. 1999. Measured deposition of aerosol particles on a two-dimensional ribbed surface in a turbulent duct flow. J. Aerosol. Sci. 30 (9):1201–14. doi:10.1016/S0021-8502(99)00021-X.
- Lai, A. C., M. A. Byrne, and A. J. Goddard. 2001. Aerosol deposition in turbulent channel flow on a regular array of three-dimensional roughness elements. J. Aerosol. Sci. 32 (1):121–37. doi:10.1016/S0021-8502(00)00051-3.
- Lai, A. C., M. A. Byrne, and A. J. Goddard. 2002. Particle deposition in ventilation duct onto three-dimensional roughness elements. Build. Environ. 37 (10):939–45. doi:10.1016/S0360-1323(01)00092-0.
- Lai, A. C, and F. Chen. 2006. Modeling particle deposition and distribution in a chamber with a two-equation Reynolds-averaged Navier–Stokes model. J. Aerosol. Sci. 37 (12):1770–80. doi:10.1016/j.jaerosci.2006.06.008.
- Li, Q., X. Guan, P. Wu, X. Wang, L. Zhou, Y. Tong, R. Ren, K. S. M. Leung, E. H. Y. Lau, J. Y. Wong, et al. 2020. Early transmission dynamics in Wuhan, China, of novel coronavirus–infected pneumonia. N Engl. J. Med. 382 (13):1199–207. doi:10.1056/NEJMoa2001316.
- Li, Y., G. M. Leung, J. W. Tang, X. Yang, C. Y. H. Chao, J. Z. Lin, J. W. Lu, P. V. Nielsen, J. Niu, H. Qian, et al. 2007. Role of ventilation in airborne transmission of infectious agents in the built environment-a multidisciplinary systematic review. Indoor Air. 17 (1):2–18. doi:10.1111/j.1600-0668.2006.00445.x.
- Ma, T., M. Yan, M. Zeng, J. Yuan, Q. Chen, B. Sundén, and Q. Wang. 2015. Parameter study of transient carbon deposition effect on the performance of a planar solid oxide fuel cell. Appl. Energy. 152:217–28. doi:10.1016/j.apenergy.2014.11.061.
- McQuiston, F. C., J. D. Parker, and J. D. Spitler. 2004. Heating, ventilating, and air conditioning: analysis and design. New York: John Wiley & Sons.
- Mehta, R. D, and P. Bradshaw. 1979. Design rules for small low speed wind tunnels. Aeronaut. J. 83:443–53.
- Meng, C., Q. Wang, Y. Song, Y. Cao, N. Zhao, and Y. Shi. 2015. Experimental study on both cleaning effect and motion performance of the duct-cleaning robot. Sustain. Cities Soc. 14:64–9. doi:10.1016/j.scs.2014.07.005.
- Nunayon, S., H. Zhang, and A. C. Lai. 2018. Deposition of ultrafine particle in a duct flow by twisted-tape insert. Build. Environ 136:156–61. doi:10.1016/j.buildenv.2018.03.043.
- Ounis, H., G. Ahmadi, and J. B. McLaughlin. 1991. Brownian diffusion of submicrometer particles in the viscous sublayer. J. Colloid Interface Sci. 143 (1):266–77. doi:10.1016/0021-9797(91)90458-K.
- Papavergos, P. G., and A. B. Hedley. 1984. Particle deposition behaviour from turbulent flows. Chem. Eng. Res. Des. 62 (5):275–295.
- Piri, A., H. R. Kim, D. H. Park, and J. Hwang. 2021. Increased survivability of coronavirus and H1N1 influenza virus under electrostatic aerosol-to-hydrosol sampling. J. Hazard. Mater. 413:125417.
- Qian, J., J. Peccia, and A. R. Ferro. 2014. Walking-induced particle resuspension in indoor environments. Atmo. Environ. 89:464–81. doi:10.1016/j.atmosenv.2014.02.035.
- Saffman, P. 1965. The lift on a small sphere in a slow shear flow. J. Fluid Mech. 22 (2):385–400. doi:10.1017/S0022112065000824.
- Sippola, M. R, and W. W. Nazaroff. 2005. Particle deposition in ventilation ducts: connectors, bends and developing turbulent flow. Aerosol Sci. Technol. 39 (2):139–50. doi:10.1080/027868290908795.
- Sundell, J., H. Levin, W. W. Nazaroff, W. S. Cain, W. J. Fisk, D. T. Grimsrud, F. Gyntelberg, Y. Li, A. K. Persily, A. C. Pickering, et al. 2011. Ventilation rates and health: multidisciplinary review of the scientific literature. Indoor Air. 21 (3):191–204.
- Sun, K., L. Lu, and H. Jiang. 2012. A numerical study of bend-induced particle deposition in and behind duct bends. Build. Environ. 52:77–87. doi:10.1016/j.buildenv.2011.12.009.
- Sun, K., L. Lu, H. Jiang, and H. Jin. 2013. Experimental study of solid particle deposition in 90 ventilated bends of rectangular cross section with turbulent flow. Aerosol Sci. Technol. 47 (2):115–24. doi:10.1080/02786826.2012.731094.
- Tian, L, and G. Ahmadi. 2007. Particle deposition in turbulent duct flows—comparisons of different model predictions. J. Aerosol Sci. 38 (4):377–97. doi:10.1016/j.jaerosci.2006.12.003.
- Wang, C. T., J. C. Xu, S. C. Fu, and C. Y. Chao. 2022. Airborne infection risk of nearby passengers in a cabin environment and implications for infection control. Travel Med. Infect. Dis. 47:102285. doi:10.1016/j.tmaid.2022.102285.
- Wood, N. 1981. A simple method for the calculation of turbulent deposition to smooth and rough surfaces. J. Aerosol. Sci. 12 (3):275–90. doi:10.1016/0021-8502(81)90127-0.
- Wu, J. T., K. Leung, and G. M. Leung. 2020. Nowcasting and forecasting the potential domestic and international spread of the 2019-nCoV outbreak originating in Wuhan, China: a modelling study. Lancet. 395 (10225):689–97. doi:10.1016/S0140-6736(20)30260-9.
- Xu, H., S. C. Fu, K. C. Chan, and C. Y. H. Chao. 2020b. Investigation of particle deposition on a micropatterned surface as an energy-efficient air cleaning technique in ventilation ducting systems. Aerosol Sci. Technol. 54 (10):1210–22. doi:10.1080/02786826.2020.1767758.
- Xu, H., S. C. Fu, W. T. Leung, T. W. Lai, and C. Y. H. Chao. 2020a. Enhancement of submicron particle deposition on a semi-circular surface in turbulent flow. Indoor Built. Environ. 29 (1):101–16. doi:10.1177/1420326X19853862.
- Xu, J. C., C. T. Wang, S. C. Fu, K. C. Chan, and C. Y. H. Chao. 2021. Short-range bioaerosol deposition and inhalation of cough droplets and performance of personalized ventilation. Aerosol Sci. Technol. 55 (4):474–85. doi:10.1080/02786826.2020.1870922.
- Zhang, Z, and Q. Chen. 2009. Prediction of particle deposition onto indoor surfaces by CFD with a modified Lagrangian method. Atmos. Environ. 43 (2):319–28. doi:10.1016/j.atmosenv.2008.09.041.