
 ?Mathematical formulae have been encoded as MathML and are displayed in this HTML version using MathJax in order to improve their display. Uncheck the box to turn MathJax off. This feature requires Javascript. Click on a formula to zoom.
Graphical Abstract
Copyright © 2022 American Association for Aerosol Research
Editor:
In a recent article by Cai and Kangasluoma (Citation2022), the authors discuss the role of free energy and its interpretation in first-order phase transitions, i.e., nucleation. Their analysis is mainly restricted to basic thermodynamic principles: equilibrium conditions and the second law of thermodynamics in particular. The presented key argument is that the free energy barrier, in the classical nucleation framework (separating the two phases) is fundamentally different from the reaction Gibbs free energy of nucleating clusters,
The former being positive and the latter negative. By acknowledging this difference, within the suggested theoretical view the second law of thermodynamics is satisfied and the system is able to evolve spontaneously as the free energy along the transition coordinate is always negative, i.e., the entropy of the system increases. The presented analysis by Cai and Kangasluoma, however, suffers from severe mischaracterizations of both the standard theoretical framework of nucleation and the general nature of the phenomenon.
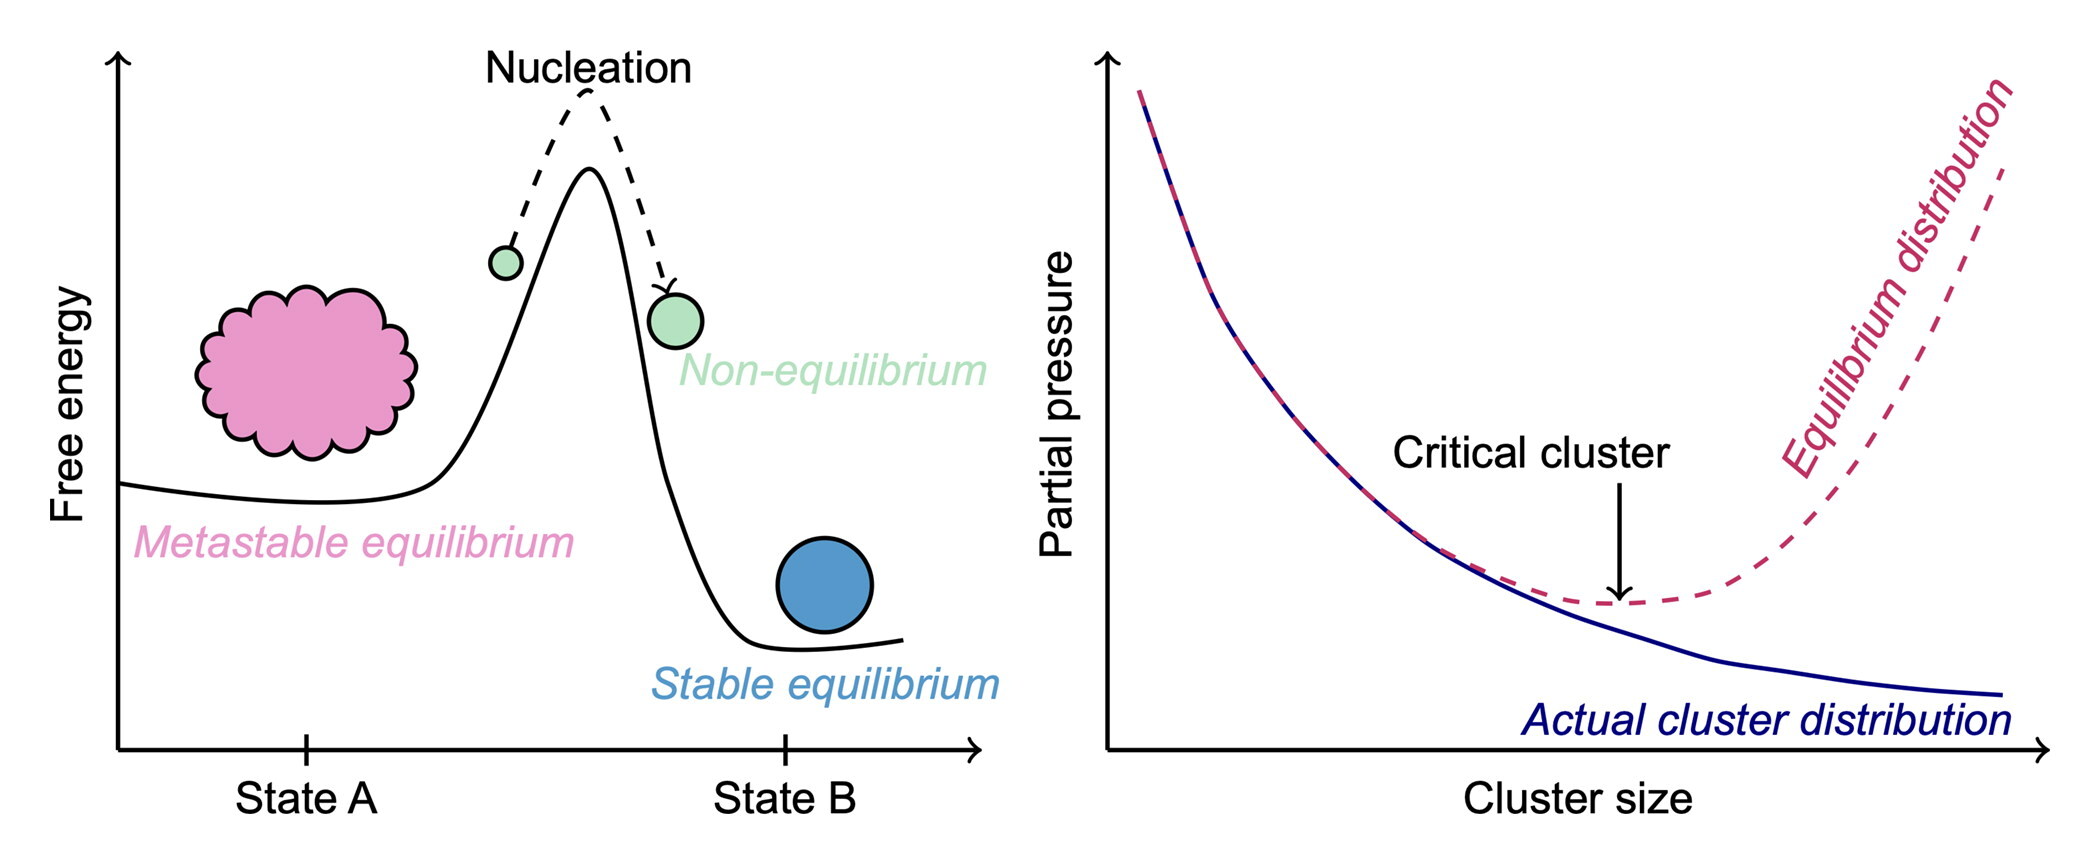
First, unlike it is stated on multiple occasions in their article, nucleation is not an equilibrium (or even a “quasi-equilibrium”) process. A phase transition designates the jump from a metastable state A to a more stable state B. Due to the free energy difference, the process is spontaneous. In the proper sense of nucleation, the path between states A and B, however, goes through intermediate states with free energies above the initial phase, hence the barrier. To surmount this barrier, a series of “lucky” out-of-equilibrium fluctuations is required. In the classical view of nucleation, these fluctuations take place in the cluster size space, but the system can also undergo perturbations due to e.g., rapid depletion around the nucleation site (Peters Citation2011) or deviations in cluster temperatures (Tikkanen et al. Citation2022). Thus, despite its spontaneous nature, once clusters surmount the free energy barrier, nucleation is a rare event facilitated by local serendipitous breakdowns of the metastable equilibrium, which are in fact local nanoscale violations of the second law. As suggested by the most common nucleation theories, the frequency of observing a nucleation event depends mostly on the free energy barrier height and the characteristic time scales of the system.
The factual breakdown of the metastable equilibrium in nucleation notwithstanding, the concepts adopted from equilibrium thermodynamics have been vital in understanding the fundamentals of the process and developing theoretical models of clustering in a supersaturated medium. In chemistry, free energies are often reported for specific reactants and products (computed at some standard pressure, marked here by the superscript ), and the favorability of a reaction is interpreted based on the free energy difference
This difference is directly related to the relative abundance of reactants and products in an equilibrium state where no net flux exists. Following the notation used by Cai and Kangasluoma (Citation2022), the equilibrium state between two adjacent cluster sizes can be expressed kinetically as
(1)
(1)
where
and
are the collision and evaporation rate coefficients, respectively. Note that here superscript eq refers to any hypothetical zero-flux state, and thus pressures
are not constrained to correspond to cluster population in a saturated equilibrium vapor.
As customary especially in studies of atmospheric new particle formation, the evaporation rate can be expressed using the standard free energies (given by EquationEquation (3)(3)
(3) in Cai and Kangasluoma [Citation2022]):
(2)
(2)
In particle formation processes like nucleation, a non-zero flux
exists and in a steady state this flux is constant throughout cluster sizes,
(3)
(3)
It is important to note that here
are the actual “non-equilibrium” partial pressures observable during a process of steady-state nucleation whereas
are quantities constrained to equilibrium (direct measuring of
is virtually impossible).
Instead of associating and
in nucleation theories, the nucleating clusters are just assumed to have their internal equilibrium properties, e.g., shape and molecular structure. According to this assumption, the evaporation rate
is a size-specific constant (depending on temperature, but not pressure), and therefore EquationEquations (2)
(2)
(2) and Equation(3)
(3)
(3) can be rearranged as
(4)
(4)
Now, by assuming that the cluster growth is purely monomeric and the system has reached a steady state, one can estimate the reaction free energies directly from the observed cluster distributions using the recursiveness of EquationEquation (4)
(4)
(4) :
By further setting
and
one obtains the size-specific reaction free energies,
corresponding to the conditions of the initial metastable state.
EquationEquation (4)(4)
(4) is often used to analyze obtained data from molecular-level computational simulations (Yasuoka and Matsumoto Citation1998; Halonen et al. Citation2021) where tracking even the smallest clusters during nucleation can be carried out rather effortlessly. As a brief demonstration of the actual relation between observable cluster pressures and the reaction free energies, we have performed a classical molecular dynamics (MD) simulation for nucleation in a supersaturated Lennard-Jones (LJ) vapor at a temperature of 0.6 and number density of 0.01 (in the standard LJ units). Such an atomistic simulation acts as a realistic “numerical experiment” as the system only obeys Newtonian dynamics and no external constraints involving either cluster formation or free energies are applied. The simulated system (with a fixed volume) consists of 500,000 nucleating atoms and 50,000 thermalizing carrier gas atoms (the details of the simulations can be found in Tikkanen et al. [Citation2022]). Due to the large size of the system and slow enough nucleation, a sufficiently long steady-state period (at which
is constant) is achieved at nearly constant monomer pressure,
(see ). During this period the average ideal cluster pressures,
are calculated () and the nucleation rate
is determined using the Yasuoka-Matsumoto threshold method (Yasuoka and Matsumoto Citation1998) (). Knowing both
and
and estimating
using the kinetic gas theory for hard spheres, the reaction free energies can be readily computed using EquationEquation (4)
(4)
(4) . The obtained
are shown in for the nucleating Lennard-Jones clusters. The reaction free energies clearly represent the classical parabolic nucleation barrier without any ambiguity. The found values characterizing the critical cluster (i.e., the position of the peak of the reaction free energy profile) are in good agreement with the nucleation barrier calculated at constrained equilibrium using semi-grand canonical Monte Carlo sampling (Halonen, Zapadinsky, and Vehkamäki Citation2018). The presented inspection of the simulated non-equilibrium steady-state cluster pressures via EquationEquation (4)
(4)
(4) reveals no difference between
and
Figure 1. Results from the molecular dynamics simulation of Lennard-Jones (LJ) nucleation. (a) Observed pressures of selected cluster sizes n as a function of time t. (b) Non-equilibrium cluster pressures (red circles) averaged over the steady-state nucleation period: from t = 2500 to 5500 (indicated by gray areas in panels (a) and (c)). The dashed black line shows the corresponding equilibrium cluster pressure curve. (c) Total pressure of clusters above threshold size n = 35 (which should be sufficiently larger than the critical size). The nucleation rate J (here reported in units of pressure/time instead of more conventional clusters/volume/time) corresponds to the slope of the curve at the steady state (dashed red line). (d) Obtained reaction free energies from the steady-state cluster pressure distribution using EquationEquation (4)(4)
(4) (large red circles). The small black circles show the reaction free energies according to the analysis by Cai and Kangasluoma (Citation2022) (Equation (9) in their work). The found critical cluster size, n = 21, and the barrier height, 12.4RT (indicated by a vertical dotted line) are consistent with the data from previous Monte Carlo simulations (Halonen, Zapadinsky, and Vehkamäki Citation2018). Note that the relevant quantities are presented in the standard LJ units.
![Figure 1. Results from the molecular dynamics simulation of Lennard-Jones (LJ) nucleation. (a) Observed pressures of selected cluster sizes n as a function of time t. (b) Non-equilibrium cluster pressures (red circles) averaged over the steady-state nucleation period: from t = 2500 to 5500 (indicated by gray areas in panels (a) and (c)). The dashed black line shows the corresponding equilibrium cluster pressure curve. (c) Total pressure of clusters above threshold size n = 35 (which should be sufficiently larger than the critical size). The nucleation rate J (here reported in units of pressure/time instead of more conventional clusters/volume/time) corresponds to the slope of the curve at the steady state (dashed red line). (d) Obtained reaction free energies from the steady-state cluster pressure distribution using EquationEquation (4)(4) δΔrGmθ(n)=ΔrGmθ(nA1→An)−ΔrGmθ((n−1)A1→An−1)=−RT[ln(PθPn)−ln(P1Pn−1−Jβn−1)].(4) (large red circles). The small black circles show the reaction free energies according to the analysis by Cai and Kangasluoma (Citation2022) (Equation (9) in their work). The found critical cluster size, n = 21, and the barrier height, 12.4RT (indicated by a vertical dotted line) are consistent with the data from previous Monte Carlo simulations (Halonen, Zapadinsky, and Vehkamäki Citation2018). Note that the relevant quantities are presented in the standard LJ units.](/cms/asset/4ec02034-4787-40db-8d34-a0358c6849ad/uast_a_2114310_f0001_c.jpg)
The crucial confusion in the free energy analysis by Cai and Kangasluoma (Citation2022) is between the assumed (“quasi-”)equilibrium and the actual nucleation state, and this is overall manifested in their results due to assigning an improper equivalence between and
Specifically, in their article,
is effectively by mistake set to zero in Equation (7) where the pressures used inside the logarithm should in fact be the equilibrium pressures. While further analyzing the observed/simulated cluster pressures with Equation (9) in Cai and Kangasluoma (Citation2022) and the classical equilibrium distribution function,
the suggested relation by Cai and Kangasluoma would thus be
(5)
(5)
This erroneous relation quite comprehensively explains the findings presented by Cai and Kangasluoma (see, e.g., Figures 2 and 3 in Cai and Kangasluoma [Citation2022]): At a stable equilibrium state (e.g., unsaturated vapor), EquationEquation (5)(5)
(5) will result in apparent zero values for
since by definition
for all values of n. This is also the case for the smallest, pre-critical clusters in a supersaturated vapor, as shown in , but
starts to diverge from zero as n reaches the critical size. At the critical size, according to theory (Frenkel Citation1955), the fraction
has a universal value of 2, and indeed the ratio found from the MD simulation is about 1.9. For the over-critical clusters, the analysis by Cai and Kangasluoma will result in quickly decreasing negative values of
since
as
whereas
is expected to decrease monotonically while being finite. This fundamental difference between
and
is further presented in , where the equilibrium (given by
) and actual steady-state cluster distributions are depicted by the dashed line and open circles, respectively. Regarding any nucleating system, the considered quantities
and
are not equivalent, and should not be treated as such, because in the hypothetical equilibrium (described by the reaction free energies) the clusters are considered to be isolated from each other and thus the mutual action between different clusters, essential for the nucleation process, is disregarded (Frenkel Citation1955). In essence, the presented view of cluster free energies and Equation (9) in particular by Cai and Kangasluoma (Citation2022) are thermodynamically inappropriate and do not challenge the general idea (dating back nearly a century) about the role or the nature of free energy in nucleation.
Yet, it is true, the standard reaction free energies are not directly compatible with the free energy barrier used in the classical nucleation theories (Elm et al. Citation2020). However, the nature of this incompatibleness is merely technical rather than rooted in some fundamental misconception related to the underlying physics. Recently, Halonen (Citation2022) analyzed the apparent inconsistency between and the routinely reported thermochemical values of
It was demonstrated that with adequate analysis of the kinetic framework behind classical nucleation theory one can easily calculate the steady-state nucleation rates using the standard free energy data obtained from, e.g., quantum chemical calculations.
To conclude, in equilibrium, all transitions between states are balanced (EquationEquation (1)(1)
(1) ) and macroscopically the system stays unchanged; in non-equilibrium, this balance breaks down allowing the system to evolve at some finite rate (EquationEquation (3)
(3)
(3) ). Despite the debates over possible violations of the second law of thermodynamics in out-of-equilibrium processes at the nanoscale (Evans and Searles Citation1994; Jarzynski Citation2011; Spinney and Ford Citation2012), it is worth emphasizing that in nucleation entropy is not only related to mass transfer but also heat transfer which should be taken into account when assessing the total entropy production of the process. Inevitably, every first-order phase transition involves some degree of latent heat release and this excess energy is eventually dissipated to the surroundings in order to keep the system in thermal equilibrium (in the presented MD simulation, this specific process is emulated by using an explicit carrier gas connected to a heat bath via a thermostat). Thus, to assess the entropy production, the thermodynamic inspection of the nucleating system should not be limited to the formed clusters but to include all the relevant processes initiated by clustering.
References
- Cai, R., and J. Kangasluoma. 2022. The proper view of cluster free energy in nucleation theories. Aerosol Sci. Technol. 56 (8):757–66. doi:10.1080/02786826.2022.2075250.
- Elm, J., J. Kubečka, V. Besel, M. J. Jääskeläinen, R. Halonen, T. Kurtén, and H. Vehkamäki. 2020. Modeling the formation and growth of atmospheric molecular clusters: A review. J. Aerosol Sci. 149:105621. doi:10.1016/j.jaerosci.2020.105621.
- Evans, D. J., and D. J. Searles. 1994. Equilibrium microstates which generate second law violating steady states. Phys. Rev. E Stat. Phys. Plasmas. Fluids. Relat. Interdiscip. Top. 50 (2):1645–8. doi:10.1103/PhysRevE.50.1645.
- Frenkel, J. 1955. Kinetic theory of liquids. New York: Dover Publications, Inc.
- Halonen, R. 2022. A consistent formation free energy definition for multicomponent clusters in quantum thermochemistry. J. Aerosol Sci. 162:105974. doi:10.1016/j.jaerosci.2022.105974.
- Halonen, R., E. Zapadinsky, and H. Vehkamäki. 2018. Deviation from equilibrium conditions in molecular dynamic simulations of homogeneous nucleation. J. Chem. Phys. 148 (16):164508. doi:10.1063/1.5023304.
- Halonen, R., V. Tikkanen, B. Reischl, K. K. Dingilian, B. E. Wyslouzil, and H. Vehkamäki. 2021. Homogeneous nucleation of carbon dioxide in supersonic nozzles II: Molecular dynamics simulations and properties of nucleating clusters. Phys. Chem. Chem. Phys. 23 (8):4517–29. doi:10.1039/D0CP05653G.
- Jarzynski, C. 2011. Equalities and inequalities: Irreversibility and the second law of thermodynamics at the nanoscale. Annu. Rev. Condens. Matter Phys. 2 (1):329–51. doi:10.1146/annurev-conmatphys-062910-140506.
- Peters, B. 2011. On the coupling between slow diffusion transport and barrier crossing in nucleation. J. Chem. Phys. 135 (4):044107. doi:10.1063/1.3613674.
- Spinney, R. E., and I. J. Ford. 2012. Fluctuation relations: A pedagogical overview. In Nonequilibrium statistical physics of small systems: Fluctuation relations and beyond, ed., R. J. Klages, W. Just, and C. Jarzynski, 3–56. New York: Wiley-VCH. doi:10.1002/9783527658701.ch1.
- Tikkanen, V., B. Reischl, H. Vehkamäki, and R. Halonen. 2022. Nonisothermal nucleation in the gas phase is driven by cool subcritical clusters. Proc. Natl. Acad. Sci. U S A 119 (28):e2201955119. doi:10.1073/pnas.2201955119.
- Yasuoka, K., and M. Matsumoto. 1998. Molecular dynamics of homogeneous nucleation in the vapor phase. I. Lennard-Jones fluid. J. Chem. Phys. 109 (19):8451–62. doi:10.1063/1.477509.