
 ?Mathematical formulae have been encoded as MathML and are displayed in this HTML version using MathJax in order to improve their display. Uncheck the box to turn MathJax off. This feature requires Javascript. Click on a formula to zoom.
Abstract
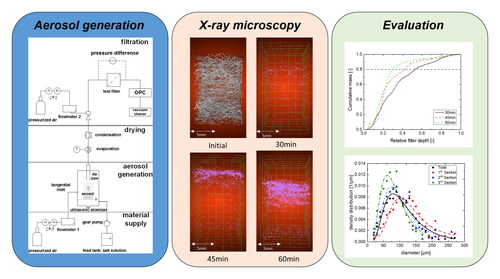
Microscopic data on airborne particle separation in depth filters are a key for understanding and predictive modeling of the evolution of filtration properties such as pressure drop and efficiency during the filtration process. Tomographic imaging techniques (e.g., MRI, CT) are excellent methods for 3D-resolved analysis of microscopic loading behavior, but these are often limited in terms of spatial resolution and because of the low contrast between filter material and particles. In this study, an X-ray microscope was used to analyze the separation of iodine-containing particles (d50,3 =1.5 µm) in a coarse dust filter (porosity: 0.98; fiber diameter: 24 µm). The use of iodine-containing particles produced sufficient contrast for segmentation and analysis of the particle deposits produced during filtration. The established method allowed the analysis of the deposits within the material in terms of mass, size distribution, and the shape of the formed deposits in time and space. The data presented in this work provide new insights and methods for an improved understanding of the dynamic behavior of filter materials.
Graphical Abstract
EDITOR:
1. Introduction
Filter material plays a critical role in air purification systems. The manufacturer is faced with the challenge of designing a filter material that exhibits high filtration efficiency, but simultaneously a low air resistance resulting in low-pressure differences. In addition, large dust holding capacities as well as long service lifetime must be achieved for sustainable and energy efficient air purification systems. The service life of the filter material depends largely on the amount and position of particulate embedded in the filter material. The aim is to achieve a uniform loading within the length of the filter in order to use the entire available surface for the separation and storage of particles (Azimian, Kühnle, and Wiegmann Citation2018; Geerling et al. Citation2020).
Several approaches focus on the combination of different filter materials, with each layer fulfilling a specific task, such as the separation of a specific particle size range (Charvet et al. Citation2018; Tien et al. Citation2020) or by an optimized microstructure of the filter material (Chang et al. Citation2019; Jabri, Vroman, and Perwuelz Citation2015; Roy and Ishtiaque Citation2020, Citation2022; Tian et al. Citation2019; Yang et al. Citation2015; Yun et al. Citation2010). Due to the increase in computing power in recent years, it is possible to represent filter materials via virtual geometries and to simulate the separation process in a CFD environment (Al‐Omari and Masad Citation2004; Chaudhuri, Boettcher, and Ehrhard Citation2021; Fotovati, Vahedi Tafreshi, and Pourdeyhimi Citation2010; Lehmann et al. Citation2016; Soltani, Johari, and Zarrebini Citation2014; Azimian, Kühnle, and Wiegmann Citation2018) and Geerling et al. (Citation2020) were able to generate optimized gradient filter structures for a given separation task via CFD simulation. Poggemann, Meyer, and Dittler (Citation2021) recently presented an innovative method for extending the service life of depth filters. In this process, particles on the surface of a filter are transported to deeper layers by moving/stretching the fibers.
Experimental data on the loading kinetics of filter materials on a microscopic level provide significant support for the presented strategies. Imaging methods of deposits using optical or electron microscopes have been in use for quite some time (Schmidt Citation1995; Schmidt and Löffler Citation1990; Thomas et al. Citation2001). In addition to the loading behavior of the filter material, knowledge of the structure of particle deposits on single fibers could be obtained for varying flow conditions and particle species (Kanaoka, Emi, and Myojo Citation1980; Kasper, Schollmeier, and Meyer Citation2010; Myojo, Kanaoka, and Emi Citation1984; Zoller et al. Citation2021).
Tomographic methods have become increasingly popular in recent years for generating 3D information about microstructural material properties (Bargmann et al. Citation2018). In this way, the microstructure of filter materials can be reproduced, as well as parameters such as porosity (Du Rolland Roscoat et al. Citation2007; Théron, Joubert, and Le Coq Citation2017) or fibers orientation (Nguyen Thi et al. Citation2015; Prade et al. Citation2017). This information can also be used as input for simulations, such as those described in Hoppe et al. (Citation2020), Jaganathan, Vahedi Tafreshi, and Pourdeyhimi (Citation2008), and Lehmann et al. (Citation2016).
These methods are also useful for the experimental analysis of particle deposition in filters. Hoferer et al. (Citation2006) and Lehmann et al. (Citation2005) used magnetic resonance imaging to quantify the deposition of polystyrene particles in a depth filter. Later, Jackiewicz, Jakubiak, and Gradoń (Citation2015) studied the deposition of Arizona dust (containing mainly silica particles) in two filter materials and, additionally, considered their rearrangement as a result of compressed air flow. Also, the analysis of liquid droplet separation was discussed in Charvet et al. (Citation2011), who studied the deposition of droplets in a filter material. Further work dealing with the analysis of oil structures on fibers can be found in Chaudhuri, Boettcher, and Ehrhard (Citation2022), Straube, Meyer, and Dittler (Citation2021). Riefler et al. (Citation2018) compared his own experimental data with CFD simulations and found an exponential decrease of particle mass as a function of depth. Recently, Song and Shim (Citation2021) observed a different behavior for other test conditions, in which there was first an accumulation at depth, and then an increase in the middle of the filter material.
One of the major challenges (besides ensuring high resolution and representative sample size) in studying the particle deposition in filter materials using tomographic techniques is the low contrast between the fibrous material and the deposited particles. Thus, particle deposition is often quantified as a change in porosity with respect to the reference porosity of a clean filter material (Jackiewicz, Jakubiak, and Gradoń Citation2015; Maschio and de Arruda Citation2001). Gervais et al. (Citation2014) used a radioactive aerosol for studying the particle deposition in a pleated filter material. Hoppach et al. (Citation2020) used digital image correlation to directly quantify particle deposition when studying the separation of aluminum particles in a ceramic filter during solid-liquid filtration. In Lee et al. (Citation2021), the deposition of salt particles in medical face masks was investigated using neural networks. Recently, Song and Shim (Citation2021) succeeded in distinguishing between particles and fiber material by using a standard test dust consisting of metal particles to ensure high contrast.
Analyzing particles in porous filter media using tomographic techniques is still challenging due to separation of fibers and particles in the data analysis. Furthermore, relatively little information is found on the (spatial) structure of particle depositions in depth filters analyzed by tomographic imaging techniques. The aim of the study was to overcome conventional problems of optical segmenting particles from the fibers by using a new particle generation method, which was developed in this work. Iodine-containing particles (potassium iodide) in a narrowly defined particle size range around 1 µm could be generated in high numbers, allowing the study of the temporal filtration behavior of a coarse dust filter in a relatively short time. Due to the high atomic number of the potassium iodide compared to the filter material, the generation of a high contrast was achieved to assist the image segmentation. Particle deposition within the filter specimen was investigated by tomographic imaging using an X-ray microscope after different filtration times. The occurring particle depositions during filtration were investigated with respect to mass distribution, as well as size and shape, with time and spatial resolution, and evaluated with respect to their influence on the pressure difference and filtration efficiencies.
2. Materials and methods
2.1. Filter material
A coarse filter material (G4-Filter, Afpro Filter, Boenen, Germany) consisting of polyester fibers was used for the analysis. Circular specimens with an outer diameter () of 50 mm were randomly taken from the filter material using a laser engraver (LS900, Gravotech, Umkirch, Germany). Filter thickness (
) was determined with a caliper. The density of the material was determined by helium pycnometry (MICRO-UlTRAPY 1200e, Anton Paar, Boynton Beach, Florida, USA). The porosity was then calculated by weighing the material (
) using a high-precision scale (Analytic AC 210S, Sartorius, Goettingen, Germany). The porosity was calculated according to EquationEquation (1)
(1)
(1) .
(1)
(1)
Fiber diameter distribution and mean fiber diameter of the investigated filter were determined by image analysis of SEM-images (recorded via an Scanning Electron Microscope, Hitachi H-S4500 FEG, Hitachi, Krefeld, Germany) using the open source software Image J (64-bit, Laboratory for Optical and Computational Instrumentation, University of Wisconsin-Madison, United States) (Hotaling et al. Citation2015). The mean pore size
was determined via mercury porosimetry (Pascal 140, Pascal 440, Thermo Scientific, Milano, Italia). All collected data are summarized in .
Table 1. Summary of structural parameter of the coarse filtration material (data are shown with average deviations based on the repetitions).
2.2. Particle generation and filter test
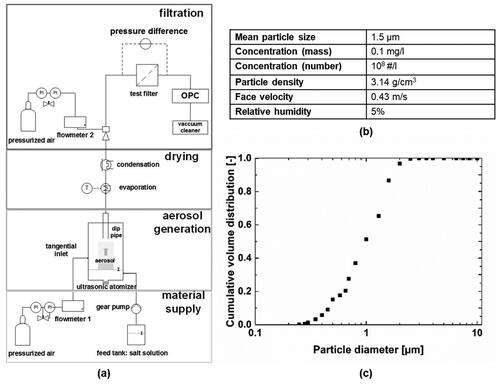
A continuous particle stream was generated via a custom-built laboratory spray dryer shown in . An aqueous salt solution containing 100 g/l potassium iodide (KI pure 99.9%, Batch: 230B155440, Merck, Darmstadt, Germany) was nebulized via an ultrasonic nebulizer (WHG3003/1503-12, Siansonic, Beijing, China) and transported from the aerosol chamber by a tangential airflow (=1.3 ml/min). A constant liquid fill level above the ultrasonic nebulizer was maintained by a gear pump (ISM828B, Ismatec, Barrington, Ireland). For the evaporation step, the resulting aerosol stream was heated up to about 70 °C via an external heater (HM-HT-B536, SAF Waermetechnik, Moerlenbach, Germany), and in a second step the moisture was reduced by condensing water vapor via an intensive glass cooler (cooling liquid water/glycerin 20 w.% at 0 °C) for subsequent removal. The resulting particle-loaded flow was combined with a dry air flow of 50 l/min, using an injector consisting of two concentric tubes. This led to a final relative humidity of about 5% (measured via an electronic dew point mirror, 5800 Remote, Michel Instruments, Friedrichsdorf, Germany), and a face velocity (defined as volume flow/filter cross sectional area) of 0.43 m/s in flow channel with an inner diameter of 50 mm. Particle size distributions () were determined at the outlet of the flow tube using an optical particle counter (OPC Model 1.108, Grimm Aerosol Technik, Ainring, Germany) in a size range from 250 nm to 30 µm. The aerosol was diluted 1:100 (DIL Dilutionsystem, Topas, Dresden, Germany) before measurement. The number concentration (particle number/volume clean air) was set to a value in order of magnitude 108#/l given a mass concentration (particle mass/volume clean air) of approx. 0.1 mg/l. The operating parameters are summarized in .
Figure 1. Flowsheet of lab-scale spray dryer and filter test (a); summary of important operating parameters (b); cumulative volume distribution of produced KI-particles (c).
Previously prepared filter specimens were mounted in the flow channel and filtration efficiencies were calculated by measuring the particle concentration of the inlet gas, cin, and the outlet gas stream, cout. Efficiencies () were determined based on total number
total mass
or grade filtration efficiency
according to EquationEquation (2)
(2)
(2) .
(2)
(2)
The resulting pressure drops were determined at regular intervals via a connected, inclined tube manometer (Type 4, AirFlow Development, High Wycomber, UK).
A dimensionless classification of the operating parameters is made based on the Stokes number (Stk) and the interception parameter (R) defined in EquationEquations (3)(3)
(3) and Equation(4)
(4)
(4) . For the calculations, the median values of the particle and fiber size distributions (dp and df) as well as the face velocity (u) and the dynamic viscosity (
) of air at 20 °C were used, giving values of Stk = 0.41 and R = 0.06 respectively.
(3)
(3)
(4)
(4)
2.3. Analysis of particle deposition using X-ray microscopy
2.3.1. Recording tomographic data
An X-ray computed tomography system with a high spatial resolution was necessary to examine the filter material structure. Furthermore, low X-ray energies were required for materials with low atomic numbers, such as the synthetic material used in this study (Emerson et al. Citation2017; Miettinen et al. Citation2012; Prade et al. Citation2017). X-ray microscopes are ideal for these high-resolution measurements because of their additional optical magnification step of attenuated x-ray beams (Miettinen et al. Citation2012; Schneider et al. Citation2021; Yared et al. Citation2019). For this reason, the X-Radia 520 X-ray microscope from Zeiss (Jena, Germany) with a maximum resolution of 700 nm was used in the investigations carried out here. Due to the high susceptibility to errors, sample preparation for XRM analysis requires special care. To prepare specimens for XRM-scans, a circular piece with a diameter of 20 mm was cut out of the center of the previously cut, 50 mm diameter specimen using the laser engraver as described in Sec. 2.1. Since the achievable spatial resolution decreases with increasing sample volume, this procedure was chosen in order to achieve maximum resolution while maintaining sufficient sample volume. Smaller samples or smaller flow channels to measure directly the whole filter sample were not possible due to technical limitations regarding humidity or adjustable face velocity. The sample thus obtained was placed in a 3D-printed sleeve made of Polylactid acid (PLA) in order to prevent the specimen from movement during the XRM-scan. The absorption behavior of the clean filter material was sufficient for analysis at an X-ray energy of 50 kV. For the preparation of particle-loaded samples, the previously cut out samples were reinserted into the filter sample together with the sleeve. This assembly was then inserted into the flow channel and loaded with potassium iodide particles as described in Sec. 2.2. After the filtration process, the filter sleeve including the particle loaded filter sample obtained inside was removed carefully and analyzed within a short period of time using the XRM. This minimizes manual sample post-processing following the sample preparation and filtration test. XRM-scans of particle loaded filters were carried out at higher X-ray energies of 120 kV. Since the filter material is transparent at these higher energies, mainly the embedded particles were detected. An overview of the measurement settings for the tomographic data acquisition can be found in Appendix Table S1. With the created sample sizes and chosen settings, a spatial resolution of about 15 µm could be achieved with a large sample volume ensuring statistical relevance. Since the primary particle size is in the order of 1.5 µm (see ) the detection of single particles was not possible. We therefore analyzed particle clusters formed during the filtration process.
2.3.2. Image analysis and segmentation
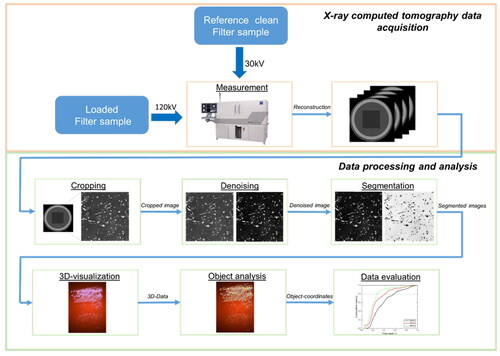
Porosity data for the clean filter material was generated using open source software as described in [31]. The analysis of clean and particle-laden filter samples via the XRM took place according to the scheme shown in using image processing software Dragonfly (Object Research Systems, Montreal, Canada). After acquiring and reconstructing the data, a rectangular area of 1000 µm by 1000 µm was extracted from the center of the sample. The data were processed with a Gaussian filter and segmented manually. The segmented data were displayed as a 3D image for visualization purposes. The data were evaluated by analyzing the segmented objects. Pixel sizes and 3D coordinates (max. X, Y and Z-direction as well as min. and max. X, Y and Z coordinates) of the segmented objects were determined. The raw data obtained were evaluated using MATLAB routines (MATLAB Version 2016b, MathWorks, Natick MA, USA).
Figure 2. Workflow for analyzing the filter samples image of the X-radia Versa was taken from (Zeiss Citation2020).
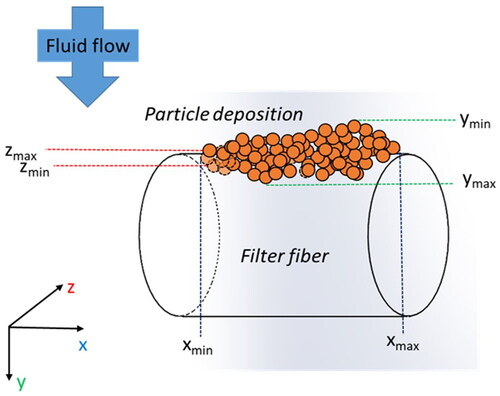
The mass distribution of the particle deposition within the material was determined from the detected volume (voxel number) of the objects. In addition to quantifying the mass distribution, understanding how the size of deposits relates to them acting as newly emerged collectors in the filter also facilitates the understanding of the filtration kinetics (Thomas et al. Citation2001). For this reason, the size of the deposits for each considered time step in the filter material was also investigated. The equivalent spherical diameter of the deposits was approximated from volume of the deposits. Beyond the mass and size distribution of the particle deposits already considered, the structure of the collectors is an additional influencing parameter of the filtration process, as seen in Hosseini and Tafreshi (Citation2011) and Jin et al. (Citation2017). To approximate the shape of the deposits, the minimum and maximum deposition coordinates detected in all three spatial directions were used (EquationEquations (5)–(7)). These coordinates form an aspect ratio orthogonal to the flow direction, as well as two aspect ratios in the direction of flow—one in x-direction and one in z-direction (see ).
(5)
(5)
(6)
(6)
(7)
(7)
Figure 3. Illustration of defined aspect ratios.
In the analysis of the shape presented here, an additional modification was introduced. Namely, only objects with a minimum size of 20 pixels (spherical equivalent diameter > 39 µm) were analyzed. This was to ensure the statistical relevance of the structure analysis. If this restriction is not employed, there is a risk of overestimation of objects with an AR of 1 (for objects at the lower limit of the resolution with only one voxel), as well as of integer AR (2,3…) if, for example, 2 detected pixels are directly next to each other.
2.3.3. Complementary methods
The analysis of tomographic data, in particular the pre-processing and the segmentation steps, has a dominant impact on the results (Bollmann and Kleinebudde Citation2021; Emerson et al. Citation2018; Hoferer et al. Citation2006; Lehmann et al. Citation2005). For this reason, the described analytics were further evaluated using complementary methods. To prove the plausibility (qualitative analysis) of the segmentation, images of the particle-loaded filter sample were taken with a camera (SM-A515F, Samsung, Soul, South Korea). For a quantitative analysis, the determined particle mass inside the filter material at different loadings states was used as a parameter. The particle mass was determined by a gravimetric method and also by a conductivity measurement. For the gravimetric determination, the sample used for the XRM analysis was weighed before and after the filtration process. For conductivity-based determination of the deposited particle mass, the filter sample was soaked in a defined volume of deionized water for 24 h. Subsequently, the mass was determined based on the conductivity () of the liquid using a conductivity probe (Multi 3410 Set7, WTW, Weilheim Germany) and a previously created calibration (
The mass in each segment was determined from XRM data by multiplying the density of the KI particles by the total volume of the voxels of all detected objects. The total mass was then extrapolated using the ratio of the cross-sectional area of the XRM sample to the sample cross-section, assuming an even distribution of particles across the entire cross-section.
3. Results
3.1. Evolution of pressure loss and filtration efficiency
The filter material exhibited typical behavior of increasing pressure loss over time for air filtration media during solid particle filtration (a). As described in the literature (Charvet et al. Citation2018; Song and Shim Citation2021; Thomas et al. Citation2001; Tien et al. Citation2020), the pressure loss versus time plot could be divided into three different sections: The depth filtration section showed a linear increase in pressure loss from 15.21.9 Pa in the initial state until a filtration time of around 30 min where a pressure loss of around 52.8
20.4 Pa was measured. Subsequently, the slope of the pressure loss curve increased and followed an intermediate shape (transition regime) caused by the initial formation of a dust cake (Figure 4a). After 45 min and at a pressure loss of 168.0
13.3 Pa, a linear increase with a higher slope than in the depth filtration regime could again be observed (surface filtration). The measurements were stopped after a filtration time of 60 min (498.0
25.3 Pa). The final dust capacity of the filter material used here (defined as loaded particle mass per filter area) was about 190 g/m,2 which is in same order of magnitude observed by Song et al. (Song and Shim Citation2021) for a similar filter but different test particles. For the selected particle sizes, the material showed a low overall mass filtration efficiency of 0.39
0.05 (number based: 0.09
0.01) in the initial state as expected from the large fiber diameter of 25 µm, with respect to the considered particle size, and high porosity (98%) of the filter material (see ). The evolution of the filtration efficiency was similar to that already shown in other studies (Charvet et al. Citation2018; Song and Shim Citation2021; Thomas et al. Citation2001; b). Upon completion of the depth filtration regime, the mass-based filtration efficiency reached a value of 0.48
0.04 (number based 0.17
0.06). During the transition regime, the value rose to 0.84
0.10 (number based 0.55
0.12). At the end of the filtration process, the mass-based filtration efficiency reached values of nearly 100% (mass based 0.88
12; number based 0.72
0.23).
Figure 4. Exemplary measured pressure loss as function of the filtration time (a); grade filtration efficiency at chosen filtration times (b); measured number and mass-based filtration efficiency (c).
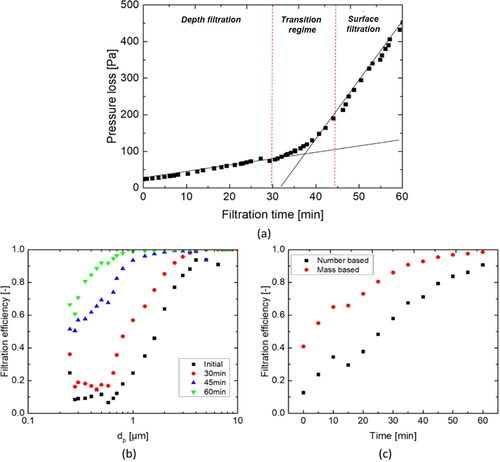
A breakdown into fractional filtration efficiencies (b) shows that deposition mainly occurred in the inertial interception dominated region. At the end of the 60 min filtration process, almost all particles in the micrometre range were retained. Particles in the submicron range continued to pass through the formed layer of particles. A summary of selected filtration efficiencies and pressure losses for the samples examined later in the XRM can be found in the supplementary materials Table S2.
3.2. Evaluation of tomographic methodology
3.2.1. Initial filter structure
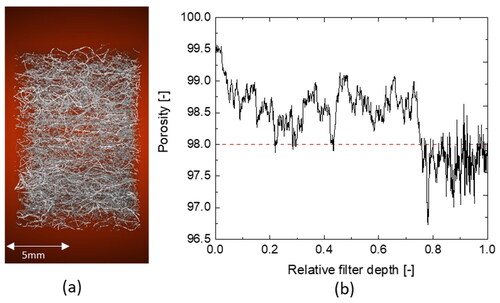
In , a reconstructed 3D image of the clean filter material is shown. gives the XRM-obtained porosity curve of the filter material. Variations in filter thickness of specimens are compensated by using a dimensionless relative filter depth with respect to the thickness of the filter specimen forming values in between 0 and 1. An analysis of the clean filter material shows a progressive structure with a 1 to 2 percent lower porosity (around 97.5%) in the last 20 percent of the filter length in comparison to the first 80 percent of the filter thickness (98.5%). The data agrees with the porosity determined from the gravimetric analysis ().
Figure 5. 3D-visualization of XRM-measured clean filter material (a), analyzed porosity as function of relative filter depth of clean filter material (dashed line shows the average porosity) (b).
3.2.2. Particle deposits
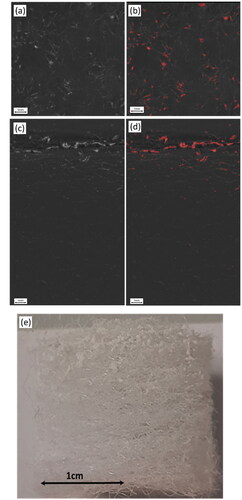
According to the measurements shown in Sec. 3.1, samples at the end of the depth filtration (30 min), the transition state (45 min), and the end of the surface filtration regime were analyzed via XRM in triplicate. The analysis and segmentation of the particles were conducted using samples with the highest dust load (60 min) to ensure sufficient comparison between optical observation and image analysis. The KI particles create an intense contrast and demarcation of the fibers of the filter material ( and ). This enables the establishment of a segmentation threshold for heavily loaded filters, as well as segmentation of particle deposits from the filter material which appears transparency at the applied measurement settings as intended compared to the particles ( and ). Optically, clearly visible particle clusters were brought into focus, and the threshold was set so they were segmented. This threshold was then fixed and applied to all further samples. A first evaluation of the particle distribution from the side of the sample () suggests that majority of particles are collected on the surface of the filter material. This image analysis can be qualitatively confirmed by correspondingly recorded camera images (). This behavior agrees well with previous studies (Jackiewicz, Jakubiak, and Gradoń Citation2015; Lehmann et al. Citation2005; Riefler et al. Citation2018; Schmidt Citation1995; Thomas et al. Citation2001).
Figure 6. Cross sectional image of reconstructed image in top view, raw (a) and segmented image (b). Cross sectional image of reconstructed image in side view, raw (c) and segmented image (d). Image of particle loaded filter sample from side view recorded with a camera (e).
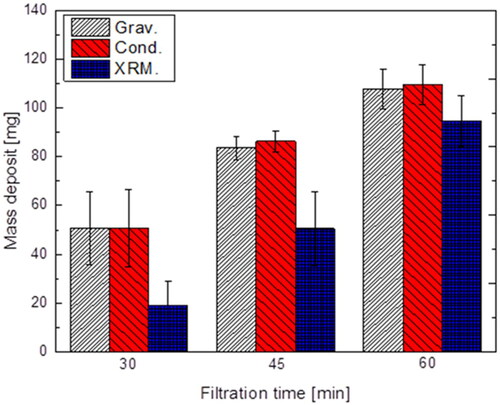
A quantitative comparison of the mass determined from XRM with the mass determined via conductivity and gravimetry is shown in . The gravimetric and conductivity data agree for all analyzed filtration times, verifying the accuracy of these measurement methods. The XRM analysis underestimated the mass by 10 to 20 percent for samples with the highest filtration time of 60 min. The difference in this value is attributed to primary particles and deposits smaller than 15 µm, which are not detectable by the XRM technology used. This discrepancy increases with decreasing filtration time. Thus, the mass after a filtration time of 30 min will contain about 50% of deposited primary particles and agglomerates smaller than 15 µm. During filtration, the number of agglomerates of the deposited total mass increased in comparison to the yield of trapped primary particles, and deviation from the applied analytical methods decreases. As the larger depositions are mainly influencing the dynamics of the filtration behavior, this is considered acceptable in terms of the measurement effort required.
Figure 7. Comparison of XRM-data of total deposited mass with complementary methods, error bars are ± 1 mean deviation of the triplicate measurements.
3.3. Tomographic analysis of filtration kinetics
3.3.1. Mass distribution of particle deposits
shows an example of the particles detected via the presented analysis method in the 3D view after a filtration time of 30 min (b), 45 min (c) and 60 min (d). As a reference, the 3D reconstruction of the clean filter material is also shown (a).
Figure 8. 3D visualization of clean filter material (a); after 30 min (b); after 45 min (c); after 60 min (d). Gas flow direction is from top to bottom.
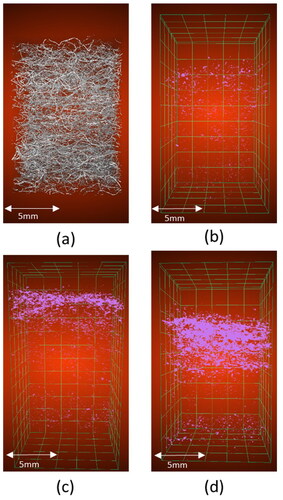
Generally, there is an increase in deposited particles with respect to the filtration time (b–d). Particle separation mainly occurs close to the filter inlet while only few particles are deposited within the filter’s depths. Overall, the particle concentration in the filter center is low. Nonetheless, a noticeable particle concentration is observed at the filter outlet, where the initial porosity of the filter material is decreased. This can be attributed to the two-stage porosity of the filter material (b). The majority of particles are deposited in the filter close to the inlet, while smaller particles remain airborne until the porosity of the filter material decreases. A quantification is given by the cumulative mass detected in the filter material as a function of the filter depth ().
Figure 9. Cumulative mass distribution inside the filter material (a); dm,80 as function of the relative filtration time (b), error bars are ±1 mean deviation of the triplicate measurements.
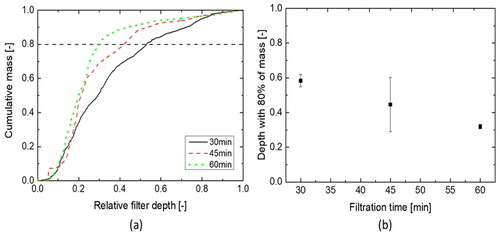
Based on these data, the parameter dm,80 was introduced, which is the dimensionless depth (see also Sec. 3.2.1) at which 80% of the detected mass was located. This parameter is presented for all tests (n = 3) including its mean deviation (). The data suggest that during the depth filtration regime, up to 30 min, the particles were distributed relatively uniformly across the filter length (dm,80=0.580.04), although a slight emphasis of deposition toward the upper layers of the filter material was observed. During the transition period, the yield of deposited mass apparently shifted to the upper layers of the filter material (dm,80=0.45
0.16). The significant decrease of this parameter indicates that the slightly higher deposition toward the upper layers intensifies after 30 min with increasing loading. The previously deposited particles reduce the porosity at these points, and act as additional collectors.
During surface filtration, most of the particle separation took place on the surface of the filter material (dm,80=0.320.01). This surface layer determined the macroscopic properties of the filter material in terms of pressure difference and filtration efficiency in this regime. Thus, this layer leads to a sharp increase in pressure loss and an almost complete separation of particles in the micron range (see ). It is still partially permeable for particles in the submicron range, although here, the separation efficiency increases compared to the initial state. In summary, the filter initially loaded relatively uniformly, and a shift in particle deposition toward the filter inlet was observed over time. This behavior is similar to the loading characteristics of different filter materials described in the literature (Jackiewicz, Jakubiak, and Gradoń Citation2015; Lehmann et al. Citation2005; Riefler et al. Citation2018; Schmidt Citation1995; Thomas et al. Citation2001) for different operating conditions and particles. An exception is the loading behavior described by Song et al. (Song and Shim Citation2021) for a coarse filter material with a similar structure as shown in this work, where initially a deposition of particles at the surface and then a shift toward deeper filter layers was described. The reasons for the different behavior were the different operating conditions, larger particle sizes, higher dust concentration and lower face velocity compared to the experimental set up described in this work. This indicates a high interaction between filter material and operating conditions, and the need for more in-depth investigations in future research.
3.3.2. Size distribution of particle deposits
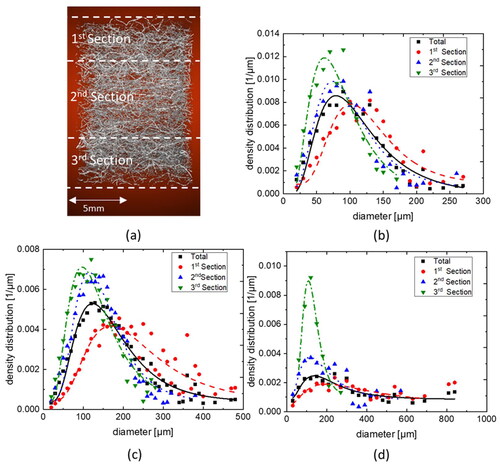
The size distribution in three sections of the filter was considered separately, as well as for the overall filter material. The filter was divided into dimensionless depth sections of 0–0.3, 0.3–0.7 and 0.7–1 (). The division into these three sections was chosen based on the previous results. The XRM-data of the clean filter materials examine that porosity differed significantly in the lower third of the depth in relation to the inflow direction of the clean filter (). Corresponding data of loaded filter materials showed that more than 80 percent mass of embedded particles was found in the first 30% of the filter at the highest loading state (). The size distributions determined in this way are shown for all considered filtration times in . It can be observed that the mean size increases with the filtration time, and that the deposits in the upper layers significantly determine the distribution. This result corresponds to the results from the mass distribution given in the previous section. The size distributions for samples with higher particle loadings (filtration time 60 min) indicate larger single objects (>600 µm) that stand out from the distribution. These could either have grown up during the filtration process or it could be an artifact where the reject software detected neighboring deposits as one large one. The size distributions can be described by a lognormal distribution as given by Equation (10), where µ is the expected value, and is the standard deviation. The distribution is shown as lines in the diagram in . The determined fit parameters are summarized under supplementary material Table S3.
(8)
(8)
Figure 10. Illustration of defined depth sections for one 3D image after filtration time of 60 min (a); size distribution total and in the three depth sections after a filtration time of 30 min (b); after a filtration time of 45 min (c); after a filtration time of 60 min (d).
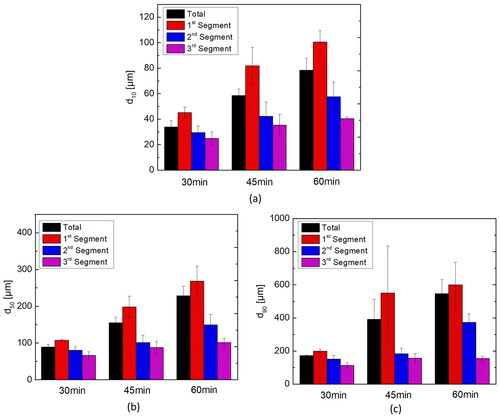
The results are further illustrated by plotting the quantiles (d10, d50 and d90) of the size distributions for all time steps and depth sections (n = 3) and are given in . A high standard deviation of the d90 is noted for the samples at a filtration time of 45 min. Here, in one measurement, a disproportionately large particle was observed in the measuring range. This may be a larger agglomerate formed during the filtration process. It could also be that a larger agglomerate has formed at the inlet to the flow channel, which was detached by the gas flow during the filtration process and then lay on top of the analyzed filter.
Figure 11. Quantiles of the determined size distribution of deposits within the filter material, total and individual depth sections, for a filtration time of 30 min (a); for a filtration time of 45 min (b); for a filtration time of 60 min (c), error bars are ±1 mean deviation of the triplicate measurements.
This shows that, as expected from the particle size distribution shown in , all values of the d50,total increase over the considered filtration times from 98.57.0 µm in the depth filtration state after 30 min filtration time (a) to 181.0
22.7 µm (b) and finally 210.7
43.2 µm (c) at the end of the considered filtration process. The d50,total at the end of the depth filtration resulted in detected deposits that are about five times larger than the initial fiber diameter, while the final d50,total at the end of the filtration process is about three times larger than the initial mean pore size (see for comparison).
The mass distributions () are consistent with the evolution of the quantiles, seen by analyzing the quantiles separately in the three defined sections of the filter material. The largest deposits were found in the uppermost layer for all considered filtration times. Here, the increase over the filtration time is also greatest in the d50 analyzed in the first depth section (from 117.92.6 µm after 30 min, to 261.3
55.7 µm after 60 min) and d90 (from 181.9
4.5 µm after 30 min, to 565.44
175.0 µm after 60 min). From this observation it can be concluded that the largest and, proportionally, greatest number of particles were deposited here. This also dominates the measured macroscopic effects shown in .
The d50 and d90, especially in the third depth section of the material, emphasize this conclusion. In contrast to the first depth section, there was only a slight increase from 30 to 45 min in the d50 from 75.19.9 µm to 109.9
33.1 µm and from 45 to 60 min during which the d50 decreased slightly to 97.6
14.5 µm. The fact that very few larger particles in the micrometre range penetrate the filter () is again evident from the data. The d90 in the third depth section, which slightly increased from 30 to 45 min filtration time (120.4
17.8 µm to 198.2
70.3 µm) but is similar to the d50 in the same depth section, decreased slightly in the surface filtration range (165.6
22.3 µm). A lower number of larger particles passing the upper layer, or the filtration of smaller particles penetrating the upper layer (see as reference also ) or an interaction of both effects could explain the weaker increase of the quantiles in the deeper depth sections. Regardless, there was a slower growth of the deposits within these depth sections.
A relatively sharp increase in the d90-quantile from 45 to 60 min filtration time within the middle depth section (see ), from 189.431.3 µm to 348.3
88.0 µm in comparison to a value of 159.2
21.0 µm at the end of the depth filtration, was observed. This could be interpreted as deposition shifting to deeper layers with increasing loading. However, since it is suspected that the upper layer already filters a large part of the incoming particulate mass, this is unlikely. It is more likely that larger agglomerates detached during the loading process due to the flow and were recaptured in deeper layers. The larger agglomerates are more likely to be dislodged by shear forces exerted by the gas flow, as they must withstand higher torques about the fibers due to larger lever arms. This was observed in filter materials to a greater extent by (Jackiewicz, Jakubiak, and Gradoń Citation2015), who initiated a gas flow through a dust-loaded filter medium to observe the rearrangement of the deposits. Zoller et al. (Citation2021) also considered break up of agglomerates on individual fibers at increased shear forces.
3.3.3. Structure of particle deposits
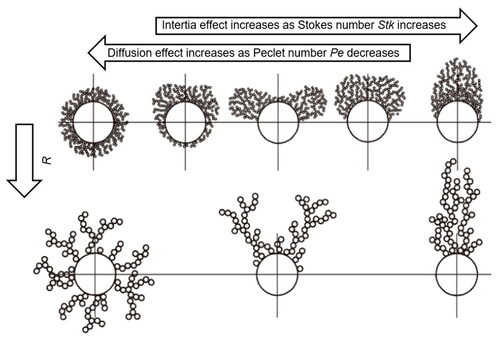
For better classification of the results presented in this article, the work of Kanaoka, who established a systematic relationship between deposit structures and flow conditions (), is discussed. These results were extended and confirmed by simulations and experiments in later work by other researchers (Hosseini and Vahedi Tafreshi Citation2012; Kasper, Schollmeier, and Meyer Citation2010; Kasper et al. Citation2009; Lehmann Citation2005). The authors showed that in diffusion-dominated flow regimes, symmetrical particle deposits are formed, while in filtration processes with more dominant inertial forces, a compact structure forms facing the incoming flow. In the interception-dominated region (small Stokes number and small Peclet number), formation of dendritic structures in a perpendicular direction to the incident flow was observed.
Figure 12. Systematic relationship between deposit structure and flow conditions. Image was taken and modified from Kanaoka (Citation2019) who took this from the original publication.
The structure of the deposits in the filter material used here was determined using the procedure described in Sec. 2.3.2 (n = 3). In comparison to the results concerning mass and size distribution, the resolution is further limited here to deposits with a minimum size of 20 voxels (spherical equivalent diameter > 39 µm) This leads to the fact that, depending on the filtration time, the structure of 30% to 60% of the detected deposits can be analyzed. As expected, the results did not show a uniform structure, but rather a distribution ().
Figure 13. Distribution of aspect ratio in orthogonal to flow direction Axz (a); distribution of aspect ratio with the flow direction Axy (b); distribution of aspect ratio with the flow direction Azy (c), error bars are ±1 mean deviation of the triplicate measurements.
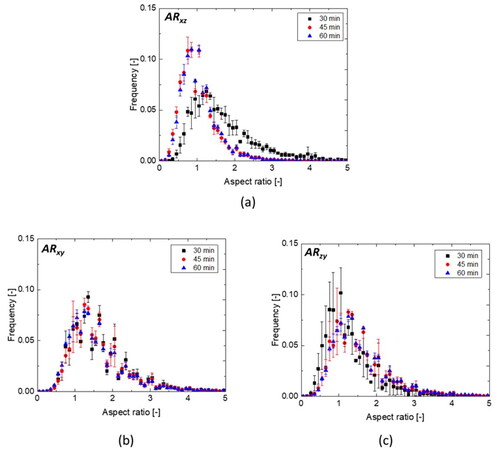
The analysis of the orientation of the deposits orthogonal to the flow direction was performed using the introduced parameter ARxz (see ). The deposits detected after a filtration time of 30 min are grown predominantly in the x-direction, perpendicular to the flow direction. AR values larger than 1 also indicate an asymmetric shape of the deposits. During the transition period (from 30 to 45 min) up to the surface filtration phase (from 45 to 60 min), the AR distribution shifts toward more symmetrical and slightly negative aspect ratio values. Here, a change of orientation seems to have occurred. It is probable that during the depth filtration phase, the particles align themselves along the fibers of the filter material in x-direction giving positive AR-values. At higher loadings of the filter material, the preexisting deposits have a stronger effect on the separation efficiency and a change in alignment occurs. Moreover, between a filtration time of 45 min and 60 min, there seems to be no difference in the distribution of the ARxz. From this, it could be concluded that from the transition range defined here to surface filtration, there is no more change in the structure, and the deposits continue to grow uniformly under the experimental conditions investigated.
For the two defined aspect ratios with the flow direction (ARxy and ARzy) shown in , similar distributions could be observed in the x- and z-directions. The aspect ratio of these deposits are greater than one for both defined AR, which means that the deposits tended to be oriented to the sides in the x- and z-directions. Furthermore, there appeared to be no change in orientation, as it was previously observed for the orientation perpendicular to the inflow direction. The orientation of the deposits did not seem to vary significantly for the analyzed deposit sizes and filtration times.
The slight shift of the center of gravity of the orientation distribution toward the x- and z-directions indicates uniform growth perpendicular to the incoming flow. In Kanaoka’s classification (Kanaoka Citation2019), this deposition pattern suggests the interception mechanism was dominant during deposition (). This is reasonable given the moderate Stokes number (Stk = 0.67) and interception parameter (R = 0.06) of the flow conditions summarized in Sec. 2.2. For further investigations, it would be advisable to vary these two parameters. For example, if the Stokes number was increased, a shift of the AR toward the y-direction (values ARxy and ARzy < 1) would be expected in accordance with the system developed by Kanaoka.
4. Conclusions
In this work, the microscopic loading behavior of a fibrous depth filter during gas cleaning was investigated by means of X-ray microscopy. By using iodine-containing particles, contrast between filter material and particles was realized and previous limitations regarding image segmentation were successfully overcome. With this methodology new insights regarding mass distributions, size distributions and structure of the deposits could be gained. It was found that with increasing filtration time, particle deposition shifted upstream toward the upper layers. At the highest loading considered, over 80% of the mass was found in the uppermost 30% of the filter medium. This behavior was compared with previous work in the literature. Similar values on macroscopic level such as pressure loss and filtration efficiency were found but particular differences in microscopic loading behavior caused most likely by different filtration conditions (e.g., Particle size, face velocity). It was concluded that this is probably the result of a strong dependence of the loading behavior on the filter material and an interaction with the operating conditions such as particle size or face velocity requiring further research in this field. The data showed that a large proportion of the mass trapped in the upper layers determined the macroscopic values such as pressure loss and filtration efficiency. Furthermore, the structure and spatial orientation of occurring particle deposits during the filtration process were analyzed in time and spatial resolution. The spatial structure of the analyzed deposits was analyzed and compared with deposit-structure/flow-condition relationships known from the literature on single isolated fibers and a qualitative agreement with these findings was found.
The data obtained and methods developed open the opportunity for further investigations of filtration on the microscopic level in different filter material structures and varying operating conditions. In addition, the experimental data can assist the development of models for improved prediction of dynamic filtration characteristics. Further work will focus on optimizing the analysis methodology. For example, the resolution is still above the primary particle diameter considered. Therefore, the minimal detectable diameter can be significantly reduced by reducing the sample volume, for example when analyzing individual depth sections of the filter material. Furthermore, work is currently underway to improve the contrast and segmentation of particles and fiber material.
| Nomenclature | ||
| Asample | = | cross sectional area of dust loaded filter sample measured in XRM |
| Axrm | = | cross sectional area used for analysis via XRM |
| Arx,y | = | aspect ratio of particle deposit defined in x- and y-direction [-] |
| Arx,y | = | aspect ratio of particle deposit defined in x- and y-direction [-] |
| Arz,y | = | aspect ratio particle deposit defined in z and y-direction [-] |
| C | = | Conductivity [S/cm] |
| cin,g | = | inlet concentration of gas stream number and grade based [1/m3] |
| cin,m | = | inlet concentration of gas stream mass based [kg/m3] |
| cin,n | = | inlet concentration of gas stream number based [1/m3] |
| cout,g | = | outlet concentration of gas stream number and grade based [1/m3] |
| cout,m | = | outlet concentration of gas stream mass based [kg/m3] |
| cout,n | = | outlet concentration of gas stream number based [1/m3] |
| d10 | = | 10%-quantile of deposition size distribution [µm] |
| d50 | = | 50%-quantile of deposition size distribution [µm] |
| d90 | = | 90%-quantile of deposition size distribution [µm] |
| dfilter | = | filter sample diameter [m] |
| df,50 | = | mean fiber diameter [m] |
| dm,80 | = | Depth of filter within 80 percent of the mass is deposited [dimensionless] |
| dp,50 | = | mean pore diameter [m] |
| Eg | = | grade filtration efficiency [dimensionless] |
| Em | = | mass based filtration efficiency [dimensionless] |
| En | = | number based filtration efficiency [dimensionless] |
| lfilter | = | filter thickness [m] |
| mcond. | = | mass of deposited particles via conductivity [kg] |
| mgrav,filter | = | gravimetric filter mass [kg] |
| mgrav | = | mass of deposited particles via gravimetry [kg] |
| mXRM | = | mass of deposited particles via X-ray microscopy [kg] |
| = | density of particles [kg/m3] | |
| = | density of filter material [kg/m3] | |
| R | = | interception parameter [dimensionless] |
| Stk | = | Stokes number |
| xmax | = | maximum x-coordinate of particle deposit [dimensionless] |
| xmin | = | minimum x-coordinate of particle deposit [dimensionless] |
| ymax | = | maximum y-coordinate of particle deposit [dimensionless] |
| ymin | = | minimum y-coordinate of particle deposit [dimensionless] |
| zmax | = | maximum z-coordinate of particle deposit [dimensionless] |
| zmin | = | minimum z-coordinate of particle deposit [dimensionless] |
| Vsegmented,objects | = | volume of segmented particle deposits [m3] |
| = | gas volume flow [m3/s] | |
Supplemental Material
Download MS Word (41.3 KB)Supplemental Material
Download MS Word (21.1 KB)Supplemental Material
Download MS Word (17.9 KB)Acknowledgments
The authors are grateful for the assistance of Elizabeth Ely (EIES, Lafayette, IN, USA) in preparing the manuscript. We also acknowledge support by the Open Access Publishing Fund of Anhalt University of Applied Science.
Additional information
Funding
References
- Al‐Omari, A., and E. Masad. 2004. Three dimensional simulation of fluid flow in X‐ray CT images of porous media. Int. J. Numer. Anal. Meth. Geomech. 28 (13):1327–60. doi:10.1002/nag.389.
- Azimian, M., C. Kühnle, and A. Wiegmann. 2018. Design and optimization of fibrous filter media using lifetime multipass simulations. Chem. Eng. Technol. 41 (5):928–35. doi:10.1002/ceat.201700585.
- Bargmann, S., B. Klusemann, J. Markmann, J. E. Schnabel, K. Schneider, C. Soyarslan, and J. Wilmers. 2018. Generation of 3D representative volume elements for heterogeneous materials: A review. Prog. Mater. Sci. 96:322–84. doi:10.1016/j.pmatsci.2018.02.003.
- Bollmann, S., and P. Kleinebudde. 2021. Evaluation of different segmentation methods of X-ray micro computed tomography images. Int. J. Pharm. 606:120880. doi:10.1016/j.ijpharm.2021.120880.
- Chang, D.-Q., C.-Y. Tien, C.-Y. Peng, M. Tang, and S.-C. Chen. 2019. Development of composite filters with high efficiency, low pressure drop, and high holding capacity PM2. 5 filtration. Sep. Purif. Technol. 212:699–708. doi:10.1016/j.seppur.2018.11.068.
- Charvet, A., S. Du Rolland Roscoat, M. Peralba, J. F. Bloch, and Y. Gonthier. 2011. Contribution of synchrotron X-ray holotomography to the understanding of liquid distribution in a medium during liquid aerosol filtration. Chem. Eng. Sci. 66 (4):624–31. doi:10.1016/j.ces.2010.11.008.
- Charvet, A., S. Pacault, S. Bourrous, and D. Thomas. 2018. Association of fibrous filters for aerosol filtration in predominant Brownian diffusion conditions. Sep. Purif. Technol. 207:420–6. doi:10.1016/j.seppur.2018.06.045.
- Chaudhuri, J., K. Boettcher, and P. Ehrhard. 2021. Numerical investigation of coalescence filtration: Multiphase flow through fibrous structures. Sep. Purif. Technol. 257:117853. doi:10.1016/j.seppur.2020.117853.
- Chaudhuri, J., K. Boettcher, and P. Ehrhard. 2022. Optical investigations into wetted commercial coalescence filter using 3D micro-computer-tomography. Chem. Eng. Sci. 248:117096. doi:10.1016/j.ces.2021.117096.
- Du Rolland Roscoat, S., M. Decain, X. Thibault, C. Geindreau, and J.-F. Bloch. 2007. Estimation of microstructural properties from synchrotron X-ray microtomography and determination of the REV in paper materials. Acta Mater. 55 (8):2841–50. doi:10.1016/j.actamat.2006.11.050.
- Emerson, M. J., K. M. Jespersen, A. B. Dahl, K. Conradsen, and L. P. Mikkelsen. 2017. Individual fibre segmentation from 3D X-ray computed tomography for characterising the fibre orientation in unidirectional composite materials. Composites Part A: Applied Science and Manufacturing 97:83–92. doi:10.1016/j.compositesa.2016.12.028.
- Emerson, M. J., Y. Wang, P. J. Withers, K. Conradsen, A. B. Dahl, and V. A. Dahl. 2018. Quantifying fibre reorientation during axial compression of a composite through time-lapse X-ray imaging and individual fibre tracking. Compos. Sci. Technol. 168:47–54. doi:10.1016/j.compscitech.2018.08.028.
- Fotovati, S., H. Vahedi Tafreshi, and B. Pourdeyhimi. 2010. Influence of fiber orientation distribution on performance of aerosol filtration media. Chem. Eng. Sci. 65 (18):5285–93. doi:10.1016/j.ces.2010.06.032.
- Geerling, C., M. Azimian, A. Wiegmann, H. Briesen, and M. Kuhn. 2020. Designing optimally‐graded depth filter media using a novel multiscale method. AIChE J. 66 (2):e16808. doi:10.1002/aic.16808.
- Gervais, P.-C., S. Poussier, N. Bardin-Monnier, G. Karcher, and D. Thomas. 2014. Combination of Single-Photon Emission and X-Ray Computed Tomography to visualize aerosol deposition in pleated filter. Sep. Purif. Technol. 126:52–61. doi:10.1016/j.seppur.2014.02.011.
- Hoferer, J., M. J. Lehmann, E. H. Hardy, J. Meyer, and G. Kasper. 2006. Highly resolved determination of structure and particle deposition in fibrous filters by MRI. Chem. Eng. Technol. 29 (7):816–9. doi:10.1002/ceat.200600047.
- Hoppach, D., E. Werzner, C. Demuth, E. Löwer, H. Lehmann, L. Ditscherlein, R. Ditscherlein, U. A. Peuker, and S. Ray. 2020. Experimental investigations of the depth filtration inside open‐cell foam filters supported by high‐resolution computed tomography scanning and pore‐scale numerical simulations. Adv. Eng. Mater. 22 (2):1900761. doi:10.1002/adem.201900761.
- Hoppe, K., M. Maricanov, G. Schaldach, R. Zielke, D. Renschen, W. Tillmann, M. Thommes, and D. Pieloth. 2020. Modeling the separation performance of depth filter considering tomographic data. Environ. Prog. Sust. Energy 39 (5):e13423. doi:10.1002/ep.13423.
- Hosseini, S. A., and H. V. Tafreshi. 2011. On the importance of fibers’ cross-sectional shape for air filters operating in the slip flow regime. Powder Technol. 212 (3):425–31. doi:10.1016/j.powtec.2011.06.025.
- Hosseini, S. A., and H. Vahedi Tafreshi. 2012. Modeling particle-loaded single fiber efficiency and fiber drag using ANSYS–Fluent CFD code. Computers & Fluids 66 (Supplement C):157–66. doi:10.1016/j.compfluid.2012.06.017.
- Hotaling, N. A., K. Bharti, H. Kriel, and C. G. Simon. 2015. DiameterJ: A validated open source nanofiber diameter measurement tool. Biomaterials 61:327–38. doi:10.1016/j.biomaterials.2015.05.015.
- Jabri, W., P. Vroman, and A. Perwuelz. 2015. Study of the influence of synthetic filter media compressive behavior on its dust holding capacity. Sep. Purif. Technol. 156:92–102. doi:10.1016/j.seppur.2015.09.068.
- Jackiewicz, A., S. Jakubiak, and L. Gradoń. 2015. Analysis of the behavior of deposits in fibrous filters during non-steady state filtration using X-ray computed tomography. Sep. Purif. Technol. 156:12–21. doi:10.1016/j.seppur.2015.10.004.
- Jaganathan, S., H. Vahedi Tafreshi, and B. Pourdeyhimi. 2008. A realistic approach for modeling permeability of fibrous media: 3-D imaging coupled with CFD simulation. Chem. Eng. Sci. 63 (1):244–52. doi:10.1016/j.ces.2007.09.020.
- Jin, X., L. Yang, X. Du, and Y. Yang. 2017. Modeling filtration performance of elliptical fibers with random distributions. Adv. Powder Technol. 28 (4):1193–201. doi:10.1016/j.apt.2017.02.005.
- Kanaoka, C. 2019. Fine particle filtration technology using fiber as dust collection medium. KONA 36 (0):88–113. doi:10.14356/kona.2019006.
- Kanaoka, C., H. Emi, and T. Myojo. 1980. Simulation of the growing process of a particle dendrite and evaluation of a single fiber collection efficiency with dust load. J. Aerosol Sci. 11 (4):377–89. doi:10.1016/0021-8502(80)90046-4.
- Kasper, G., S. Schollmeier, and J. Meyer. 2010. Structure and density of deposits formed on filter fibers by inertial particle deposition and bounce. J. Aerosol Sci. 41 (12):1167–82. doi:10.1016/j.jaerosci.2010.08.006.
- Kasper, G., S. Schollmeier, J. Meyer, and J. Hoferer. 2009. The collection efficiency of a particle-loaded single filter fiber. J. Aerosol Sci. 40 (12):993–1009. doi:10.1016/j.jaerosci.2009.09.005.
- Lee, H. R., L. Liao, W. Xiao, A. Vailionis, A. J. Ricco, R. White, Y. Nishi, W. Chiu, S. Chu, and Y. Cui. 2021. Three-dimensional analysis of particle distribution on filter layers inside N95 respirators by deep learning. Nano Lett. 21 (1):651–7. doi:10.1021/acs.nanolett.0c04230.
- Lehmann, M. J. 2005. Untersuchungen zur Struktur und zur Beladungskinetik von Faserfiltern. Dissertation, Universität Karlsruhe.
- Lehmann, M. J., E. H. Hardy, J. Meyer, and G. Kasper. 2005. MRI as a key tool for understanding and modeling the filtration kinetics of fibrous media. Magn. Reson. Imag. 23 (2):341–2. doi:10.1016/j.mri.2004.11.048.
- Lehmann, M. J., J. Weber, A. Kilian, and M. Heim. 2016. Microstructure simulation as part of fibrous filter media development processes - From real to virtual media. Chem. Eng. Technol. 39 (3):403–8. doi:10.1002/ceat.201500341.
- Maschio, C., and A. C. F. de Arruda. 2001. Modeling of the efficiency of fibrous filters through numerical simulation and X-ray tomography. Adv. Powder Technol. 12 (3):311–29. doi:10.1163/156855201750537875.
- Miettinen, A., C. L. Luengo Hendriks, G. Chinga-Carrasco, E. K. Gamstedt, and M. Kataja. 2012. A non-destructive X-ray microtomography approach for measuring fibre length in short-fibre composites. Compos. Sci. Technol. 72 (15):1901–8. doi:10.1016/j.compscitech.2012.08.008.
- Myojo, T., C. Kanaoka, and H. Emi. 1984. Experimental observation of collection efficiency of a dust-loaded fiber. J. Aerosol Sci. 15 (4):483–9. doi:10.1016/0021-8502(84)90044-2.
- Nguyen Thi, T. B., M. Morioka, A. Yokoyama, S. Hamanaka, K. Yamashita, and C. Nonomura. 2015. Measurement of fiber orientation distribution in injection-molded short-glass-fiber composites using X-ray computed tomography. J. Mater. Process. Technol. 219:1–9. doi:10.1016/j.jmatprotec.2014.11.048.
- Poggemann, L., J. Meyer, and A. Dittler. 2021. A novel method to investigate detachment of particulate structures from an elastic single fiber at low gas flow velocities. J. Aerosol Sci. 156:105785. doi:10.1016/j.jaerosci.2021.105785.
- Prade, F., F. Schaff, S. Senck, P. Meyer, J. Mohr, J. Kastner, and F. Pfeiffer. 2017. Nondestructive characterization of fiber orientation in short fiber reinforced polymer composites with X-ray vector radiography. NDT & E International 86:65–72. doi:10.1016/j.ndteint.2016.11.013.
- Riefler, N., M. Ulrich, M. Morshäuser, and U. Fritsching. 2018. Particle penetration in fiber filters. Particuology 40:70–9. doi:10.1016/j.partic.2017.11.008.
- Roy, R., and S. M. Ishtiaque. 2020. Optimal design of a composite fibrous filter media through vertical integration of fibres in needle punched nonwoven. Compos. Commun. 22:100484. doi:10.1016/j.coco.2020.100484.
- Roy, R., and S. M. Ishtiaque. 2022. Customization of hierarchical air filter media by tailoring the structural parameters of needle punched nonwoven. J. Ind. Text. 51 (1_suppl):1542S–63S. doi:10.1177/15280837211029050.
- Schmidt, E. 1995. Experimental investigations into the compression of dust cakes deposited on filter media. Filtration & Separation 32 (8):789–93. doi:10.1016/S0015-1882(97)84129-8.
- Schmidt, E., and F. Löffler. 1990. Preparation of dust cakes for microscopic examination. 3rd French Colloquium on Powder Science & Technology 60 (2):173–7. doi:10.1016/0032-5910(90)80141-K.
- Schneider, Y., R. Zielke, C. Xu, M. Tayyab, U. Weber, S. Schmauder, and W. Tillmann. 2021. Experimental investigations of micro-meso damage evolution for a Co/WC-type tool material with application of digital image correlation and machine learning. Materials 14 (13):3562. doi:10.3390/ma14133562.
- Soltani, P., M. S. Johari, and M. Zarrebini. 2014. Effect of 3D fiber orientation on permeability of realistic fibrous porous networks. Powder Technol. 254:44–56. doi:10.1016/j.powtec.2014.01.001.
- Song, Y., and E. Shim. 2021. Structure characterization of the clogging process of coarse fibrous filter media during solid particle loading with X-ray micro-computed tomography. Sep. Purif. Technol. 273:118980. doi:10.1016/j.seppur.2021.118980.
- Straube, C., J. Meyer, and A. Dittler. 2021. Identification of deposited oil structures on thin porous oil mist filter media applying µ-CT imaging technique. Separations 8 (10):193. doi:10.3390/separations8100193.
- Théron, F., A. Joubert, and L. Le Coq. 2017. Numerical and experimental investigations of the influence of the pleat geometry on the pressure drop and velocity field of a pleated fibrous filter. Sep. Purif. Technol. 182:69–77. doi:10.1016/j.seppur.2017.02.034.
- Thomas, D., P. Penicot, P. Contal, D. Leclerc, and J. Vendel. 2001. Clogging of fibrous filters by solid aerosol particles Experimental and modelling study. Chem. Eng. Sci. 56 (11):3549–61. doi:10.1016/S0009-2509(01)00041-0.
- Tian, X., Q. Ou, J. Liu, Y. Liang, and D. Y. H. Pui. 2019. Particle loading characteristics of a two-stage filtration system. Sep. Purif. Technol. 215:351–9. doi:10.1016/j.seppur.2019.01.033.
- Tien, C.-Y., J.-P. Chen, S. Li, Z. Li, Y.-M. Zheng, A. S. Peng, F. Zhou, C.-J. Tsai, and S.-C. Chen. 2020. Experimental and theoretical analysis of loading characteristics of different electret media with various properties toward the design of ideal depth filtration for nanoparticles and fine particles. Sep. Purif. Technol. 233:116002. doi:10.1016/j.seppur.2019.116002.
- Yang, Y., S. Zhang, X. Zhao, J. Yu, and B. Ding. 2015. Sandwich structured polyamide-6/polyacrylonitrile nanonets/bead-on-string composite membrane for effective air filtration. Sep. Purif. Technol. 152:14–22. doi:10.1016/j.seppur.2015.08.005.
- Yared, W., C.-Y. Chen, N. Sievers, W. Tillmann, R. Zielke, and M. Schimpfermann. 2019. Void distribution in a brazed cemented carbide steel joint analyzed by X-ray microscopy. Measurement 141:250–7. doi:10.1016/j.measurement.2019.04.045.
- Yun, K. M., A. B. Suryamas, F. Iskandar, L. Bao, H. Niinuma, and K. Okuyama. 2010. Morphology optimization of polymer nanofiber for applications in aerosol particle filtration. Sep. Purif. Technol. 75 (3):340–5. doi:10.1016/j.seppur.2010.09.002.
- Zeiss. 2020. Zeiss Xradia Versa Product information. Accessed September 16, 2022. https://www.zeiss.de/mikroskopie/produkte/roentgenmikroskopie/xradia-downloads.html.
- Zoller, J., A. Zargaran, K. Braschke, J. Meyer, U. Janoske, and A. Dittler. 2021. Morphology of particulate deposits formed on a single filter fibre by exposure to mixed aerosol flow. J. Aerosol Sci. 152:105718. doi:10.1016/j.jaerosci.2020.105718.