
 ?Mathematical formulae have been encoded as MathML and are displayed in this HTML version using MathJax in order to improve their display. Uncheck the box to turn MathJax off. This feature requires Javascript. Click on a formula to zoom.
Abstract
The severe acute respiratory syndrome coronavirus 2 (SARS-CoV-2) pandemic has brought renewed attention to respiratory aerosol and droplet generation. While many studies have robustly quantified aerosol (<10 µm diameter) number and mass exhalation rates, fewer studies have explored larger droplet generation. This study quantifies respiratory droplets (>20 µm diameter) generated by a cohort of 76 adults and children using a water-sensitive paper droplet deposition approach. Unvoiced and voiced activities spanning different levels of loudness, different lengths of sustained phonation, and a specific manner of articulation in isolation were investigated. We find that oral articulation drives >20 µm droplet generation, with breathing generating virtually no droplets and speaking and singing generating on the order of 250 droplets min−1. Lip trilling, which requires extensive oral articulation, generated the most droplets, whereas shouting “Hey,” which requires minimal oral articulation, generated relatively few droplets. Droplet size distributions were all broadly consistent, and no significant differences between the children and adult cohorts were identified. By comparing the aerosol and droplet emissions for the same participants, the full size distribution of respiratory aerosol (0.5–1000 µm) is reported. Although <10 µm aerosol dominates the number concentration, >20 µm droplets dominate the mass concentration. Accurate quantification of aerosol concentrations in the 10–70 μm size range remains very challenging; more robust aerosol analysis approaches are needed to characterize this size range.
Graphical Abstract
EDITOR:
Introduction
The COVID-19 pandemic, caused by severe acute respiratory syndrome coronavirus 2 (SARS-CoV-2), has refocused attention on the importance of aerosols and droplets in infectious disease transmission. Inhalation of aerosols and droplets (<100 µm diameter) is a primary transmission route of SARS-CoV-2 (Morawska and Milton Citation2020; Xie et al. Citation2009) and other infectious diseases, including influenza, measles and tuberculosis (Wells and Wells Citation1936). Respiratory droplets can also deposit onto surfaces and cause indirect transmission by fomites (Wang, Prather, et al. Citation2021).
A mechanistic understanding of infectious disease transmission via inhalation requires a robust characterization of the size distribution of the respiratory droplets generated as well as their viral load. The sizes of these aerosols and droplets provide key information about their generation mechanisms, their expected lifetime in air, and appropriate mitigation approaches (e.g. face coverings, ventilation, physical distancing). Although the delineation between aerosols and droplets has been previously defined as 5 μm, in fact all particles <100 μm exhibit similar aerodynamic behavior (Prather et al. Citation2020). Consequently, size delineation between aerosols and droplets of 100 μm, which is the largest size that is both inhalable and can remain suspended in air for >5 s, has been proposed (Tang et al. Citation2021). In this study, to simplify terminology and because we measure liquid particles, we refer to particles >10 µm as droplets and particles <10 µm as aerosols.
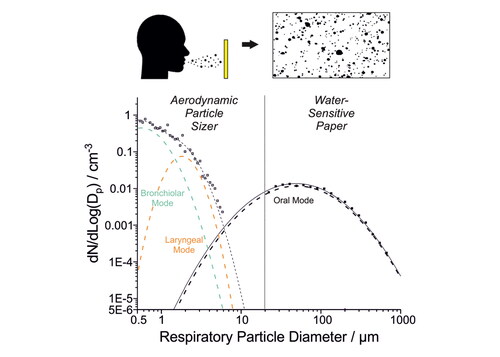
Respiratory aerosols and droplets are generated when a person breathes, vocalizes (speaking, humming or singing), coughs, or sneezes. Previous work has identified at least three modes associated with respiratory aerosols and droplets, each with a different origin (Johnson et al. Citation2011; L. Morawska et al. Citation2009; Pöhlker et al. Citation2021; Archer et al. Citation2022; Gregson et al. Citation2021). The bronchiolar mode consists of the smallest aerosol particles (generally <1 μm diameter) and is associated with breathing. Particles in the laryngeal mode are somewhat larger (generally 1–2 μm diameter) and are associated with vocalization. The oral mode consists of the largest droplets (generally assumed >10 μm diameter) and is associated with speech (articulation). Whereas many studies have investigated bronchiolar and laryngeal mode aerosol, owing in part to the existence of commercially available instrumentation to make measurements in the appropriate particle size range (Gregson et al. Citation2021; McCarthy et al. Citation2021; Archer et al. Citation2022), comparatively fewer studies have investigated oral mode droplets for which measurement approaches remain more rudimentary (Pöhlker et al. Citation2021).
Previous investigations of oral mode droplets have largely sampled them by impaction onto a surface (Xie et al. Citation2009; Johnson et al. Citation2011; Han et al. Citation2013; Ding et al. Citation2022; Duguid Citation1946; Wang, Fu, et al. Citation2021; Newsom et al. Citation2021; Loudon and Roberts Citation1967) or by light scattering analysis (Chao et al. Citation2009; Han, Weng, and Huang Citation2013; Stadnytskyi et al. Citation2020). Impaction studies are limited by size-dependent impaction efficiencies, which are determined by gravitational settling or inertial impaction (characterised by the Stokes number, Stk). Size-dependent detection efficiencies for respiratory droplets rarely have been quantified in the published literature, which may account for the divergence in published oral mode size distributions (Pöhlker et al. Citation2021). Light scattering studies are limited by the smaller cross-section of the respiratory jet accessible for analysis. Additionally, although light scattering studies can access much smaller sizes (nominally down to 2 µm) than impaction studies, they may be less likely to detect the largest droplets, which carry the most mass but are least abundant (Chao et al. Citation2009). Previous investigations of oral mode droplets have generally focused on breathing, speaking, sneezing and coughing, with little variation in the types of vocalization investigated (usually counting aloud). However, exploring variation in speech and articulation may provide insight into the factors driving droplet generation and whether certain types of vocalization are more likely than others to generate droplets (Abkarian et al. Citation2020; Abkarian and Stone Citation2020). Moreover, cohort sizes in previous studies have often been small (<20 participants) and have only investigated adults (rather than children) (Han, Weng, and Huang Citation2013). Previous work on <10 µm diameter respiratory aerosol has demonstrated interparticipant variability spanning orders of magnitude, with a minority of participants emitting the majority of the aerosol (Asadi et al. Citation2019; Archer et al. Citation2022; Gregson et al. Citation2021). Similarly robust cohort studies for oral mode droplets are needed.
This study quantifies the exhalation rates and size distributions of oral mode droplets for several unvoiced and voiced activities in a cohort of 76 adults and children using a water-sensitive paper droplet deposition analysis (WSP-DDA) approach. In combination with measurements of a participant’s minute ventilation, droplet concentrations are also quantified. Investigated activities include breathing, very vigorous exercise, speaking, singing, shouting, and voiced lip trilling. The range of activities allows the role of oral articulation in droplet generation to be investigated. The large cohort size permits a robust quantification of interparticipant variability and a comparison between children and adult cohorts. The results are compared with existing studies of oral mode droplets and with measurements of <10 μm aerosol generation on the same cohort.
Method
Human participants
The Public Health England Research Ethics and Governance of Public Health Practice Group (PHE REGG) approved this study (R&D reference 429). Written informed consent was obtained from all participants or their legal guardians, as appropriate. We recruited 58 adults: 25 adults were athletes (13 male, 12 female), with a mean age of 36 years, (SD ± 15 years, range 19–72) and normal body mass index (BMI) of 24 kg m−2 (SD ± 4) (Orton et al. Citation2022). A further 25 adults (13 male, 12 female) participated in a study on aerosol generation from speech and language therapy exercises. This cohort had a mean age of 45 years (SD ± 10, range 29–63) and included both novices and experienced practitioners of these exercises (13 novices, 12 experienced therapists). The final 8 adult participants were professional singers (4 male, 4 female), with a mean age of 40 years (SD ± 13, range 28–57) (Gregson et al. Citation2021). Through contact and collaboration with school choirs in England, we recruited 18 child volunteers (9 male, 9 female), with a mean age of 13.1 years (SD ± 0.7, range 12–14) (Archer et al. Citation2022). Informed consent was obtained from parents and guardians, who were present during the measurement protocol. All participants completed a prescreening questionnaire that included questions about their age, gender, weight, height, singing training history, and ethnicity to fulfill inclusion/exclusion criteria. Participant weight and height were measured by the investigators. Additionally, participants were healthy and did not report or exhibit any symptoms of respiratory disease. All received negative lateral flow tests for COVID-19 before participation in the study. This same human cohort also completed measurements of <10 µm aerosol during the same day (Orton et al. Citation2022; Gregson et al. Citation2021; Archer et al. Citation2022; Saccente-Kennedy et al. Citation2022).
Experimental design
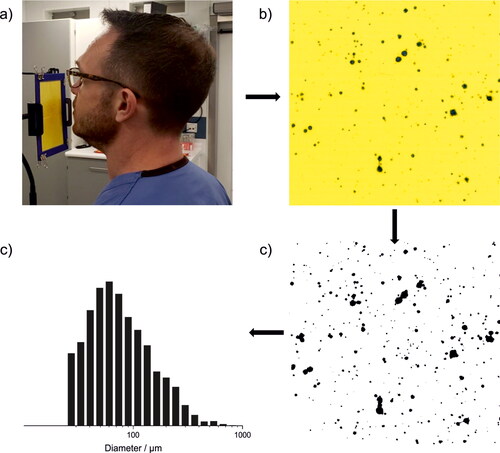
Respiratory droplets (>20 μm diameter) were measured from a range of exercises using the water-sensitive paper droplet deposition analysis (WSP-DDA) approach. The experimental and data analysis procedures are illustrated in . Participants were instructed to perform respiratory exercises for a specified time while facing four sheets of water sensitive paper (Pentair Hypro water-sensitive paper, each 51 mm x 76 mm with 4 tessellated as a square, ). When respiratory aerosols and droplets impact the paper, the bromophenol coating on the paper causes the color to change from yellow to blue (). The total surface area of the WSP was sufficiently large to intercept the entire respiratory jet from the participant at ∼10 cm from the mouth. The WSP was then scanned to generate a high-resolution digital image (Epson V39, 2400 dpi). A standardized image-processing procedure was applied to the raw images using the Fiji processing package embedded within ImageJ (Schindelin et al. Citation2012). First, artifacts arising from adsorbed dust and other preexisting (background) spots on the WSP were visually identifiable as spots with shapes, sizes, and colors distinct from those arising from respiratory droplet impaction. These spots were identified manually and removed from the analysis. Then, the scanned image was binarized to black and white () and the spot size distribution was retrieved from the binarized image. Because relatively few droplets are generated in this size range, only rarely would two deposited droplets overlap on the WSP. In these cases, there was usually a distinct separation between the two droplets, and the “watershed” feature on ImageJ was used to deconvolute the overlapping spots. Finally, the spot size distribution was converted to a droplet size distribution using a calibration ().
Figure 1. (a) Participant performing WSP-DDA experiment, (b) cropped image of WSP after experiment, (c) binarized image of (b), showing the detected respiratory droplets via image processing, and (d) size distribution of droplet diameters, calculated from stains detected on the WSP.
Multiple calibrations were explored to convert the spot size distribution to a droplet size distribution. The WSP manufacturer provides a calibration, which is comparable to that described in published literature on agricultural sprays (Sies et al. Citation2017). However, the manufacturer-provided calibration was generated using a spray nozzle, rather than with single droplets <100 μm diameter of well-defined size. Therefore, a separate calibration was conducted using individual droplets ejected from microdroplet dispensers (MJ-ABP-01, Microfab) with different orifice diameters (80 μm, 150 μm) and a micropipette (Pipetman L P2L) (Figure S1). A microdroplet dispenser was suspended <1 cm above the WSP and a monodisperse stream of water droplets ejected onto the paper. Ejected droplet sizes immediately at the point of generation from the dispenser were quantified using a stroboscopic imaging approach described previously (Miles et al. Citation2019). The size of droplets ranged from 65 to 81 µm diameter and the resulting spots generated by impaction onto WSP were analyzed as described above. The momentum of droplets impacting onto the paper affected the extent of color change. Consequently, impaction of droplets <100 µm generated by the microdroplet dispenser did not always cause a distinct color change from yellow to blue. However, for the calibration measurements made here, a clear color change (to dark yellow) was still detected. Droplets <60 μm diameter dispensed from the microdroplet dispenser did not generate any observable color change. To supplement the calibration, larger droplets were pipetted onto the WSP using a micropipette (800 to 1000 µm diameter droplets, from a distance of < 1 cm above the WSP). The resulting calibration is a quadratic fit to the experimental data (Figure S1).
To characterize the lower limit for detectable size from the WSP approach, two factors were considered. The first relates to imperfections in the uniformity in color of the WSP. Owing to heterogeneity in texture, extraneous spots were often detected after scanning fresh (unused) WSP, creating a background threshold only above which respiratory droplets can be detected. As illustrated in Figure S2, this background signal only becomes significant (>10 spots per size bin) for spots with corresponding calculated droplet sizes <20 μm diameter. A second consideration relates to the size-dependent droplet impaction efficiency onto the paper, which can be estimated from the droplet Stokes’s number, Stk (EquationEquation (1)(1)
(1) ):
(1)
(1)
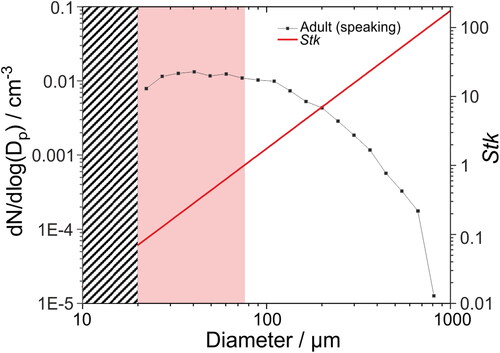
where ρρ is droplet density (assumed 1000 kg m−3), dp is droplet diameter, u0 droplet velocity, µg is the gas dynamic viscosity (1.81 × 10⁻⁵ Pa s), and L0 is the obstacle length (average WSP card assembly length is 10.5 cm). Stk depends on both the droplet size and the velocity of air emanating from the participant’s mouth. If Stk≪1, the respiratory droplets will follow the gas flow around the WSP instead of impacting. If Stk > 1, the respiratory droplets will impact the obstacle. shows a plot of Stk for a range of respiratory droplet sizes, assuming a gas velocity consistent with speaking (6 m s−1). The gas velocity was estimated by comparing measured velocities of speech by human participants in previous studies (Han et al. Citation2021; Chao et al. Citation2009). In this scenario, droplets >∼75 μm have Stk > 1 and so will deposit efficiently onto the WSP in our experimental configuration. By contrast, Stk for droplets ∼20–75 μm is between 0.1 and 1, so droplets in this size range will be less efficiently deposited onto the WSP, particularly at smaller droplet sizes. Because Stk is dependent on the respiratory jet velocity, deposition efficiencies may vary depending on the respiratory activity and even during a specific activity. For example, a decrease in the assumed gas velocity to 4 m s−1 would result in Stk = 1 at droplet diameter of ∼93 μm, whereas an increase in gas velocity to 12 m s−1 would give Stk = 1 at droplet diameter of ∼55 μm. Owing to the complexity of the experiment, it is not possible to correct for <100% droplet deposition efficiencies arising from low Stk. However, consideration of Stk enables a general assessment of how quantitative the approach may be at different droplet sizes.
Figure 2. Droplet size distribution of adults speaking (at 70–80 dBA) and estimated Stk assuming a respiratory jet velocity of 6 m s−1. The grey striped box represents the low-diameter limit that cannot be assessed by this method due to imperfections in the WSP and low impaction efficiency. The light red box indicates the region of droplet diameters where Stk < 1.
In our analysis, we assume that deposited droplet sizes are consistent with their original (humidified) size. Droplets are sampled directly in the exhaled respiratory jet very shortly (<1 s) after generation, which is insufficiently long for the droplet sizes considered here to equilibrate to the ambient relative humidity (Walker et al. Citation2021; Johnson et al. Citation2011).
Experimental protocol
A range of respiratory exercises were conducted across the different sub-cohorts. One repetition (either 30 s or 1 min) was performed for each activity.
Breathing
Breathing exercises were conducted by the cohort of athletes (n = 25) (Orton et al. Citation2022). Participants breathed at rest for 30 s, exhaling through an open mouth in a natural manner, referred to as At Rest. In a second breathing experiment, participants breathed for 30 s during “very vigorous exercise,” defined as exercising on a cycle-ergometer at a workload at +30% of the difference between the participant’s anaerobic workload and maximum peak workload (referred to as Exercise) (Orton et al. Citation2022).
Speaking
Speaking exercises were conducted by the adult speech and language therapy cohort (n = 25) and the children cohort (n = 18). Participants were instructed to speak the words of the “Happy Birthday” song to “dear Susan” for 1 min at 70 – 80 dBA (measured using a RS PRO RS-8852 Sound Level Meter, accuracy: ± 1.4 dB, dynamic range 30–130 dB, resolution 0.1 dB).
Singing
Singing exercises were conducted by the adult professional singers (n = 8) and children (n = 18) cohorts. Participants were instructed to sing the “Happy Birthday” song to “dear Susan” for 1 min at 70 – 80 dBA.
Speech and language therapy exercises (“Hey” and lip trills)
These exercises were conducted by the speech and language therapy cohort (n = 25). Participants were instructed to shout the word “Hey” repeatedly for 1 min. Participants were also instructed to perform voiced lip trills, which consists of sustained phonation together with adequate airflow to set the lips in self-sustaining oscillation for 30 s.
Minute ventilation measurements
A noninvasive reusable Vyntus Hans Rudolf mask kit (Hans Rudolph 7450 V2, complete with adapter and headgear; size: petite and medium, Vyaire Medical GmbH) with straps housing a rotating vane spirometer was used to measure participant minute ventilation (L min−1) during breathing, very vigorous exercise, speaking, and singing using the protocols described in our previous publications (Archer et al. Citation2022; Orton et al. Citation2022).
Calculations of number and mass concentrations
Number and mass concentrations were calculated from the WSP-DDA and minute ventilation measurements. Dividing total droplet counts (min−1) and total droplet mass (mg min−1) by minute ventilation enables estimation of droplet number (EquationEquation (2)(2)
(2) , cm−3) and mass (EquationEquation (3)
(3)
(3) , mg m−3) concentrations, respectively, for each participant, which can be compared to previous studies on respiratory aerosol emissions (Gregson et al. Citation2021; Archer et al. Citation2022; Asadi et al. Citation2019; Johnson et al. Citation2011; Chao et al. Citation2009).
(2)
(2)
(3)
(3)
For lip trills and shouting “Hey,” minute ventilation was not directly measured. Instead, the number and mass concentrations are estimated assuming a minute ventilation consistent with the mean minute ventilation of adults speaking (15.9 L min−1) (Gregson et al. Citation2021).
Statistical analysis
Measurements per activity per minute were averaged for each individual to ensure equivalence of the measurement across the different studies. Geometric means were calculated using logarithmic transformations of the data, and comparisons were made using paired t-tests. A p value <0.05 indicates statistical significance.
Results and discussion
Droplet generation was studied across a cohort of 76 participants. Activities including breathing (at rest and during very vigorous exercise), speaking, singing, shouting, and performing voiced lip trills were investigated. These activities cover unvoiced and voiced activities as well as different levels of loudness, different lengths of sustained phonation and one specific manner of articulation in isolation.
Total droplet number and mass exhalation rates
The total number of droplets expired per minute was quantified for each exercise (, provides the data underlying ). The box and whisker plots summarize results across the entire cohort, with data points indicating results from individual participants. Breathing at rest generated virtually no droplets. Breathing during very vigorous exercise generated a low number of droplets with wide interparticipant variability (spanning 0–∼100 droplets min−1) (median 12, IQR 5–21 min−1). By contrast, speaking, singing, and articulation (lip trills) resulted in emission of a significantly larger number of droplets than very vigorous exercise (p < 0.001 for adults speaking, children speaking and singing, and lip trills; p = 0.12 for adults singing). (The cohort size for adults singing was generally too small to make robust statistical comparisons.) Notably, the number of emitted droplets and the interparticipant variability were consistent across both speaking and singing and across both children and adult cohorts (median values spanning 227–276, IQR values spanning ∼100–700 min−1) (p = 0.19–0.86). The exception was for shouting “Hey,” which generated fewer droplets (median 0, IQR 0–3 min−1) than speaking or singing (p < 0.001 for “Hey” vs adults speaking and children speaking and singing; p = 0.12 for “Hey” vs adults singing) or even very vigorous exercise (p < 0.001), presumably because this vocalization can be performed with an open mouth and requires minimal oral articulation. Lip trills generated the most droplets (median 2121, IQR 1603–5323 min−1) (adults: p(speaking)=0.0020, p(singing)=0.062; children: p(speaking)=0.0021, p(singing)=0.0016), largely due to the sustained and repetitive nature of a trilled articulation, in this case involving mucosal surfaces (the lips) (Abkarian and Stone Citation2020). Consistent with previous studies of respiratory aerosol (Gregson et al. Citation2021; Archer et al. Citation2022; Orton et al. Citation2022), interparticipant variability is substantial, spanning roughly one order of magnitude for most activities.
Figure 3. Comparison of (a) total number and (b) total calculated mass of droplets expired per minute from participants during each vocalization experiment.
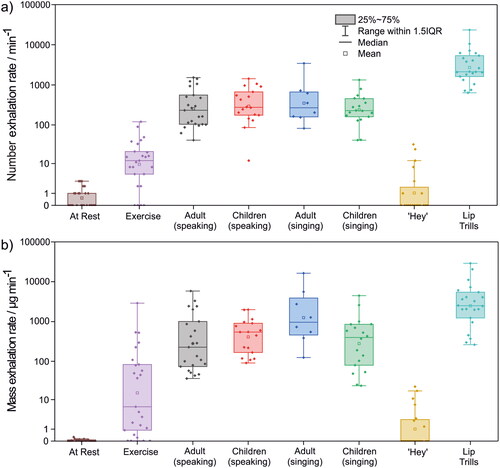
Table 1. Droplet number and mass exhalation rates from different respiratory activities.
The total droplet mass emitted per minute of activity can be estimated by assuming the droplet density is equivalent to that of water (1 g cm−3) (). Qualitative trends in the results are broadly consistent with those reported in . The droplet mass exhalation rate during very vigorous exercise varies widely (4–5 orders of magnitude), a consequence of large interparticipant variability in both the number and sizes of droplets generated. Nonetheless, very vigorous exercise (median 6, IQR 2–82 µg min−1) broadly generates less aerosol mass than vocalisations requiring articulation (speaking and singing), although the differences are not always statistically significant (adults: p(speaking)=0.038, p(singing)=0.14; children: p(speaking)=0.022, p(singing)=0.078). Lip trills had the largest mass exhalation rate (median 2489, IQR 1224–5431 µg min−1) (adults: p(speaking)=0.012, p(singing)=0.57; children: p(speaking)=0.0078, p(singing)=0.0092).
Droplet count distributions
Droplet size distributions are reported in . shows the mean droplet count per minute of activity for all activities studied except for breathing, which generated a negligible number of droplets. A key observation is that the droplet size distributions for speaking and singing are consistent across all cohorts and consist of a broad distribution centered at approximately 50 μm diameter. Lip trills also generate a similar size distribution to vocalizing, albeit with a sharper decay at larger droplet sizes. The size distributions generated by very vigorous exercise and shouting “Hey” are qualitatively different to the other vocalisations but these are more challenging to interpret given the extremely low number of droplets generated by these activities (<1 min−1 per size bin).
Figure 4. Comparison of mean size distributions of (a) droplet counts per minute for each vocalization experiment and (b) the mean concentration for each size bin. Lines represent lognormal fits. Shaded bands represent the standard error for the mean droplet size distribution. Standard error is not shown in (a) due to the large variabilities associated with some of the activities.
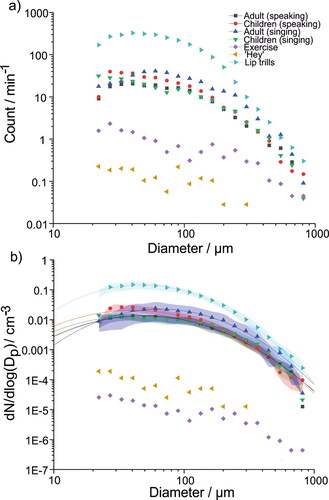
Droplet number concentrations and size distributions
Droplet number () and mass () concentrations were calculated from the measured number exhalation and the minute ventilation rates (Table S1). The values are summarized in . Similar to , lip trills generated the highest droplet number and mass concentrations (number: p(adults speaking)=0.0020, p(adults singing)=0.0050, p(children speaking)=0.0031, p(children singing)=0.0019; mass: p(adults speaking)=0.010, p(adults singing)=0.52, p(children speaking)=0.012, p(children singing)=0.012). Speaking and singing number and mass concentrations are consistent across cohorts and activity (p = 0.20–0.97). Shouting “Hey” generates a similar concentration to very vigorous exercise (p(number)=0.53, p(mass)=0.11), a consequence of the low droplet count and high minute ventilation associated with very vigorous exercise relative to vocalizing.
Figure 5. Comparison of (a) average droplet number concentration and (b) average calculated droplet mass concentration per volumetric unit per second. Minute ventilation was measured directly for speaking, singing, and very vigorous exercise and was estimated for shouting “Hey” and lip trills. Only non-zero value data points are shown for Exercise and shouting “Hey.” Because many data points are zero-valued, there is no lower whisker for Exercise and only the mean, upper quartile line, and upper whisker are shown for shouting “Hey.”
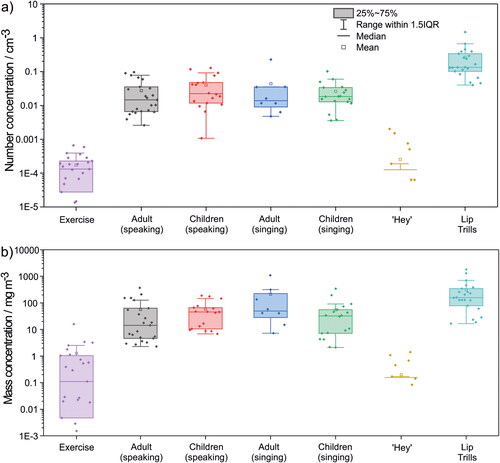
Table 2. Number and mass concentration values oral droplets ().
Size distributions for singing, speaking, shouting “Hey,” very vigorous exercise, and lip trills as concentrations (i.e., dN/dlog(Dp)/cm−3) are reported in . Each size distribution was fit to a unimodal lognormal distribution with fit parameters summarized in . For speaking and singing, the size distributions are very similar, with mean diameters around 40–50 μm for children and adults speaking and children singing. The mean diameter for adults singing is slightly larger (66 μm). However, these modes are broad and the adult singing sub-cohort is very small (n = 8), so the differences observed in mean diameter are not significant. Lognormal fits for very vigorous exercise and shouting “Hey” are not shown because the very low number of particles detected in each size bin (<1 min−1, see ) meant that the number concentration could not accurately be ascertained (Gregson et al. Citation2022). The main conclusion from is that all activities requiring articulation generate similar droplet size distributions, suggesting oral mode droplets arise primarily due to oral articulation rather than phonation or respiration in isolation.
Table 3. Parameters for lognormal distributions fit to measured droplet size distributions for each activity.
Comparisons of oral droplet size distributions with existing literature
Our measured mean oral mode size distribution (for adults speaking) is compared with previously published results from other groups in . A bimodal size distribution developed by Pöhlker et al. (Citation2021) to represent the previously published oral mode data is also included. As discussed above, for adults speaking, a single, broad oral mode centered about 49 μm diameter is observed. At large droplet sizes (>100 μm diameter) our results are consistent with previous studies, which all converge on the declining tail of the oral mode.
Figure 6. Comparison of the speaking size distributions for our data (adults speaking) and previous studies. In all previous studies, participants counted, whereas in our study participants spoke the words to the “Happy Birthday” song. The black line represents the lognormal fit to our adult speaking data set.
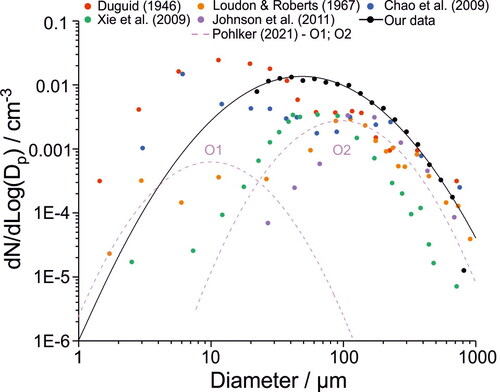
However, there are some important differences among the studies at smaller droplet sizes. First, similar to Xie et al. (Citation2009) and Johnson et al. (Citation2011), and in contrast to Duguid (Citation1946), Loudon and Roberts (Citation1967), and Chao et al. (Citation2009), we observe no evidence for a second oral mode centered around 10 μm diameter. It is worth noting that our approach is less sensitive to the detection of droplets <∼75 μm owing to their low Stk and is completely insensitive to droplets <20 μm diameter due to background noise from the WSP. Note that all studies (except for Chao et al. (Citation2009), who used a light scattering approach to measure respiratory droplets) would suffer from similar sensitivity challenges due to their use of impaction to detect droplets, although the extent would depend on the experimental orientation and distance from participant.
Second, our measurements show that the single oral mode extends to much smaller sizes than measured by both Xie et al. (Citation2009) and Johnson et al. (Citation2011). This observation is consistent with the different experimental setups used in each study. Johnson et al. (Citation2011) measured droplets that sedimented onto glass slides placed below the respiratory jet. Therefore, their experiment necessarily was less sensitive to smaller oral droplets, which are less likely to quickly sediment and instead would follow the direction of the respiratory jet. Xie et al. (Citation2009) measured droplets that either sedimented or impacted onto slides attached to their measurement box walls, which extended 33.8 mm beyond the participant’s mouth. While >97% of detected droplets sedimented on the slides placed on the bottom of the box, most of the remaining droplets impacted against the slides secured to the back wall. Because of the long distance, substantial dispersion may have occurred resulting in under-reporting of the smaller droplets. In our study, the WSP was placed 10 cm from the participant’s mouth to intercept the entire respiratory jet (and at a higher velocity, increasing Stk). Consequently, we expect to sample smaller droplets more efficiently in our experiment.
In this study participants spoke or sang the words to the “Happy Birthday” song, whereas in previous studies participants were invited to count. The modest differences in size distributions between our study and previous studies are unlikely to be due to the specific activity, as droplets are primarily generated by oral articulation (see and ). However, the higher number concentration we observe may be due to the “Happy Birthday” song requiring additional oral articulation relative to counting.
Comparing respiratory aerosol and droplet size distributions
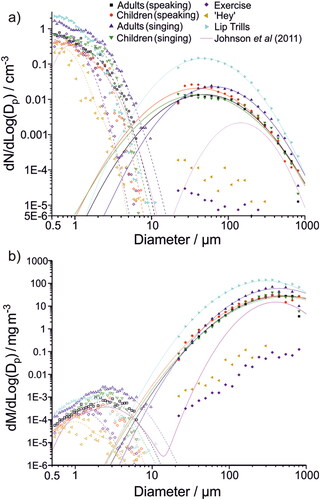
Respiratory aerosol size distributions measured using an APS (0.5–10 μm diameter) (Gregson et al. Citation2021; Archer et al. Citation2022) and the larger oral droplets measured in this study (>20 μm diameter) were combined to show the full range of respiratory aerosol and droplet generation across 0.5–1000 µm for very vigorous exercise, speaking, singing, shouting “Hey,” and lip trilling (). (Lognormal distributions for all activities across the entire size range are summarized in Table S2.) For speaking, singing, shouting “Hey,” and lip trilling, the APS data consist of two modes: one associated with breathing centered about 0.6 μm diameter, and one associated with vocalization centered about 1.7 μm diameter (Gregson et al. Citation2021; Archer et al. Citation2022). For very vigorous exercise, only the smaller mode associated with breathing is observed. As discussed above, the oral mode is broad and centered at larger sizes (∼50 μm for speaking, singing, and lip trilling). Consistent with previous investigations of human respiratory aerosol (Johnson et al. Citation2011; Pöhlker et al. Citation2021), the breathing mode dominates the number concentration, whereas the oral mode dominates the mass concentration. Although the intersection of the WSP-measured oral mode with the APS-measured breathing and vocalization modes is broadly self-consistent, there is a clear gap in data from ∼10–20 μm where neither method can satisfactorily quantify respiratory aerosol concentrations, in part due to low counting statistics (Gregson et al. Citation2022).
Figure 7. Comparison of trimodal (a) number and (b) mass size distributions generated from various respiratory exercises. Open symbols represent data measured in previous work using an Aerodynamic Particle Sizer (Gregson et al. Citation2021; Archer et al. Citation2022). Filled symbols represent data measured using the WSP-DDA method described here. Lines represent lognormal fits to the measured data. Lognormal fit parameters for distributions in are given in Table S2. The trimodal size distribution from Johnson et al. (Citation2011; speaking) is shown by the pink line.
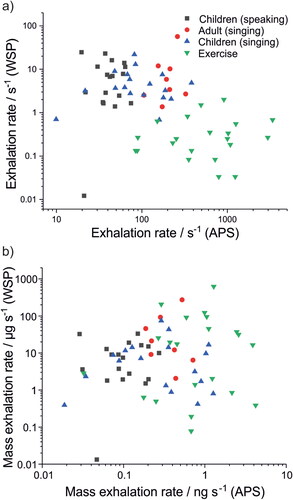
The same human cohort was used for all measurements in . Previous studies have demonstrated that a small fraction of people generate a disproportionate amount of respiratory aerosol, consistent with the lognormal nature of respiratory aerosol generation (Asadi et al. Citation2019; Chao et al. Citation2009; Johnson et al. Citation2011; Morawska et al. Citation2009; Pöhlker et al. Citation2021). plots the number emission rates for <10 μm aerosol generation against >20 μm droplet generation for all participants. No correlation is observed, indicating that those who generate the most <10 μm aerosol (sometimes referred to as super-emitters (Asadi et al. Citation2019)) are not the same as those who emit the most oral mode droplets. This conclusion is remarkable but not surprising given the different generation mechanisms for each mode of respiratory aerosol.
Figure 8. Comparison of aerosol (<10 µm diameter particles, measured by an Aerodynamic Particle Sizer in previous work (Archer et al. Citation2022; Gregson et al. Citation2021; Orton et al. Citation2022)) and droplets (>20 µm diameter, measured in this study using water-sensitive paper). (a) Number and (b) mass exhalation rates for adults singing, children speaking, children singing, and very vigorous exercise.
Conclusions
This study investigated the exhalation rates, concentrations, size distributions, and generation mechanisms for oral respiratory droplets (>20 μm diameter) in a cohort of 76 adults and children using a WSP-DDA method. The studied activities included breathing, very vigorous exercise, speaking, singing, shouting, and voiced lip trilling. Oral articulation drives droplet generation, with breathing and shouting “Hey” generating the least droplets and lip trills generating the most. Speaking and singing generated similar numbers of droplets, regardless of the cohort, with an exhalation rate of the order of 250 droplets min−1. The size distributions of droplets generated by speaking, singing, and lip trilling were similar, indicating a similar mechanism for droplet generation. The results are broadly consistent with previous studies of oral mode droplets, although this study detected particles down to smaller sizes than other recent studies relying primarily on droplet impaction onto a surface. We find no evidence for the presence of a second oral mode at smaller sizes.
Improved characterization of respiratory aerosol and droplet size distributions enables determination of a more precise relationship between generation mechanisms and droplet sizes and provides better context for the potential effectiveness of precautionary measures (e.g. face coverings). The observation that children and adults have similar large respiratory droplet exhalation rates is consistent with recent studies showing both groups exhibit similar aerosol (<10 μm diameter) exhalation rates (Pöhlker et al. Citation2021; Archer et al. Citation2022). Therefore, mitigation approaches appropriate for adults will likely be similarly effective for children, assuming these mitigations could be implemented similarly across both groups. The droplet emission rates measured here will allow more accurate inputs into models describing respiratory aerosol and droplet dispersion in the environment. Although the oral mode represents the smallest contributor to respiratory aerosol generation by number, it represents the largest by mass and therefore should not be neglected, especially as all particles <100 µm diameter (which constitute the majority of measured droplets) exhibit similar aerodynamic behavior (Prather et al. Citation2020). The risk associated with each mode of respiratory aerosol and droplets depends on whether a respiratory pathogen lies preferentially in one portion of the respiratory tract and, thus, in the size distribution. Accurate quantification of aerosol concentrations in the 10–70 μm size range is very challenging. Future efforts should focus on developing more robust approaches to quantify this size range.
Supplemental Material
Download PDF (317.5 KB)Acknowledgments
The authors acknowledge funding from the Engineering and Physical Sciences Research Council (EPSRC, EP/V050516/1). B.R.B. acknowledges the Natural Environment Research Council (NE/P018459/1). J.H. and L.P.M. acknowledge funding from the EPSRC Centre for Doctoral Training in Aerosol Science (EP/S023593/1). L.P.M. acknowledges funding from EPSRC IILF (EP/R513179/1). K.E.J.P. was supported by the Imperial College Clinician Investigator Scholarship. Fortius Surgical Centre, Marylebone, London, is acknowledged for the generous provision of space to conduct the measurements. Vyaire MedicalTM is acknowledged for the loan of CPET testing equipment. We acknowledge the participants for their contributions to this study.
Data availability
Data underlying the figures are publicly available in the BioStudies database (https://www.ebi.ac.uk/biostudies/) under accession ID S-BSST925.
Additional information
Funding
References
- Abkarian, M., S. Mendez, N. Xue, F. Yang, and H. A. Stone. 2020. Speech can produce jet-like transport relevant to asymptomatic spreading of virus. Proc. Natl. Acad. Sci. U S A. 117 (41):25237–45. doi:10.1073/pnas.2012156117.
- Abkarian, M., and H. A. Stone. 2020. Stretching and break-up of saliva filaments during speech: A route for pathogen aerosolization and its potential mitigation. Phys. Rev. Fluids 5 (10): 102301. doi:10.1103/PhysRevFluids.5.102301.
- Archer, J., L. P. McCarthy, H. E. Symons, N. A. Watson, C. M. Orton, W. J. Browne, J. Harrison, B. Moseley, K. E. J. Philip, J. D. Calder, et al. 2022. Comparing aerosol number and mass exhalation rates from children and adults during breathing, speaking and singing. Interface Focus. 12 (2):20210078. doi:10.1098/rsfs.2021.0078.
- Asadi, S., A. S. Wexler, C. D. Cappa, S. Barreda, N. M. Bouvier, and W. D. Ristenpart. 2019. Aerosol emission and superemission during human speech increase with voice loudness. Sci. Rep. 9 (1):2348. doi:10.1038/s41598-019-38808-z.
- Chao, C. Y. H., M. P. Wan, L. Morawska, G. R. Johnson, Z. D. Ristovski, M. Hargreaves, K. Mengersen, S. Corbett, Y. Li, X. Xie, et al. 2009. Characterization of expiration air jets and droplet size distributions immediately at the mouth opening. J. Aerosol Sci. 40 (2):122–33. doi:10.1016/j.jaerosci.2008.10.003.
- Ding, S., J. S. Lee, M. A. Mohamed, and B. F. Ng. 2022. Infection risk of SARS-CoV-2 in a dining setting: Deposited droplets and aerosols. Build. Environ. 213:108888. doi:10.1016/j.buildenv.2022.108888.
- Duguid, J. P. 1946. The size and the duration of air-carriage of respiratory droplets and droplet-nuclei. J. Hyg. (Lond.) 44 (6):471–9. doi:10.1017/s0022172400019288.
- Gregson, F. K. A., S. Sheikh, J. Archer, H. E. Symons, J. S. Walker, A. E. Haddrell, C. M. Orton, F. W. Hamilton, J. M. Brown, B. R. Bzdek, et al. 2022. Analytical challenges when sampling and characterising exhaled aerosol. Aerosol Sci. Technol. 56 (2):160–75. doi:10.1080/02786826.2021.1990207.
- Gregson, F. K. A., N. A. Watson, C. M. Orton, A. E. Haddrell, L. P. McCarthy, T. J. R. Finnie, N. Gent, G. C. Donaldson, P. L. Shah, J. D. Calder, et al. 2021. Comparing aerosol concentrations and particle size distributions generated by singing, speaking and breathing. Aerosol Sci. Technol. 55 (6):681–91. doi:10.1080/02786826.2021.1883544.
- Han, M., R. Ooka, H. Kikumoto, W. Oh, Y. Bu, and S. Hu. 2021. Measurements of exhaled airflow velocity through human coughs using particle image velocimetry. Build. Environ. 202:108020. doi:10.1016/j.buildenv.2021.108020.
- Han, Z. Y., W. G. Weng, and Q. Y. Huang. 2013. Characterizations of particle size distribution of the droplets exhaled by sneeze. J. R Soc. Interface 10 (88):20130560. doi:10.1098/rsif.2013.0560.
- Johnson, G. R., L. Morawska, Z. D. Ristovski, M. Hargreaves, K. Mengersen, C. Y. H. Chao, M. P. Wan, Y. Li, X. Xie, D. Katoshevski, et al. 2011. Modality of human expired aerosol size distributions. J. Aerosol Sci. 42 (12):839–51. doi:10.1016/j.jaerosci.2011.07.009.
- Loudon, R. G., and R. M. Roberts. 1967. Relation between the airborne diameters of respiratory droplets and the diameter of the stains left after recovery. Nature. 213 (5071):95–6. doi:10.1038/213095a0.
- McCarthy, L. P., C. M. Orton, N. A. Watson, F. K. A. Gregson, A. E. Haddrell, W. J. Browne, J. D. Calder, D. Costello, J. P. Reid, P. L. Shah, et al. 2021. Aerosol and droplet generation from performing with woodwind and brass instruments. Aerosol Sci. Technol. 55 (11):1277–87. doi:10.1080/02786826.2021.1947470.
- Miles, R. E. H., M. W. J. Glerum, H. C. Boyer, J. S. Walker, C. S. Dutcher, and B. R. Bzdek. 2019. Surface tensions of picoliter droplets with sub-millisecond surface age. J. Phys. Chem. A 123 (13):3021–9. doi:10.1021/acs.jpca.9b00903.
- Morawska, L., G. R. Johnson, Z. D. Ristovski, M. Hargreaves, K. Mengersen, S. Corbett, C. Y. H. Chao, Y. Li, and D. Katoshevski. 2009. Size distribution and sites of origin of droplets expelled from the human respiratory tract during expiratory activities. J. Aerosol Sci. 40 (3):256–69. doi:10.1016/j.jaerosci.2008.11.002.
- Morawska, L., and D. K. Milton. 2020. It is time to address airborne transmission of coronavirus disease 2019 (COVID-19). Clin. Infect. Dis. 71 (9):2311–3. doi:10.1093/cid/ciaa939.
- Newsom, R. B., A. Amara, A. Hicks, M. Quint, C. Pattison, B. R. Bzdek, J. Burridge, C. Krawczyk, J. Dinsmore, and J. Conway. 2021. Comparison of droplet spread in standard and laminar flow operating theatres: SPRAY study group. J. Hosp. Infect. 110:194–200. doi:10.1016/j.jhin.2021.01.026.
- Orton, C. M., H. E. Symons, B. Moseley, J. Archer, N. A. Watson, K. E. J. Philip, S. Sheikh, B. Saccente-Kennedy, D. Costello, W. J. Browne, et al. 2022. A comparison of respiratory particle emission rates at rest and while speaking or exercising. Commun. Med. 2 (1):44. doi:10.1038/s43856-022-00103-w.
- Pöhlker, M., O. Krüger, J.-D. Förster, W. Elbert, J. Fröhlich-Nowoisky, U. Pöschl, C. Pöhlker, et al. 2021. Respiratory aerosols and droplets in the transmission of infectious diseases. arXiv:2103.01188. doi:10.48550/arXiv.2103.01188.
- Prather, K. A., L. C. Marr, R. T. Schooley, M. A. McDiarmid, M. E. Wilson, and D. K. Milton. 2020. Airborne transmission of SARS-CoV-2. Science 370 (6514):303–4. doi:10.1126/science.abf0521.
- Saccente-Kennedy, B., J. Archer, H. E. Symons, N. A. Watson, C. M. Orton, W. J. Browne, J. Harrison, J. D. Calder, P. L. Shah, D. Costello, et al. 2022. Quantification of respirable aerosol particles from speech and language therapy exercises. J. Voice. doi:10.1016/j.jvoice.2022.07.006.
- Schindelin, J., I. Arganda-Carreras, E. Frise, V. Kaynig, M. Longair, T. Pietzsch, S. Preibisch, C. Rueden, S. Saalfeld, B. Schmid, et al. 2012. Fiji: An open-source platform for biological-image analysis. Nat. Methods. 9 (7):676–82. doi:10.1038/nmeth.2019.
- Sies, M. F., N. F. Madzlan, N. Asmuin, A. Sadikin, and H. Zakaria. 2017. Determine spray droplets on water sensitive paper ({WSP}) for low pressure deflector nozzle using. IOP Conf. Ser: Mater. Sci. Eng. 243:012047. doi:10.1088/1757-899X/243/1/012047.
- Stadnytskyi, V., C. E. Bax, A. Bax, and P. Anfinrud. 2020. The airborne lifetime of small speech droplets and their potential importance in SARS-CoV-2 transmission. Proc. Natl. Acad. Sci. USA. 117 (22):11875–7. doi:10.1073/pnas.2006874117.
- Tang, J. W., L. C. Marr, Y. Li, and S. J. Dancer. 2021. Covid-19 has redefined airborne transmission. BMJ 373:n913. doi:10.1136/bmj.n913.
- Walker, J. S., J. Archer, F. K. A. Gregson, S. E. S. Michel, B. R. Bzdek, and J. P. Reid. 2021. Accurate representations of the microphysical processes occurring during the transport of exhaled aerosols and droplets. ACS Cent. Sci. 7 (1):200–9. doi:10.1021/acscentsci.0c01522.
- Wang, C. C., K. A. Prather, J. Sznitman, L. Jimenez, J. S. Lakdawala, S. Z. Tufekci, and L. C. Marr. 2021. Airborne Transmission of respiratory viruses. Science 373 (6558): eabd9149. doi:10.1126/science.abd9149.
- Wang, C. T., S. C. Fu, and C. Y. H. Chao. 2021. Short-range bioaerosol deposition and recovery of viable viruses and bacteria on surfaces from a cough and implications for respiratory disease transmission. Aerosol Sci. Technol. 55 (2):215–30. doi:10.1080/02786826.2020.1837340.
- Wells, W. F., and M. W. Wells. 1936. Air-borne infection. JAMA. 107 (21):1698–703. doi:10.1001/jama.1936.02770470016004.
- Xie, X., Y. Li, H. Sun, and L. Liu. 2009. Exhaled droplets due to talking and coughing. J. R Soc. Interface 6 (Suppl_6):S703–S714. doi:10.1098/rsif.2009.0388.focus.