
 ?Mathematical formulae have been encoded as MathML and are displayed in this HTML version using MathJax in order to improve their display. Uncheck the box to turn MathJax off. This feature requires Javascript. Click on a formula to zoom.
Abstract
SARS-CoV-2 spreads by infectious aerosols and droplets from the respiratory tract. Masks and respirators can reduce the transmission of infectious respiratory diseases by collecting these aerosols at the source. The ability of source control devices to block aerosols can be tested by expelling an aerosol through a headform using constant airflows, which are simpler, or cyclic airflows, which are more realistic but require more complex methods. Experiments with respirators found that using cyclic vs. constant flows affected the amount of aerosol inhaled, but similar comparisons have not been made for source control devices with exhaled aerosols. We measured the collection efficiencies for exhaled aerosols for two cloth masks, two medical masks with and without an elastic mask brace, a neck gaiter, and an N95 filtering facepiece respirator using 15 L/min and 85 L/min constant and cyclic flows and a headform with pliable skin. The collection efficiencies for the 15 L/min cyclic flow, 15 L/min constant flow, and 85 L/min constant flow were not significantly different in most cases. The apparent collection efficiencies for the 85 L/min cyclic flow were artificially increased by rebreathing and refiltration of the aerosol from the collection chamber. The collection efficiencies correlated well with the fit factors (ρ > 0.95) but not the filtration efficiencies (ρ < 0.54). Our results suggest that the aerosol collection efficiency measurements of source control devices are comparable when testing the devices using either constant or cyclic airflows and that the potential for aerosol rebreathing must be considered when conducting experiments.
GRAPHICAL ABSTRACT
EDITOR:
Introduction
SARS-CoV-2, the virus that causes coronavirus disease 2019 (COVID-19), is spread primarily by aerosols and droplets of respiratory fluids that are expelled by infected people when they cough, breathe, talk, sing and sneeze (Adenaiye et al. Citation2022; CDC Citation2022; Klompas et al. Citation2021; Tellier Citation2022; Wang et al. Citation2021). To reduce the transmission of SARS-CoV-2, public health agencies have recommended a variety of non-pharmaceutical interventions, including increased ventilation and air filtration, physical distancing, limiting occupancy of indoor spaces, and the universal wearing of well-fitting face masks, respirators, or other types of face coverings (called universal masking) (CDC Citation2021b; WHO Citation2022). Masks and other face coverings reduce the spread of infectious respiratory diseases primarily by reducing the amount of aerosols and droplets that are expelled by the wearer into the environment (called source control) (CDC Citation2021a). Masks also provide some personal protection to the wearer, although respiratory protective devices such as N95 filtering facepiece respirators are far more effective (Lawrence et al. Citation2006; Oberg and Brosseau Citation2008; Pan et al. Citation2021).
Universal masking has been shown to help reduce the spread of COVID-19 (CDC Citation2021a; Chou, Dana, and Jungbauer Citation2022). A study in California found that consistent use of a cloth face mask reduced the likelihood of a positive SARS-CoV-2 test result by 56%, while a surgical mask lowered it by 66% and an N95 filtering facepiece respirator reduced the likelihood by 83% (Andrejko et al. Citation2022). An Arizona study found that schools without mask requirements were 3.5 times more likely to experience a COVID-19 outbreak than schools that had mask requirements (Jehn et al. Citation2021). In Kansas, counties with mask mandates had lower incidence rates of COVID-19 (Van Dyke et al. Citation2020), and a study of ten U.S. states found that state-wide mask mandates were associated with a lower growth rate in weekly COVID-19 associated hospitalizations compared with states without such mandates (Joo et al. Citation2021).
During the COVID-19 pandemic, hundreds of studies on different aspects of the source control and personal protective performance of masks and respirators have been published using a wide range of techniques and test conditions. These studies have shed light on many different facets of the use of masks as source control devices, but variations in the test methods and study quality make it difficult to compare the results of different studies (Brosseau et al. Citation2021; Stettler et al. Citation2022). One common group of experimental methods are those that test source control and personal protective devices on manikin headforms (Bergman et al. Citation2015; Smith et al. Citation2016). For respiratory protective devices, headforms are frequently used for research and to perform certification testing, and the equipment and test methods are widely available (ISO Citation2016). The personal protection offered by a respirator or other device is typically tested by generating an aerosol in the environment surrounding the headform and comparing the aerosol concentration in the environment to that at the mouth of the headform inside the respirator. The reduction in aerosol concentration in the inhaled air due to the respirator is used to calculate the fit factor (Janssen and McKay Citation2017; OSHA Citation2004). The purpose of this type of testing is to determine how well the device protects the wearer from environmental aerosols.
Source control device testing using headforms is different from respiratory protection testing. Source control devices like masks are typically tested by placing the device on a headform, coughing or exhaling a simulated respiratory aerosol out of the mouth of the headform, and measuring how much of the aerosol travels through or around the mask and enters the environment (Freeman et al. Citation2022; Lindsley et al. Citation2021a; Lindsley et al. Citation2021b; Pan et al. Citation2021; Zhang et al. Citation2022). For source control testing, the goal is to determine how well the mask suppresses the release of aerosols from the wearer into the environment rather than how well the mask protects the wearer. Source control simulation studies using headforms have the advantages of controllability and reproducibility compared with human studies, although they also have the disadvantage that human faces come in a much wider variety of shapes and sizes than do headforms. One study comparing fit test results for humans and headforms found that the variability seen in the human tests was higher than was seen with headforms (Krishnan et al. Citation1994). Using headforms also allows examination of the effects of mask and respirator fit and face seal leakage (Freeman et al. Citation2022; Lawrence et al. Citation2006; Lindsley et al. Citation2021b), which is not possible with studies that seal the mask material to a test fixture.
During normal tidal breathing, the airflow at the mouth is cyclic (inhalation followed by exhalation) and is typically modeled as sinusoidal. Some tests of source control devices like masks have used simulated cyclic breathing to reproduce the airflow that would be seen when a person was wearing the device (Lindsley et al. Citation2021a; Lindsley et al. Citation2021b; Patel et al. Citation2016; Zhang et al. Citation2022). Others have used a constant unidirectional airflow (Freeman et al. Citation2022; Pan et al. Citation2021; Rothamer et al. Citation2021; Ueki et al. Citation2020). ASTM International released Standard F3502-21, Standard Specification for Barrier Face Coverings (ASTM Citation2021), which specifies testing the filtration efficiency of mask materials using a constant flowrate of 85 liters/minute (this is the same flowrate as is used in the United States for certification of filtering facepiece respirators). Testing source control devices using a constant flowrate has several advantages. Using a constant airflow rate makes the test apparatus considerably simpler and less expensive. Constant airflows are easier to control and monitor during testing, and calibration is much simpler. Using a constant airflow and constant aerosol generation rate allows measurements to be made under steady-state conditions, which eliminates the need to characterize transient fluctuations in airflow and aerosol concentration. Performing measurements under steady-state conditions is preferred for certification testing because the measurements tend to be more reproducible and have less variability, which improves quality control. However, a constant airflow condition is not the same as the cyclic airflow that occurs when masks are worn by people. Aerosol behavior under a constant flowrate condition could be expected to be different than the behavior of aerosols during a cyclic flow since filtration efficiencies vary with flowrate and since the flow patterns could be quite different. Thus, the question of how source control performance measurements made using a constant airflow system compare with those found using a more physiological cyclic airflow needs to be examined.
Although comparisons of the performance of source control devices using cyclic and constant airflows have not been reported, such comparisons have been done for the filtration efficiencies of respiratory protective devices. Brosseau, Ellenbecker, and Evans (Citation1990) studied penetration of silica and asbestos through elastomeric half-mask respirators and found that filtration efficiencies were lower under cyclic flow than under steady flow. Eshbaugh et al. (Citation2009) tested N95 and P100 filter cartridge and filtering facepiece respirators and found that the filtration efficiency was lower for cyclic flows at a given minute ventilation rate compared with constant flows at that rate. Rengasamy et al. (Citation2009) studied the respiratory protection offered by five models of surgical masks and found that filtration efficiency measured under cyclic flow conditions had good correlations with measurements under constant flow, and that filtration efficiencies tended to be lower at higher flowrates. He et al. (Citation2014) found that, for an elastomeric half-mask respirator with P100 filter cartridges, the breathing flowrate was more important than the breathing frequency when measuring the total inward leakage (TIL). Bahloul et al. (Citation2014) studied the penetration of ultrafine aerosols through N95 filtering facepiece respirators and reported that filtration efficiencies measured using a constant flow were higher than those found using a cyclic flow with the equivalent minute ventilation rate but lower than those found using a cyclic flow with the equivalent peak ventilation rate. Together, these results show that differences exist between respiratory protection measurements made using constant and cyclic flow regimes, which suggests that such differences could occur with source control performance testing as well.
The purpose of this paper is to compare measurements of the source control performance of masks and N95 filtering facepiece respirators under cyclic and constant airflow conditions and at different airflow rates. These results will help in developing better test methods for research and certification testing and will assist in comparing test results obtained under different test conditions.
Materials and methods
Summary
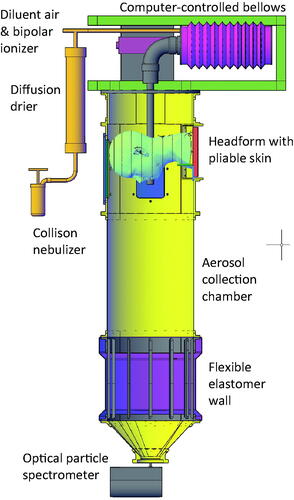
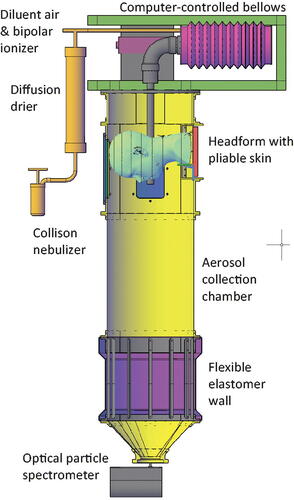
A source control measurement system was used to measure the efficacy of two cloth face masks, two medical masks with and without an elastic mask brace, a neck gaiter, and an N95 filtering facepiece respirator as source control devices for simulated respiratory aerosols (). With this system, the aerosol flows from the inside of the mask toward the outside; that is, the aerosol flows in the same direction as it would flow during an exhalation by a person wearing the source control device. Four samples of each source control device were tested under four consecutive airflow conditions: cyclic breathing at 15 liters/minute (L/min), cyclic breathing at 85 L/min, constant outward airflow at 15 L/min, and constant outward airflow at 85 L/min. Each experiment began by placing the source control device on the headform and performing a fit test. The measurement system collection chamber was then sealed, and the cyclic or constant airflow and the aerosol generation were initiated. The aerosol concentration in the collection chamber was measured using an optical particle spectrometer (OPS). The source control collection efficiency was determined by comparing the steady-state concentration of aerosol particles in the collection chamber when the source control device was worn with the concentration when no source control device was used.
Figure 1. Source control measurement system. The system consists of an aerosol generation system, a bellows and linear motor to produce the simulated breathing, a pliable skin headform on which the source control device (such as a face mask) is placed, a 136-liter collection chamber into which the aerosol is exhaled, and an optical particle spectrometer (OPS) to measure the number and size of the aerosol particles. The system is oriented vertically as shown to minimize the loss of aerosol particles due to settling before reaching the OPS.
Source control devices
In this study, “cloth mask” refers to a face mask constructed from woven or knitted textiles that is not a surgical mask or respirator. A “neck gaiter” is a knitted fabric tube that encircles the head and neck. “Medical mask” refers to a disposable mask made of non-woven polymer textiles that is held on the face with elastic ear loops; these are also commonly called “procedure masks” or “isolation masks.” Commercial manufacturers often refer to medical masks held on by ear loops as procedure or isolation masks and masks that tie behind the head as surgical masks, but the U.S. Food and Drug Administration uses the term “surgical mask” to describe all types of regulated masks that are used for performing medical procedures (FDA Citation2004). Cloth masks, neck gaiters, and medical masks typically fit loosely and may not protect the wearer from aerosol particles. A “respirator”, such as an N95 filtering facepiece respirator, is a personal protective device that is constructed of materials with a high filtration efficiency. A respirator is designed to fit tightly to the face and protect the wearer from airborne particulate matter. A filtering facepiece respirator, or FFR, is a disposable respirator where the body is composed of the filtration material (as seen in the online supplemental information [SI], Figure S1), as versus an elastomeric half or full facepiece respirator with filter cartridges. In the United States, respirators must be approved by the National Institute for Occupational Safety and Health (NIOSH) under 42 CFR Part 84 (NIOSH Citation1995).
For this study, two medical masks, two cloth masks, one neck gaiter and one N95 filtering facepiece respirator were selected to provide a range of source control collection efficiencies (). For the source control tests, each device was placed on the headform as it would normally be worn by a person. Photographs of the source control devices on the headform are shown in the online SI (Figure S1). The neck gaiter was folded over to provide two layers of fabric. The medical masks were tested both as normally worn and with an elastic mask brace (Fix the Mask, FTM Corporation) placed over the perimeter of the medical mask to reduce face seal leakage and improve the source control performance (Blachere et al. Citation2022).
Table 1. Source control devices used in the study. The two medical face masks were tested with and without an elastic mask brace. Photos of the devices on the headform are shown in Figure S1 in the online supplemental information. Construction information is from the manufacturers.
Fit factor and fit efficiency
Before the source control tests were performed, the manikin fit factor (Janssen and McKay Citation2017) was measured by performing a respirator fit test (Bergman et al. Citation2015) for each device using a respirator fit tester (PortaCount® Pro + Model 8038, TSI, Shoreview, MN, USA). The PortaCount was used in Class 100 mode (also called N99 mode), in which the tester measures the concentration of aerosol particles from 0.02 to 1.0 µm at the mouth of the headform (inside the source control device) and in the ambient air (outside the device) (TSI Citation2010). The aerosol was generated using a 1% potassium chloride (KCl) solution in a medical nebulizer (Hospitak Up-Mist, Unomedical) at 34 kPa (5 lbs/in2) air pressure. Aerosol samples at the mouth of the headform were collected through a sampling port in the headform; thus, it was not necessary to install a sample port in the source control device as is done when performing fit tests with people. Fit tests were performed with the system cyclically breathing at 36 L/min. The fit factor (FF) was calculated as (OSHA Citation2004; TSI Citation2015):
Where:
CB = particle concentration in an ambient aerosol sample collected before the mask sample was taken.
CA = particle concentration in an ambient aerosol sample collected after the mask sample was taken.
CR = particle concentration in the aerosol sample collected at the mouth inside the source control device.
To allow a direct comparison between the source control collection efficiency and the fit, the fit factor was transformed to the fit efficiency (FE) by the formula FE = 1 - 1/FF. The fit efficiency is the fraction of the ambient aerosol that is removed from the air during inhalation.
Measurement system for source control of respiratory aerosols
The effectiveness of source control devices at blocking aerosols produced during cyclic breathing and constant airflow exhalation were determined using a modified version of the custom-built respiratory aerosol source control measurement system described previously (Lindsley et al. Citation2021b; Lindsley et al. Citation2021c). The differences between the previous system and the current one are explained in detail in the online SI. The system includes a breathing aerosol simulator, a manikin headform, a 136 L aerosol collection chamber, and an optical particle spectrometer (OPS; Model 3330, TSI) to measure the aerosol concentration (). The manikin headform (Hanson Robotics, Plano, TX, USA) used in the study has pliable skin that mimics the elastic properties of human skin in order to create a realistic simulation of how each source control device would fit a human face (Bergman et al. Citation2014).
The test aerosol was produced using a solution of 1% KCl in a single-jet Collison nebulizer (BGI, Butler, NJ, USA) at 69 kPa (10 lbs./in2), which produced a flowrate of 1.5 L/min. The aerosol passed through a diffusion drier (Model 3062, TSI), mixed with dry filtered air (diluent air), and was neutralized using a bipolar ionizer (Model HPX-1, Electrostatics, Hatfield, PA, USA).
For the cyclic breathing tests, the 1.5 L/min of aerosol was mixed with 13.5 L/min of diluent air, and the 15 L/min diluted aerosol then flowed into the elastomeric bellows. The bellows was driven by a linear motor to produce the 15 or 85 L/min sinusoidal breathing pattern. The cyclic breathing flowrate was calibrated using an ultrasonic spirometer (Easy-on PC, ndd Medical Technologies) at the mouth of the simulator (Figure S2). A vacuum scavenger port near the mouth of the headform withdrew 15 L/min of air to balance the 15 L/min input so that the airflow in and out of the mouth was due only to the inhalation and exhalation produced by the bellows (that is, the system had a net airflow of zero from the mouth over a complete inhalation-exhalation cycle; Figure S3). A vacuum line with a filter removed 91 L/min of air at the base of the chamber and an additional 1 L/min was drawn by the optical particle spectrometer for a total of 92 L/min. Room air was passively drawn into the collection chamber through one-way air valves above the headform to balance the airflow. In addition, the lower section of the collection chamber had a neoprene rubber wall that was able to flex in and out when the exhalation airflow exceeded the rate of air removal so that air was not forced out of the chamber.
Figure 2. Aerosol particle mass size distribution for the four airflow conditions with no source control device. These control aerosol concentrations were compared with the concentrations found when a source control device was used to determine the source control efficiency of each device. The particle diameter refers to the optical diameter and is the arithmetic mean of the size bin. Each bar shows the mean of four experiments. The error bars show the standard deviation.
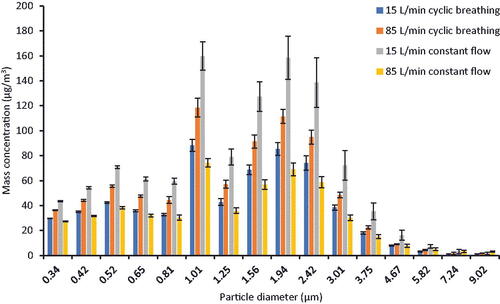
Figure 3. Collection efficiency for source control devices. The collection efficiency shown here is the overall collection efficiency based on the total aerosol mass. The collection efficiency for the 85 L/min cyclic breathing tests was higher than the collection efficiencies under the other airflow conditions, but this is most likely an artifact due to aerosol recirculation within the collection chamber as described in the Discussion section. Each bar shows the mean of four experiments. The error bars show the standard deviation.
For the 15 L/min constant airflow tests, 15 L/min of diluted aerosol flowed into the elastomeric bellows. However, the bellows was kept compressed and stationary during the experiments and the vacuum scavenger at the mouth was not used. Thus, there was a constant 15 L/min airflow out of the mouth of the headform during the test. Similarly, for the 85 L/min constant airflow tests, the 1.5 L/min of aerosol from the nebulizer was mixed with 41 L/min of diluent air, and the 42.5 L/min of diluted aerosol then flowed into the bellows. An additional 42.5 L/min of diluent air was introduced into the bellows through a separate port and mixed with the diluted aerosol to give a total of 85 L/min outward airflow from the mouth. As with the cyclic breathing experiments, the vacuum line with a filter removed 91 L/min of air and the OPS remove 1 L/min at the base of the chamber. The airflow was balanced by drawing in room air through one-way valves at the top of the chamber (Figure S4).
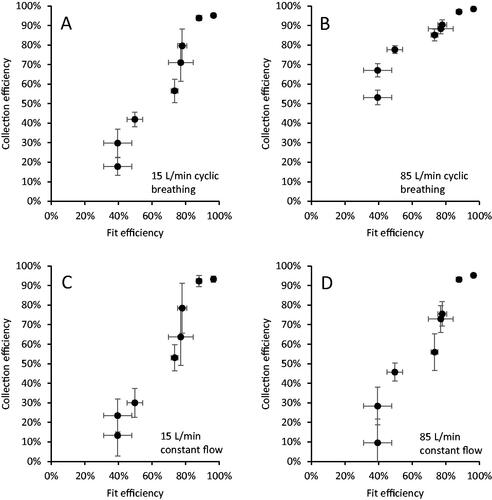
Figure 4. Source control collection efficiency vs. fit efficiency for (a) 15 L/min cyclic breathing; (b) 85 L/min cyclic breathing; (c) 15 L/min constant airflow; and (d) 85 L/min constant airflow. The fit factor is transformed to fit efficiency for the plot to allow a direct visual comparison of the parameters. Each dot is the mean of four experiments for one source control device. Error bars show the standard deviation.
During the experiments, the OPS reported the aerosol particle number concentration (# particles/cm3) at 1 Hz in 16 logarithmically spaced size bins from 0.3 to 10 µm. Since the OPS only measured a sample of the total aerosol in the chamber, a small fan was added to the chamber below the mouth of the headform to mix the aerosol coming from the headform with the air in the chamber.
Source control collection efficiency measurement
After the source control device was placed on the headform and the fit test was performed, each experiment began by measuring the background aerosol concentration inside the collection chamber for 15s. The cyclic breathing or constant airflow and the aerosol generation were then initiated and continued for 20 min. The control experiments with no source control device indicated that the aerosol concentration reached a steady-state in 8.2 min or less (data not shown), so the data from the first 10 min of operation was not used and the steady-state concentration was calculated based on the average concentration during the second 10 min of operation minus the background aerosol concentration. The particle concentration data was checked to verify that the chamber aerosol concentration did not exceed 3000 particles/cm3, which is the upper concentration limit for the OPS.
The mass or volume concentration of a respiratory aerosol provides a better description of the amount of virus contained in the aerosol than does the number concentration because, if the virus is evenly distributed in the respiratory tract fluids, then the amount of virus in the aerosol is proportional to the total volume of the aerosol particles, not the total number of particles. A detailed explanation of why mass or volume concentration is the appropriate metric for airborne respiratory pathogens rather than number concentration is given in the online SI for Lindsley et al. (Citation2019). For this reason, the source control collection efficiency was calculated based on the aerosol mass concentration, not the number concentration.
The mass of the aerosol in each size bin per cm3 of air (mass concentration) was calculated by multiplying the particle count by the volume of an individual particle based on the volume-weighted mean diameter of the size bin (assuming the particles were spherical) and by 1.984 g/cm3 (the density of KCl). Note that this conversion from particle counts to particle mass is commonly used but is an approximation. The total aerosol mass/cm3 (total aerosol mass concentration) was found by summing the aerosol mass concentrations for all the size bins.
The source control performance, or source control collection efficiency, of a source control device like a face mask is defined as the fraction of the mass of the respiratory aerosol that is blocked from entering the environment around the wearer. For example, if 80% of the mass of the exhaled aerosol is blocked by a face mask and 20% of the aerosol mass flows through or around the mask into the air around the wearer, then the mask is said to have a source control collection efficiency of 80%. The performance of each source control device was evaluated by calculating the collection efficiency as:
(3)
(3)
Where:
Mdevice = average total mass concentration when testing the source control device.
Mcontrol = average total mass concentration while not wearing a source control device.
Filtration efficiency and airflow resistance measurements
The filtration efficiency of the source control device is the fraction of the test aerosol that is collected as the aerosol passes through the device material. For example, if 70% of the test aerosol is collected by the device material and 30% of the aerosol passes through it, then the filtration efficiency is 70%. The source control device was sealed to a fixture during the filtration efficiency tests. Thus, the filtration efficiency is a property of the device material and does not include any effects of leaks between the edge of the device and the face of the wearer (face seal leakage).
The filtration efficiency and airflow resistance were measured with automated filter testers (Models 8130 and 8130 A, TSI) using a modified version of the NIOSH standard testing procedure (STP) (NIOSH Citation2019). Material samples were secured to a test plate using beeswax. Under the modified STP, samples were tested at ambient temperature and humidity but were not conditioned before testing, and sample testing was limited to 10 min. The device to be tested was oriented in the filter tester so that the air and aerosol flowed from the exterior of the device toward the interior (that is, as if the wearer were inhaling, which is the same direction as when testing a respirator as a personal protective device). The challenge aerosol was generated using a 2% sodium chloride (NaCl) solution in distilled water, conditioned to 25 °C and 30% relative humidity and neutralized to the Boltzmann equilibrium state. The challenge aerosol had a count median diameter of 75 nm ± 20 nm, a mass mean diameter of 260 nm and a geometric standard deviation (GSD) ≤ 1.86 (TSI 8130 A specifications). The automated filter tester compares particle mass concentration readings from upstream and downstream using light-scattering laser photometers to calculate the material filtration efficiency. An electronic pressure transducer measures the pressure difference across the material sample to indicate airflow resistance. Tests were performed with a constant airflow of 85 L/min.
Experimental design and data analysis
Four samples of each source control device were tested for their source control collection efficiency. Each device sample was used for four consecutive source control experiments under each of the four different flow conditions, for a total of 32 samples and 128 source control experiments. To randomize the testing, the order of the flow conditions was rotated among the four samples. The fit factor of each device sample was measured once before beginning the four source control tests for a total of 32 fit factor measurements. Because the filtration efficiency and airflow resistance tests used a different experimental apparatus and were destructive, those tests were performed on different samples from the source control and fit factor tests. The filtration efficiency and airflow resistance tests were performed on three samples each of the Nam Anh medical masks, Winner medical masks, Badger cloth masks, and Buff neck gaiters, and on ten Hanes cloth masks and twenty 3 M 9210 N95 respirators.
Statistical significance was assessed via a paired t-test with a Bonferroni correction for multiple comparisons. For this, normality of the data was tested using a Shapiro test on each mask type-flow condition combination, and all but the Nam medical mask with the elastic mask brace passed. The data for the Nam medical mask with the elastic mask brace was further assessed visually with a QQ-plot and deemed to be acceptable for normality. The Spearman correlation coefficient ρ was used due to the nonlinear relationship between Collection Efficiency and both the Filtration Efficiency and the Fit Factor. All analyses were performed in R (v 4.1.2) in Rstudio (R Core Team Citation2022).
Results
Aerosol size distributions
A graph of the mass-based aerosol particle concentrations vs. particle optical diameter for the four flow conditions with no source control device is shown in . The aerosol size distribution characteristics for each test aerosol are shown in . The total aerosol particle mass concentration ranged from an average of 519 µg/m3 for the 85 L/min constant flow condition to 1088 µg/m3 for the 15 L/min constant flow condition. The means, medians, and geometric standard deviations of the aerosol size distributions were similar for all four airflow conditions.
Table 2. Aerosol size distribution characteristics for the four airflow conditions. The aerosol optical size distributions were measured with no source control device on the headform using the OPS. Each parameter is the mean of four experiments.
Source control collection efficiencies under different airflow conditions
The collection efficiencies of the different source control devices are shown in and . The collection efficiencies for the 15 L/min cyclic breathing, 15 L/min constant airflow, and 85 L/min constant airflow were similar for each device, while the collection efficiency results for the 85 L/min cyclic breathing were consistently higher (this was likely an artifact due to recirculation of the test aerosol as explained in the Discussion section). The collection efficiencies for the 15 L/min cyclic breathing were not significantly different from the 15 L/min constant airflow for all devices except the N95 filtering facepiece respirator and the Winner Medical mask (). Similarly, the collection efficiencies for the 15 L/min constant airflow and the 85 L/min constant airflow were not significantly different except for the Winner Medical mask (). The collection efficiencies for the different airflow conditions were closer to each other for source control devices with higher collection efficiencies such as the N95 filtering facepiece respirator compared with devices with lower collection efficiencies such as the Hanes cloth mask.
Table 3. Experimental results. The Buff neck gaiter was worn doubled over to form two layers of fabric. The Winner and Nam Anh medical face masks were tested both as normally worn and with a Fix the Mask elastic mask brace over the mask to reduce the face seal leakage (see Figure S1 in the online supplemental information for photographs). Because the Fix the Mask fits around the perimeter of the mask, the filtration efficiency and airflow resistance for these masks are the same with and without the Fix the Mask, and thus separate filtration efficiency and airflow resistance tests were not performed. The source control collection efficiency and fit factor results are the mean and standard deviation of four experiments. The filtration efficiency and airflow resistance are the mean and standard deviation of three experiments, except for the Hanes mask (N = 10) and the 3 M N95 respirator (N = 20).
Table 4. Significance of differences between source control collection efficiencies for different airflow conditions. The table shows the adjusted p-values (adj p-value), central estimates (CE) and confidence intervals (CI). Each device was tested four times at each airflow condition.
Source control collection efficiency vs. fit and filtration efficiency
The fit factor of each source control device was measured before it was tested under the four airflow conditions (). shows the correlations between the source control efficiencies under different airflow conditions and the fit. For all airflow conditions, the collection efficiency and fit factor were well-correlated, with correlation coefficients of ρ > 0.95 ().
Table 5. Correlation coefficients for fit factor and filtration efficiency vs. collection efficiency.
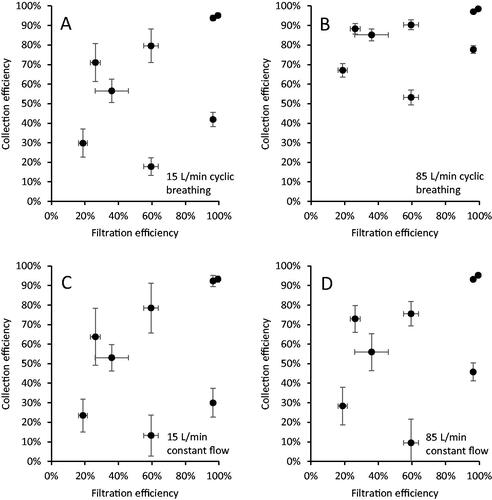
The filtration efficiencies of the source control device materials were also compared to the source control collection efficiencies (). The correlations between filtration efficiency and collection efficiency were much lower than those seen between the fit efficiency and collection efficiency, with correlation coefficients from 0.49 to 0.54 ().
Figure 5. Source control collection efficiency vs. filtration efficiency of the device material for (a) 15 L/min cyclic breathing; (b) 85 L/min cyclic breathing; (c) 15 L/min constant airflow; and (d) 85 L/min constant airflow. Each dot is the mean of four experiments for one source control device. Error bars show the standard deviation.
Source control collection efficiency vs. particle size
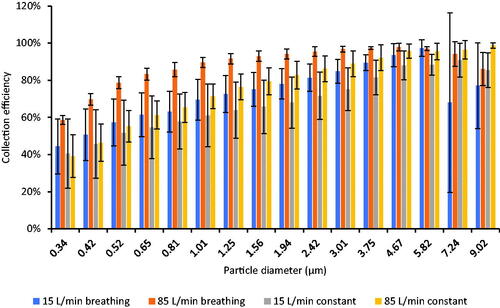
shows the relationship between the source control collection efficiency and the particle optical diameter for the neck gaiter. For all airflow conditions, the collection efficiency increased as the particle diameter increased. Similar results were seen for the other source control devices (Figure S6 in the online SI) except for the N95 filtering facepiece respirator, which had very high collection efficiencies for all particle sizes.
Figure 6. Collection efficiency vs. particle optical diameter for the Buff neck gaiter. Results for other source control devices are shown in Figure S6. Each bar shows the mean of four experiments. The error bars show the standard deviation.
Discussion
The urgent need for effective non-pharmaceutical interventions to reduce the spread of COVID-19 stimulated considerable interest in face masks and other types of source control devices for aerosols produced from the respiratory tract. The global adoption of mask wearing led to an explosion of new types of commercial and homemade masks using a wide variety of designs and materials. Scientific research into the many aspects of the design and performance of source control devices also rapidly expanded using a broad range of experimental techniques.
Manikin headforms and breathing simulators can be used to better understand the effects of different design parameters such as filtration efficiency, airflow resistance and face seal leakage on the performance of respiratory protective devices and source control devices. Headforms with breathing simulators have the advantage of providing controlled, reproducible experimental conditions that make it easier to isolate and understand the effects of specific characteristics. However, the use of simulation devices such as headforms and breathing simulators also has important limitations that are not always considered or even recognized. For example, when used with respiratory protective devices, headforms with rigid surfaces often have much greater face seal leakage than is seen with humans (Bergman et al. Citation2014). With rare exceptions, headforms also do not produce facial movements, which can affect the fit of a respiratory protective device (Bergman et al. Citation2014). For source control device testing, the test aerosols almost always have much narrower size ranges than the very broad size range of aerosols and droplets that can be produced by humans (Fennelly Citation2020; Gralton et al. Citation2011). With any simulation system, it is important to identify limitations such as these and carefully consider how those limitations may affect the relationship between the simulation results and the actual phenomena that are being studied (Stettler et al. Citation2022).
The purpose of this investigation was to examine one aspect of testing source control devices on headforms: the effects of using a constant airflow versus cyclic breathing. Constant airflows present several advantages in testing by simplifying the equipment and procedures and enhancing the controllability and reproducibility of the experiments. Constant airflows are used when certifying respiratory protective devices (Corbin et al. Citation2021; NIOSH Citation2019; Rengasamy et al. Citation2017), for medical mask testing (ASTM Citation2017; ASTM Citation2019; Corbin et al. Citation2021; Rengasamy et al. Citation2017), and for source control device testing (ASTM Citation2021). However, past studies of respiratory protective devices have seen differences in results when comparing constant flows and cyclic flows (Bahloul et al. Citation2014; Brosseau, Ellenbecker, and Evans Citation1990; Eshbaugh et al. Citation2009; He et al. Citation2014), which suggests that differences might be seen during source control device testing as well.
As can be seen in , the source control collection efficiencies measured when using three of the airflow regimes, 15 L/min cyclic breathing, 15 L/min constant flow, and 85 L/min constant flow, are reasonably similar. The collection efficiencies found during the 15 L/min cyclic breathing was consistently higher than those seen during the 15 L/min constant flow with the same device, but the differences were not large and were not statistically significant in most cases (). Likewise, the collection efficiencies for the 15 L/min constant flow and the 85 L/min constant flow also were not significantly different for all but one device. These results held over the entire range of source control devices, from those with low collection efficiencies to those with higher efficiencies. The results suggest that the use of constant airflows rather than cyclic airflows does not make a meaningful difference in the performance test results, and thus that experimental methods using constant airflows in small flow-through systems can be used to compare how well source control devices block respiratory aerosols at the source. It should be noted, however, that cyclic flows still may provide a better representation of the dispersion of aerosols in larger spaces such as rooms where the aerosol is not confined and the airflow patterns are important parameters.
and also show that the source control collection efficiency results for 85 L/min cyclic breathing were significantly higher than the results for the other airflow regimes, especially for source control devices with lower collection efficiencies. However, these results do not indicate that the source control devices perform much better at high cyclic breathing flows. Instead, the results illustrate an important limitation of systems using cyclic breathing inside a small chamber that confines the aerosol: the rebreathing and refiltration of the test aerosol through the source control device. With a constant airflow system, because of the unidirectional flow, the test aerosol exits the mouth of the headform and passes through the material of the source control device or through face seal leaks only once (Figure S4). With cyclic breathing, the test aerosol also passes out of the mouth and through or around the device during exhalation. However, if the aerosol is confined, it then can be inhaled and drawn back through the source control device and exhaled through the device again unless the airflow through the collection chamber is sufficient to sweep the aerosol away from the headform before it can be recirculated. This recirculation effect can subject the test aerosol to multiple filtration cycles, which leads to a greater collection of the test aerosol, which in turn appears in the results as an apparent higher collection efficiency. In our experiments, air is drawn through the aerosol collection chamber at a continuous rate of 92 L/min. During the 15 L/min cyclic breathing, the peak exhalation airflow was 47 L/min, which is less than half of the 92 L/min airflow past the headform. Thus, during the 15 L/min cyclic breathing, the aerosol that escapes past the source control device is likely to be swept away before it can be inhaled, and the recirculation effect is likely to be small. However, when the cyclic breathing rate was increased to 85 L/min, the peak inhalation airflow increased to 267 L/min, which is considerably larger than the 92 L/min constant airflow being pulled through the chamber (Figure S5). In addition, the tidal volume increased from 1.25 L to 4.25 L, and the breathing rate increased from 12 breaths/min to 20 breathes/min. Together, these increases made it much more likely that a substantial amount of the aerosol could be recirculated through the source control device. This effect was minimal for the source control devices with high collection efficiencies because almost all the aerosol was filtered out during the first pass through the source control device; since very little aerosol traversed the source control device, very little was available to be recirculated. This is why the source control collection efficiencies for the N95 filtering facepiece respirator and the Winner Medical mask with the Fix the Mask were similar for all flow regimes. On the other hand, the Nam Anh medical mask and the Defender cloth mask had much lower collection efficiencies, which meant that more aerosol traversed the mask and accumulated in the collection chamber, and then was inhaled back into the breathing simulator and filtered again during the next exhalation cycle. This explains why the difference in collection efficiencies is much higher for the source control devices with lower collection efficiencies, and why the effect diminishes as the collection efficiency improves. Together, these results emphasize that the possibility of aerosol recirculation needs to be considered when designing cyclic flow experiments with personal protective devices and source control devices, and when interpreting the experimental data. More generally, this shows that the results from any simulation study must be carefully examined to determine how well the data that is being collected represents the phenomena of interest and to what degree the data may be distorted by artificial factors.
The correlations between the fit factor, filtration efficiency, and collection efficiency also illustrate an important consideration when testing the performance of source control devices. First, consider what the fit factor actually measures. For people who need to wear respiratory protective devices, how well the device fits the face is critical in determining how much protection the device will provide. If there are gaps between the device and the face of the wearer (face seal leaks), then unfiltered contaminated air can bypass the device and be inhaled by the wearer. Consequently, when fitting workers with respirators, industrial hygienists will often determine the fit factor of the respirator by using a respirator fit tester. Fit testers measure the aerosol concentration inside the respirator and compares it to the aerosol concentration in the ambient air (outside the respirator). If the aerosol concentration inside the respirator is too high (that is, the fit factor is too low), then the respirator does not fit adequately and cannot be relied upon for protection.
It is important to note, however, that the fit factor method for calculating the fit of a respirator implicitly assumes that all the aerosol detected inside the respirator is entering through face seal leakage (Lindsley et al. Citation2021b; TSI Citation2017). In reality, the aerosol concentration inside the respirator is determined by two factors: how well the respirator filtration material is able to filter out aerosols passing through the material (the filtration efficiency of the material); and also how much of the airflow and aerosol are able to bypass the respirator through face seal leaks. These two factors combined are referred to as total inward leakage (TIL) (Duncan, Bodurtha, and Naqvi Citation2021; Rengasamy et al. Citation2018). For respirator fit testing, the assumption that all the aerosol inside the respirator enters through face seal leaks is reasonable, because respirator filters have very high filtration efficiencies (TSI Citation2017) and thus the total inward leakage is almost entirely due to face seal leakage. However, this assumption breaks down when fit testing cloth masks, neck gaiters, and similar devices that have lower filtration efficiencies than do respirators (Duncan, Bodurtha, and Naqvi Citation2021; Lindsley et al. Citation2021b). For this reason, the fit factor of a source control device may include a substantial component that is due to aerosol passing through the device material rather than through face seal leaks.
This total inward leakage effect can be seen in and . As can be seen in , the collection efficiency and the fit efficiency (the fit factor transformed into a percentage) were well correlated in our study. This is because both the source control efficiency for exhaled aerosols and the fit efficiency for inhaled aerosols are determined by the combination of the amount of aerosol that can pass through the device material and the amount that passes through face seal leaks. On the other hand, as shown in , the source control collection efficiency for exhaled aerosols and the filtration efficiency for inhaled aerosols are not well correlated. This is because the filtration efficiency only measures the ability of the device material to filter out aerosols passing through it; it does not include face seal leakage. Thus, the fit factor of a source control device provides a more direct indication of the expected source control performance than does the filtration efficiency. However, the fit factor must be understood to represent not just the face seal leakage, but the total inward leakage of the device, which includes aerosols that are carried through the device material rather than through face seal leaks.
shows that, for the neck gaiter, the source control collection efficiency was higher for larger aerosol particles compared with smaller particles. Similar results were seen for the other source control devices (Figure S6) and were also seen in our previous studies (Lindsley et al. Citation2021b; Lindsley et al. Citation2021c). This result is expected, since for aerosol filters, the filtration efficiency for aerosol particles above the most penetrating particle size increases with increasing particle size (Duncan, Bodurtha, and Naqvi Citation2021; Hinds Citation1999; Lindsley Citation2016). A related effect can be seen when the Winner and Nam Anh medical masks were tested with an elastic mask brace over the masks, which largely eliminated the face seal leaks. When using the mask brace and 85 L/min constant flow, the source control collection efficiency was 93% for the Winner mask and 76% for the Nam Anh mask. In contrast, the filtration efficiency found using the modified NIOSH procedure, which is also performed with 85 liters/min constant flow, was 59% for the Winner mask and 19% for the Nam Anh. The filtration efficiencies were substantially lower than the collection efficiencies primarily because the modified NIOSH procedure uses a smaller test aerosol (260 nm mass median diameter) compared with the source control test (1300 nm mass median diameter). These results illustrate that experimentally measured collection and filtration efficiencies depend in part on the size distribution of the test aerosol, which explains why investigators using smaller test aerosols tend to see lower collection and filtration efficiencies than do investigators using larger test aerosols (Corbin et al. Citation2021; Ogbuoji, Zaky, and Escobar Citation2021). This is a point that is often overlooked when interpreting and comparing experimental results and demonstrates why standardized test methods are needed.
Finally, it is important to acknowledge the limitations of our study. For the test aerosol used in the source control measurement system, 95% of the particles by mass were between 0.3 and 3 µm in diameter. This is the size range of aerosol particles most likely to remain airborne and most difficult to block with source control devices. However, humans expel aerosol particles in a much broader range of sizes, particularly when coughing. We used only two breathing ventilation rates and two constant airflow rates for our studies; these parameters can vary greatly from person to person under different physiological conditions. We used only one headform in our studies; different facial dimensions and proportions would be expected to lead to different experimental results. Some internal losses of the test aerosol particles likely occurred within the collection chamber, which would affect the estimates of the collection efficiencies. We used representative examples of different types of source control devices, but many such devices are available with a wide range of shapes and compositions, which would be expected to affect their individual performance.
Conclusions
Well-designed high performance source control devices such as masks and respirators are needed to reduce the expulsion of infectious respiratory aerosol particles carrying SARS-CoV-2 and may be needed in the future for other respiratory pathogens such as new strains of influenza. Most standardized test methods for respiratory protective devices, medical masks, and source control devices use constant airflows (Corbin et al. Citation2021; Duncan, Bodurtha, and Naqvi Citation2021; Rengasamy et al. Citation2017), which have many practical advantages. However, physiological airflows are cyclic, not constant, which raises the question as to how the type of flow regime may affect performance measurements for these devices. Our results suggest that the collection efficiency measurements of source control devices for simulated exhaled respiratory aerosols are comparable when testing the devices using manikin headforms with either constant or cyclic airflows. Our results also show that, for test methods using cyclic breathing with high flow rates, recirculation of the aerosol through the source control device can artificially increase the collection efficiency measurement, and this factor must be considered when designing test methods using cyclic flows in confined spaces. Finally, our results illustrate that fit factor measurements for inhaled aerosols correlate well with source control collection efficiencies for exhaled aerosols, but that filtration efficiency results do not correlate well because they do not include the effects of face seal leakage. Thus, evaluations of source control devices need to include the effect of device fit as well as the filtration efficiency of the device.
Disclaimer
The findings and conclusions in this report are those of the authors and do not necessarily represent the official position of the National Institute for Occupational Safety and Health (NIOSH), US Centers for Disease Control and Prevention (CDC). Mention of any company or product does not constitute endorsement by NIOSH or CDC.
Supplemental Material
Download Zip (1.1 MB)Acknowledgments
We would like to thank the NIOSH Morgantown maintenance, security, warehouse and housekeeping departments for their assistance and dedication during the ongoing pandemic.
Disclosure statement
No potential conflict of interest was reported by the authors.
Additional information
Funding
References
- Adenaiye, O. O., J. Lai, P. J. Bueno de Mesquita, F. Hong, S. Youssefi, J. German, S. H. S. Tai, B. Albert, M. Schanz, S. Weston, et al. 2022. Infectious severe acute respiratory syndrome coronavirus 2 (SARS-CoV-2) in exhaled aerosols and efficacy of masks during early mild infection. Clin. Infect. Dis. 75 (1):e241–e248. doi: 10.1093/cid/ciab797.
- Andrejko, K. L., J. M. Pry, J. F. Myers, N. Fukui, J. L. DeGuzman, J. Openshaw, J. P. Watt, J. A. Lewnard, S. Jain, Y. Abdulrahim, et al. 2022. Effectiveness of face mask or respirator use in indoor public settings for prevention of SARS-CoV-2 infection - California, February-December 2021. MMWR. Morb. Mortal. Wkly. Rep. 71 (6):212–6. doi: 10.15585/mmwr.mm7106e1.
- ASTM. 2017. Standard test method for determining the initial efficiency of materials used in medical face masks to penetration by particulates using latex spheres. F2299-03 (2017). West Conshohocken, PA: ASTM International.
- ASTM. 2019. Standard test method of evaluating the bacterial filtration efficiency (BFE) of medical face mask materials, using a biological aerosol of Staphylococcus aureus. F2101-19. West Conshohocken, PA: ASTM International.
- ASTM. 2021. Standard specification for barrier face coverings. F3502-21. West Conshohocken, PA: ASTM International.
- Bahloul, A., A. Mahdavi, F. Haghighat, and C. Ostiguy. 2014. Evaluation of N95 filtering facepiece respirator efficiency with cyclic and constant flows. J. Occup. Environ. Hyg. 11 (8):499–508. doi: 10.1080/15459624.2013.877590.
- Bergman, M. S., X. He, M. E. Joseph, Z. Zhuang, B. K. Heimbuch, R. E. Shaffer, M. Choe, and J. D. Wander. 2015. Correlation of respirator fit measured on human subjects and a static advanced headform. J. Occup. Environ. Hyg. 12 (3):163–71. doi: 10.1080/15459624.2014.957832.
- Bergman, M. S., Z. Zhuang, D. Hanson, B. K. Heimbuch, M. J. McDonald, A. J. Palmiero, R. E. Shaffer, D. Harnish, M. Husband, and J. D. Wander. 2014. Development of an advanced respirator fit-test headform. J. Occup. Environ. Hyg. 11 (2):117–25. doi: 10.1080/15459624.2013.816434.
- Blachere, F. M., A. R. Lemons, J. P. Coyle, R. C. Derk, W. G. Lindsley, D. H. Beezhold, K. Woodfork, M. G. Duling, B. Boutin, T. Boots, et al. 2022. Face mask fit modifications that improve source control performance. Am. J. Infect. Control. 50 (2):133–40. doi: 10.1016/j.ajic.2021.10.041.
- Brosseau, L. M., A. Ulrich, K. Escandón, C. Anderson, and M. T. Osterholm. 2021. What can masks do? Part 2: What makes for a good mask study — and why most fail. Accessed July 14, 2022. https://www.cidrap.umn.edu/news-perspective/2021/10/commentary-what-can-masks-do-part-2-what-makes-good-mask-study-and-why-most.
- Brosseau, L. M., M. J. Ellenbecker, and J. S. Evans. 1990. Collection of silica and asbestos aerosols by respirators at steady and cyclic flow. Am. Ind. Hyg. Assoc. J. 51 (8):420–6. doi: 10.1080/15298669091369880.
- CDC. 2021a. Scientific brief: Community use of masks to control the spread of SARS-CoV-2. Accessed September 28, 2022. https://www.cdc.gov/coronavirus/2019-ncov/more/masking-science-sars-cov2.html.
- CDC. 2021b. Scientific brief: SARS-CoV-2 transmission. Accessed September 28, 2022. https://www.cdc.gov/coronavirus/2019-ncov/science/science-briefs/sars-cov-2-transmission.html.
- CDC. 2022. How COVID-19 spreads. Accessed September 28, 2022. https://www.cdc.gov/coronavirus/2019-ncov/prevent-getting-sick/how-covid-spreads.html.
- Chou, R., T. Dana, and R. Jungbauer. 2022. Update Alert 7: Masks for prevention of respiratory virus infections, including SARS-CoV-2, in health care and community settings. Ann. Intern. Med. 175 (5):W58–W59. doi: 10.7326/L21-0783.
- Corbin, J. C., G. J. Smallwood, I. D. Leroux, J. Norooz Oliaee, F. Liu, T. A. Sipkens, R. G. Green, N. F. Murnaghan, T. Koukoulas, and P. Lobo. 2021. Systematic experimental comparison of particle filtration efficiency test methods for commercial respirators and face masks. Sci. Rep. 11 (1):21979. doi: 10.1038/s41598-021-01265-8.
- Duncan, S., P. Bodurtha, and S. Naqvi. 2021. The protective performance of reusable cloth face masks, disposable procedure masks, KN95 masks and N95 respirators: Filtration and total inward leakage. PLoS One. 16 (10):e0258191. doi: 10.1371/journal.pone.0258191.
- Eshbaugh, J. P., P. D. Gardner, A. W. Richardson, and K. C. Hofacre. 2009. N95 and p100 respirator filter efficiency under high constant and cyclic flow. J. Occup. Environ. Hyg. 6 (1):52–61. doi: 10.1080/15459620802558196.
- FDA. 2004. Surgical masks - Premarket notification [510(k)] submissions. Guidance for industry and FDA staff. FDA-2003-D-0305. Washington, DC: US Food and Drug Administration. https://www.fda.gov/regulatory-information/search-fda-guidance-documents/surgical-masks-premarket-notification-510k-submissions.
- Fennelly, K. P. 2020. Particle sizes of infectious aerosols: implications for infection control. Lancet. Respir. Med. 8 (9):914–24. doi: 10.1016/S2213-2600(20)30323-4.
- Freeman, C., R. Burch, L. Strawderman, C. Black, D. Saucier, J. Rickert, J. Wilson, H. Seitz, and J. Stull. 2022. Do they really work? Quantifying fabric mask effectiveness to improve public health messaging. IJERPH. 19 (11):6372. doi: 10.3390/ijerph19116372.
- Gralton, J., E. Tovey, M. L. McLaws, and W. D. Rawlinson. 2011. The role of particle size in aerosolised pathogen transmission: a review. J. Infect. 62 (1):1–13. doi: 10.1016/j.jinf.2010.11.010.
- He, X., S. A. Grinshpun, T. Reponen, R. McKay, M. S. Bergman, and Z. Zhuang. 2014. Effects of breathing frequency and flow rate on the total inward leakage of an elastomeric half-mask donned on an advanced manikin headform. Ann. Occup. Hyg. 58 (2):182–94. doi: 10.1093/annhyg/met053.
- Hinds, W. C. 1999. Aerosol technology. Properties, behavior, and measurement of airborne particles. New York: John Wiley & Sons.
- ISO. 2016. Respiratory protective devices — Methods of test and test equipment — Part 5: Breathing machine, metabolic simulator, RPD headforms and torso, tools and verification tools. ISO 16900-5:2016(E). Geneva, Switzerland: International Organization for Standardization.
- Janssen, L., and R. McKay. 2017. Respirator performance terminology. J. Occup. Environ. Hyg. 14 (12):D181–D183. doi: 10.1080/15459624.2017.1359018.
- Jehn, M., J. M. McCullough, A. P. Dale, M. Gue, B. Eller, T. Cullen, and S. E. Scott. 2021. Association between K-12 school mask policies and school-associated COVID-19 outbreaks - Maricopa and Pima Counties, Arizona, July-August 2021. MMWR. Morb. Mortal. Wkly. Rep. 70 (39):1372–3. doi: 10.15585/mmwr.mm7039e1.
- Joo, H., G. F. Miller, G. Sunshine, M. Gakh, J. Pike, F. P. Havers, L. Kim, R. Weber, S. Dugmeoglu, C. Watson, et al. 2021. Decline in COVID-19 hospitalization growth rates associated with statewide mask mandates - 10 States, March-October 2020. MMWR. Morb. Mortal. Wkly. Rep. 70 (6):212–6. doi: 10.15585/mmwr.mm7006e2.
- Klompas, M., D. K. Milton, C. Rhee, M. A. Baker, and S. Leekha. 2021. Current insights into respiratory virus transmission and potential implications for infection control programs: A narrative review. Ann. Intern. Med. 174 (12):1710–8. doi: 10.7326/M21-2780.
- Krishnan, U., K. Willeke, A. Juozaitis, T. Myojo, G. Talaska, and R. Shukla. 1994. Variation in quantitative respirator fit factors due to fluctuations in leak size during fit testing. Am. Ind. Hyg. Assoc. J. 55 (4):309–14. doi: 10.1080/15428119491018943.
- Lawrence, R. B., M. G. Duling, C. A. Calvert, and C. C. Coffey. 2006. Comparison of performance of three different types of respiratory protection devices. J. Occup. Environ. Hyg. 3 (9):465–74. doi: 10.1080/15459620600829211.
- Lindsley, W. G. 2016. Filter pore size and aerosol sample collection. In NIOSH manual of analytical methods, ed. K. Ashley and P. F. O'Connor, FP1–14. Cincinnati, OH: National Institute for Occupational Safety and Health. http://www.cdc.gov/niosh/docs/2014-151/pdfs/chapters/chapter-fp.pdf.
- Lindsley, W. G., D. H. Beezhold, J. Coyle, R. C. Derk, F. M. Blachere, T. Boots, J. S. Reynolds, W. G. McKinney, E. Sinsel, and J. D. Noti. 2021a. Efficacy of universal masking for source control and personal protection from simulated cough and exhaled aerosols in a room. J. Occup. Environ. Hyg. 18 (8):409–22. doi: 10.1080/15459624.2021.1939879.
- Lindsley, W. G., F. M. Blachere, B. F. Law, D. H. Beezhold, and J. D. Noti. 2021c. Efficacy of face masks, neck gaiters and face shields for reducing the expulsion of simulated cough-generated aerosols. Aerosol Sci. Technol. 55 (4):449–57. doi: 10.1080/02786826.2020.1862409.
- Lindsley, W. G., F. M. Blachere, D. H. Beezhold, B. F. Law, R. C. Derk, J. M. Hettick, K. Woodfork, W. T. Goldsmith, J. R. Harris, M. G. Duling, et al. 2021b. A comparison of performance metrics for cloth masks as source control devices for simulated cough and exhalation aerosols. Aerosol Sci. Technol. 55 (10):1125–42. doi: 10.1080/02786826.2021.1933377.
- Lindsley, W. G., F. M. Blachere, T. L. McClelland, D. T. Neu, A. Mnatsakanova, S. B. Martin, Jr., K. R. Mead, and J. D. Noti. 2019. Efficacy of an ambulance ventilation system in reducing EMS worker exposure to airborne particles from a patient cough aerosol simulator. J. Occup. Environ. Hyg. 16 (12):804–16. doi: 10.1080/15459624.2019.1674858.
- NIOSH. 1995. Approval of respiratory protective devices. Washington, DC: National Institute for Occupational Safety and Health. 42 CFR Part 84: 505–69.
- NIOSH. 2019. Determination of particulate filter efficiency level for N95 series filters against solid particulates for non-powered, air-purifying respirators. TEB-APR-STP-0059. Pittsburgh, PA: National Institute for Occupational Safety and Health. https://www.cdc.gov/niosh/npptl/stps/pdfs/TEB-APR-STP-0059-508.pdf.
- Oberg, T., and L. M. Brosseau. 2008. Surgical mask filter and fit performance. Am. J. Infect. Control. 36 (4):276–82. doi: 10.1016/j.ajic.2007.07.008.
- Ogbuoji, E. A., A. M. Zaky, and I. C. Escobar. 2021. Advanced research and development of face masks and respirators pre and post the coronavirus disease 2019 (COVID-19) pandemic: A critical review. Polymers (Basel) 13 (12):1998. doi: 10.3390/polym13121998.
- OSHA. 2004. Appendix A to 29 CFR 1910.134 - Fit testing procedures (mandatory). Washington, DC: Occupational Safety and Health Administration. 29 CFR 1910.134.
- Pan, J., C. Harb, W. Leng, and L. C. Marr. 2021. Inward and outward effectiveness of cloth masks, a surgical mask, and a face shield. Aerosol Sci. Technol. 55 (6):718–33. doi: 10.1080/02786826.2021.1890687.
- Patel, R. B., S. D. Skaria, M. M. Mansour, and G. C. Smaldone. 2016. Respiratory source control using a surgical mask: An in vitro study. J. Occup. Environ. Hyg. 13 (7):569–76. doi: 10.1080/15459624.2015.1043050.
- R Core Team. 2022. R: A language and environment for statistical computing. Accessed July 19, 2022. https://www.R-project.org/.
- Rengasamy, S., A. Miller, B. C. Eimer, and R. E. Shaffer. 2009. Filtration performance of FDA-cleared surgical masks. J. Int. Soc. Respir. Prot. 26(3):54–70.
- Rengasamy, S., R. Shaffer, B. Williams, and S. Smit. 2017. A comparison of facemask and respirator filtration test methods. J. Occup. Environ. Hyg. 14 (2):92–103. doi: 10.1080/15459624.2016.1225157.
- Rengasamy, S., Z. Zhuang, G. Niezgoda, G. Walbert, R. Lawrence, B. Boutin, J. Hudnall, W. P. Monaghan, M. Bergman, C. Miller, et al. 2018. A comparison of total inward leakage measured using sodium chloride (NaCl) and corn oil aerosol methods for air-purifying respirators. J. Occup. Environ. Hyg. 15 (8):616–27. doi: 10.1080/15459624.2018.1479064.
- Rothamer, D. A., S. Sanders, D. Reindl, and T. H. Bertram. 2021. Strategies to minimize SARS-CoV-2 transmission in classroom settings: combined impacts of ventilation and mask effective filtration efficiency. Sci. Technol. Built Environ. 27 (9):1181–203. doi: 10.1080/23744731.2021.1944665.
- Smith, J. D., C. C. MacDougall, J. Johnstone, R. A. Copes, B. Schwartz, and G. E. Garber. 2016. Effectiveness of N95 respirators versus surgical masks in protecting health care workers from acute respiratory infection: a systematic review and meta-analysis. CMAJ 188 (8):567–74. doi: 10.1503/cmaj.150835.
- Stettler, M. E. J., R. T. Nishida, P. M. de Oliveira, L. C. C. Mesquita, T. J. Johnson, E. R. Galea, A. Grandison, J. Ewer, D. Carruthers, D. Sykes, et al. 2022. Source terms for benchmarking models of SARS-CoV-2 transmission via aerosols and droplets. R Soc. Open Sci. 9 (5):212022. doi: 10.1098/rsos.212022.
- Tellier, R. 2022. COVID-19: the case for aerosol transmission. Interface Focus. 12 (2):20210072. doi: 10.1098/rsfs.2021.0072.
- TSI. 2010. N-95 companion model 8095 theory of operation. Application Note ITI-053, Rev. B. Shoreview, MN: TSI.
- TSI. 2015. PortaCount Pro 8030 and PortaCount Pro+ 8038 respirator fit testers operation and service manual. P/N 6001868, Revision P. Shoreview, MN: TSI. https://www.tsi.com/getmedia/76df3dbb-6d8d-4d78-aa24-5aff19e889e9/8030_8038_PortaCountPro_Manual_6001868?ext=.pdf.
- TSI. 2017. Quantitative respirator fit testing. Fit testing series 95 respirators with and without N95-companion™ technology. Application note RFT-024. Shoreview, MN: TSI.
- Ueki, H., Y. Furusawa, K. Iwatsuki-Horimoto, M. Imai, H. Kabata, H. Nishimura, and Y. Kawaoka. 2020. Effectiveness of face masks in preventing airborne transmission of SARS-CoV-2. mSphere 5 (5):e00637. doi: 10.1128/mSphere.00637-20.
- Van Dyke, M. E., T. M. Rogers, E. Pevzner, C. L. Satterwhite, H. B. Shah, W. J. Beckman, F. Ahmed, D. C. Hunt, and J. Rule. 2020. Trends in county-level COVID-19 incidence in counties with and without a mask mandate - Kansas, June 1-August 23, 2020. MMWR. Morb. Mortal. Wkly. Rep. 69 (47):1777–81. doi: 10.15585/mmwr.mm6947e2.
- Wang, C. C., K. A. Prather, J. Sznitman, J. L. Jimenez, S. S. Lakdawala, Z. Tufekci, and L. C. Marr. 2021. Airborne transmission of respiratory viruses. Science 373 (6558):eabd9149. doi: 10.1126/science.abd9149.
- WHO. 2022. Transmission package: protect yourself and others from COVID-19. Accessed June 24, 2022. https://www.who.int/teams/risk-communication/covid-19-transmission-package.
- Zhang, C., P. V. Nielsen, L. Liu, E. T. Sigmer, S. G. Mikkelsen, and R. L. Jensen. 2022. The source control effect of personal protection equipment and physical barrier on short-range airborne transmission. Build. Environ. 211:108751. doi: 10.1016/j.buildenv.2022.108751.