
 ?Mathematical formulae have been encoded as MathML and are displayed in this HTML version using MathJax in order to improve their display. Uncheck the box to turn MathJax off. This feature requires Javascript. Click on a formula to zoom.
Abstract
Crystalline quartz is an important element of many materials and one of the major compounds of mineral dust. Thus, knowledge of its optical properties is essential for many applications, in particular for remote sensing techniques. However, despite the fact that crystalline quartz has been an object of study for many years using various experimental approaches, its optical properties and in particular its complex refractive indices (CRI) remain uncertain. The focus of this investigation is the determination of a new set of CRI of crystalline quartz particles retrieved from a methodology which has already demonstrated its efficiency on pure amorphous materials and volcanic ashes. The experimental set-up allows recording simultaneously size distribution (from 15 nm to 20 µm) of airborne particles and extinction spectra over a wide continuous spectral range from thermal infrared (650 cm−1) to UV (40,000 cm−1) with high spectral resolution (up to 0.5 cm−1). By associating these measurements and a numerical procedure coupling scattering theories, the single subtractive Kramers-Kronig relation, and an optimal estimation method in an iterative process, we precisely determine the real and imaginary parts of the CRI of crystalline SiO2 with mean values of the uncertainties of 2.5% and 1.7%, respectively. Moreover, the use of these CRIs allows to simulate an extinction spectrum of another quartz sample very well, which shows their suitability as well as the good reproducibility of the whole process.
EDITOR:
1. Introduction
Silicon dioxide (SiO2) exists in different forms: crystalline, amorphous and glassy. Due to its optical and physico-chemical characteristics, it is an important component in many technical and scientific applications (thermal, electronic or optical). It is naturally present in many different astrophysical environments (Petrov, Zhuzhulina, and Savushkin Citation2021 and references therein), and it is one of the main oxides in the Earth’s crust (Heaney, Prewitt, and Gibbs Citation1994). It is therefore not surprising that silicon dioxide is one of the major components of atmospheric mineral dust emitted during desert storms and volcanic eruptions. Given the large quantities annually injected into the atmosphere, mineral dust aerosols play an important role in the radiative budget equilibrium (Granados-Muñoz et al. Citation2019; Saidou Chaibou, Ma, and Sha Citation2020) and atmospheric chemistry (Usher, Michel, and Grassian Citation2003). Accurate modeling of the effect of mineral dust aerosol on the different atmospheric processes requires information about its chemical/mineralogical composition, concentration, size distribution (SD), or height and thickness of the aerosol plume. These information can be obtained using different active (Sugimoto and Huang Citation2014; Winker et al. Citation2013) or passive (Alalam et al. Citation2022; Clarisse et al. Citation2010; DeSouza-Machado et al. Citation2006; Ginoux et al. Citation2007; Wang et al. Citation2019) remote sensing techniques. In particular, due to very strong resonance absorption peaks, mainly from the Si-O vibrations which leads to a typical spectral signature between 8 and 12 µm, mineral dusts (e.g., Ackerman Citation1997; DeSouza-Machado et al. 2010; Pierangelo et al. Citation2004; Klüser et al. Citation2012) as well as volcanic ash (Prata Citation1989; Grainger et al. Citation2013) can be detected in the thermal infrared (TIR) region.
However, regardless of the measurement method or spectral range used, it is essential to have a thorough knowledge of their optical properties. Indeed, the extinction of radiation produced by aerosol particles depends mainly on the particles size distribution, and complex refractive indices m( = n(
+ i
where
denotes spectral wavenumber. The predominant part of the uncertainty in modeling the effect of aerosols on atmospheric radiative transfer arises from the lack of knowledge of these parameters, which requires assumptions to be made about them leading to uncertainties in remote sensing and radiative forcing estimates (Boucher et al. Citation2013).
While the optical properties of amorphous silica seem to be well understood (Hubert et al. Citation2017), this is not the case for crystalline silica (Quartz) for which the latter, in the infrared, remain largely uncertain. The optical constants of crystalline SiO2 (Longtin et al. Citation1988 and references therein) were obtained from two different methods: Equation(1)(1)
(1) using KBr pellet sample (Steyer, Day, and Huffman Citation1974), Equation(2)
(2)
(2) exploiting reflectance spectra and dispersion theory of solid crystal (Spitzer and Kleinman Citation1961) coupled with emissivity spectra and Fresnel’s law (Wenrich and Christensen Citation1996). Furthermore, it is now accepted that the optical constants obtained from these techniques are not suitable for aerosols (McPeath et al. Citation2002) on the one hand because the use of bulk material underestimates the scattering effect and on the other hand because the use of pellets modifies the size, the shape and the vibrational modes. From an overview of the existing literature, it is impossible to obtain consistent values for the optical constants on broad spectral range with a spectral resolution suitable for the latest remote sensing instruments. Previous work has shown that extinction spectra of quartz cannot be simulated from the literature indices, either using the spectral averaging method or the optical constant averaging method (Mogili et al. Citation2007). In this way, some studies have attempted to investigate the effects of particle shape for quartz such as: disk, needle, or ellipsoids associated with different scattering theories such as Continuous Distribution of Ellipsoids (CDE) (Hudson et al. Citation2008), or T-matrix (Kleiber et al. Citation2009; Reed et al. Citation2017). However, even if the comparisons between experimental and calculated spectra are better for the CDE and T-matrix methods than Mie theory, they remain very unsatisfactory in particular in the thermal infrared resonance peak region.
The present work aims to provide a set of consistent refractive indices of crystalline quartz over a wide spectral range (from IR to UV) with a spectral resolution adapted to the capacities of the most recent remote sensing techniques. The next section details the experimental setup and protocol. The size distribution determination and the extinction spectrum are also exposed. Section 3 describes the new aspects of the numerical methodology compared to that used previously (Herbin et al. Citation2017; Hubert et al. Citation2017, Deguine et al. Citation2020) and the newly retrieved refractive indices and their uncertainties are discussed. Finally, Section 4 summarizes our results and presents perspectives for future applications.
2. Experimental setup and results
2.1. Aerosol generation
The aerosol suspension process has already been presented in previous articles (Hubert et al. Citation2017, Deguine et al. Citation2020) and is only briefly recalled here. The quartz sample (S1) comes from Sigma-Aldrich (CAS number 14808-60-7, particle size < 63 μm) and has a density provided by the manufacturer of 2.65 g.cm−3. The sample in a petri dish is placed in an oven at 110 °C for 12 h to remove any water residues. Then, the particles in powder form are introduced into a glass reactor where the fine particles are resuspended and carried by a flow of nitrogen gas (N2, purity 99.996%), under mechanical agitation from magnetic stirring. The concentration can be adjusted by varying the speed of the magnetic stirrer between 0 and 1500 rpm and the inlet flow rate from 4.3 to 6.5 L.min−1 managed by a mass flow controller. A buffer volume is placed at the outlet of the reactor to decouple the resuspension and sampling parts. This volume also ensures a homogeneous mixture of aerosols and avoids overpressure in the device thanks to an exhaust. At fixed speed rotation and N2 flow rate, the concentration remains stable over several minutes, allowing good quality recordings during the acquisition time of the spectra. Finally, tests carried out by placing particle counters upstream and then downstream of the spectrometers show that the loss in number of particles in the cells is negligible (<1%).
2.2. Size distribution determination
In order to accurately determine the entire size distribution, we use two instruments simultaneously. The first is an Aerodynamic Particle Sizer (APS, TSI 3321) measuring the time of flight of the particles, allowing the determination of their aerodynamic diameter (Da) in the range 0.523 − 20 μm. A measured size distribution by the APS (32 channels per decade, 52 channels in total) of a quartz sample is represented by black bins on .
Figure 1. Quartz particles size distribution measured by APS (black bins), SMPS (grey bins), and the corresponding lognormal function with = 0.24 µm and σ = 2.24 in red curve.
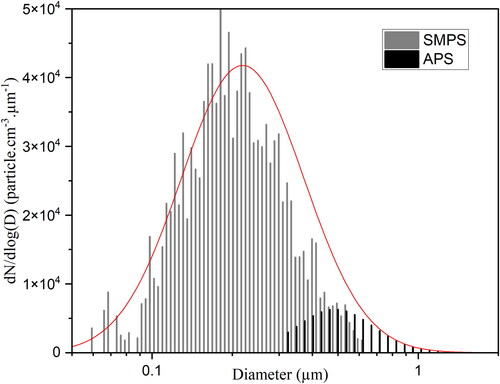
The second device is a Scanning Mobility Particle Sizer (SMPS TSI) used to measure finer particles. This instrument couples a Differential Mobility Analyzer (DMA TSI 3080) to select particles according to their electrical mobility and a downstream Condensation Particle Counter (CPC TSI 3775) that counts the previously selected particles. The SMPS records the particle size distribution with an electrical mobility diameter Dm between 10 and 800 nm. The SMPS size distribution measurement is given by grey bins on .
The two size distributions from SMPS and APS overlap between the 500 nm and 800 nm geometric diameters where both instruments have good counting efficiencies. As detailed in Khlystov Citation2004, by measuring the same size distribution based on different physical properties it is possible to estimate the dynamic shape factor χ, according to the equation (Hinds Citation1999):
(1)
(1)
where ρ0 and ρm are densities of pure water (1 g.cm−3) and particle under study, respectively, C(Da) and C(Dm) are the Cunningham slip factors for the aerodynamic and mobility diameters, respectively, according to Kim et al. (Citation2005).
By using a similar method as described by Khlystov Citation2004, which consists in determining χ by fitting the EquationEquation (1)(1)
(1) from the experimental data Dm from the SMPS and Da from the APS in the area of diameters overlap, we estimated the shape factor χ = 1.33. This value is typical for irregular particles and is consistent with these obtained by Alexander et al. Citation2016 for similar particle size ranges. By taking χ into account, the aerodynamic diameters Da measured by the APS are converted into electric mobility diameters Dm.
Both distributions can then be fitted with one lognormal function, which is symmetrical with respect to the mean diameter described as:
(2)
(2)
where N is the concentration in particles per cm−3, D is the diameter of the size distribution in μm,
is the mean diameter, and σ is the geometric standard deviation. Thus, this function generates 182 (107 identical to SMPS and 75 to APS) size classes starting from a diameter of 14.6 nm up to 10.2 μm and where the base-10 logarithms of the diameters are regularly spaced (see red curve on ).
2.3. Extinction measurements
The infrared part of the spectrum is recorded from a Fourier Transform InfraRed (FTIR) Spectrometer (iS50 from Thermo Scientific) equipped with a multi-pass cell with ZnSe (TIR) and BaF2 (NIR) windows, and an optical path of 10 meters which allows to increase the sensitivity, i.e., to reduce the particle concentration in order to verify the single scattering criterion. Moreover, the cell is placed horizontally in order to minimize the deposition of particles on the mirrors. The spectrometer is also equipped with a set of beam splitters (KBr, CaF2) and detectors (MCT, InGaAs) to cover the 600–9000 cm−1 spectral range with a spectral resolution of 0.5 cm−1.
The UV-Visible part of the spectrum is obtained using a spectrometer composed of a source containing two specific lamps: a deuterium which emits in the UV (210–400 nm) and a halogen one covering the visible and near infrared parts (360 and 1500 nm). The light beam is injected into an optical fiber with a core diameter of 200 μm. At the output of the fiber a collimator delivers a parallel beam of 8 mm diameter through the cell. At the other end, the beam is collimated onto the input of an optical fiber which is connected to the Maya2000-Pro detector device (Ocean Optics). The latter consists of a grating (HC-1) and of a 2064 × 70 pixel CCD (Hamamatsu S10420) which collects the diffracted light in a spectral band between 200 and 1100 nm (i.e., 9000 and 40,000 cm−1). A slit placed at the entrance of the device, with an opening of 25 μm, allows spectra to be obtained with a spectral resolution of 1 nm. The spectrometer has a single pass cell of 1 meter optical path and 48 mm inner diameter. Aerosols are injected at 45° into the cell to limit the accumulation of particles on the inner surfaces, and the whole is inside an opaque black box to limit parasite light.
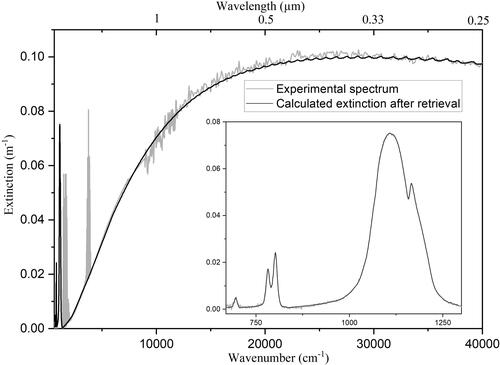
The measured extinction spectrum of quartz corresponding to the size distribution discussed in Section 2.2 is shown in . The latter is a combination of the three spectral ranges covered by the MCT (620–4000 cm−1), the InGaAs (3500 − 9000 cm−1) and CCD (9000–40,000 cm−1) detectors. The spectrum obtained is very close to those already obtained previously (Mogili et al. Citation2007; Reed et al. Citation2017). However, we can notice the good signal-to-noise ratio, with mean values for each spectral range covered being 200 between 620–4000 cm−1, 400 in the 3500–9000 cm−1 spectral range and 100 in the UV-visible region. Despite the purge of several hours, two rovibrational bands of residual water vapors are present around 1600 and 3600 cm−1. In the infrared region between 650 and 1300 cm−1, three absorption bands caused by vibrations of the silicon-oxygen bonds are observed. The main absorption band is located around 1100 cm−1, and is attributed to the asymmetric elongation vibrations of the Si-O-Si bridges (Kitamura, Pilon, and Jonasz Citation2007). The absorption band between 782 and 802 cm−1 is due to Si-O-Si symmetric elongation vibrations, involving the displacement of the oxygen atom perpendicular to the plane in which the silicon atoms lie. Finally, the band at 696 cm−1 corresponds to the angular deformation of the Si-O-Si bridge. The positions of each peak determined in our extinction spectra are in good agreement with literature values (Hlavay et al. Citation1978; He et al. Citation2019).
Figure 2. Extinction spectrum of quartz between 650 and 40,000 cm−1. The spectral range 8500–9500 cm−1 is very noisy, the plot in this gap corresponds then to linear interpolated data. The two strong rovibrational absorption bands around 1600 and 3600 cm−1 are due to residual water vapor and they are therefore removed in the CRI calculation. The inset shows a zoomed portion of the extinction spectrum in the TIR (between 650 and 1350 cm−1) where the o- and e-rays are pointed out by vertical lines.
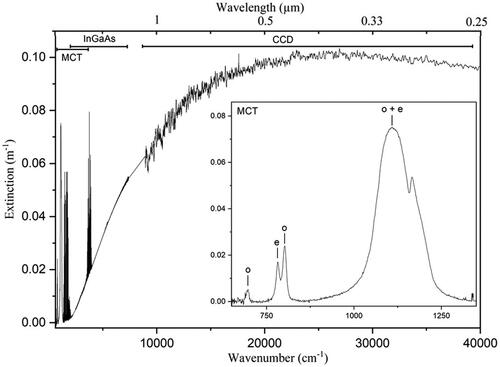
Quartz is a birefringent material whose optic axis correspond to the crystallographic axis (a, b and c). Electromagnetic wave propagating in any direction through a uniaxial mineral such as quartz is divided into two polarized rays, the ordinary (o) ray and the extraordinary (e) ray, traveling at different velocities. So, the o-ray energy can propagate along both the c and the a axes, however, the e-ray energy may not propagate along the c axis because the electric vector of the extraordinary ray is parallel to the c axis. Thus, the energy traveling parallel to the c axis is strictly the o-ray and the energy traveling parallel to the a axis is composed of equivalent amounts of o- and e-rays. Then, the accepted method for calculating the optical properties for a distribution of randomly oriented quartz particles is to calculate individual spectra for both o-ray and e-ray indices, and then to take a weighted average of the spectra in the form [(2/3) o-ray + (1/3) e-ray] (Bohren and Huffman, Citation1983). Due to the experimental method used for particle suspension and transportation, the spectrum in corresponds to an average over different particles orientations, which we checked using a polarizer. Indeed, no changes of the intensity in the extinction spectrum were detected when using an IR polarizer at different orientations. It is also interesting to notice that often, the tabulated optical constants are at fairly low resolution and the fine details of the resonance line shape may not be well modeled, but here thanks to a spectral resolution of 0.5 cm−1 the absorption bands of o- and e-rays are quite well resolved in particular around 800 cm−1.
3. Complex refractive indices
3.1. Methodology
The formulation of the extinction spectrum (cf. ) can be written under the single scattering criterion:
(3)
(3)
where E(
) is the measured extinction spectrum, l is the optical path length (cm), N(r) is the number concentration of particles with radius r (part.cm−3), and
ext is the extinction cross-section (cm2).
The formulation of ext depends on the scattering regime, but whatever its form it always depends on the size distribution and the real and imaginary parts of the refractive index. The simple idea is to use experimental measurements of extinction and size distribution to determine the CRIs.
For the extinction spectrum, the only manipulation of the experimental data is to smooth the UV-vis. spectral range to remove high frequency noise and, in the IR region the residual water vapor bands to avoid including them in the calculation of the indices. Then, the whole spectrum is interpolated onto a grid of wavelengths regularly spaced by 1 cm−1.
From an optical point of view, we have to consider the volume equivalent diameter Dve of the particles, we must therefore convert the size distribution in from the following relationship:
(4)
(4)
with C(Dve) the Cunningham slip factor of volume equivalent diameter.
From EquationEquation (4)(4)
(4) it can be seen that for irregular particles (χ > 1), the mobility diameter (Dm) is always larger than the volume equivalent diameter (Dve). As we do not know the value of C(Dve) and the value of the shape factor χ is only an average estimation for the whole SD with a large uncertainty, the lognormal size distribution parameters are adjusted using a least squares method close to that described in Mogili et al. Citation2007, but only in the spectral range 4000–40,000 cm−1, where the extinction spectrum is dominated by the real part of the CRI, n, whose values are correctly retrieved regardless of the experimental method used (pellets, bulk material, suspended particles). The new SD parameters values are Dve = 0.18 µm and σ = 2.22 and the simulated extinction spectrum using these fitted parameters is compared with the experimental one in . As expected, the Mie theory using the indices from the literature reproduces quite well the experimental extinction spectrum on the spectral region: 4000–40,000 cm−1.
Figure 3. Comparison between experimental extinction spectra of quartz (grey line) in the NIR and UV-visible regions, calculated from Mie theory using the CRIs from the literature (black line) and calculated from geometric optic (grey dashed line).
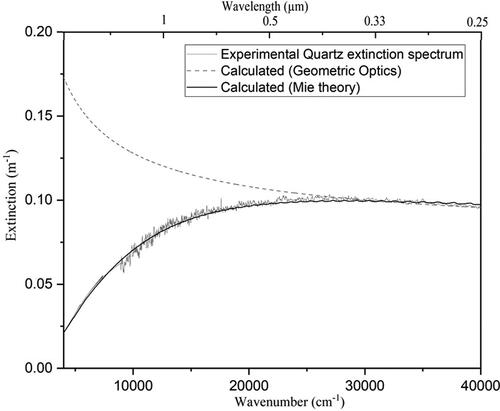
In addition, a spectrum calculated from geometric optics has been performed because at high wavenumber the extinction mainly depends on the SD. Indeed, the asymptotic representation of the Mie series gives the following approximate expression for the extinction efficiency (Nussenzveig and Wiscombe Citation1980):
(5)
(5)
where x =
is the size parameter, with r the radius of the particles and λ the wavelength, both in µm.
The EquationEquation (5)(5)
(5) shows that the extinction of micrometric particles does not depend on the refractive index values in the UV-Visible part. As shown in , the coherence between the three curves for
> 30,000 cm−1 validates the SD parameters retrieved
In practice, even knowing extinction and size distribution, obtaining CRIs is not trivial, because at each wavenumber corresponds two unknowns (n and κ). The problem is therefore mathematically ill-conditioned and under-constrained. We therefore use the Optimal Estimation Method (OEM) (Rodgers, Citation2000) which is perfectly adapted to weakly nonlinear problems and widely used in the remote sensing community to retrieve physical parameters from experimental measured spectra. Moreover, the use of Kramers-Kronig relations which link the real and imaginary parts of the CRIs adds a correlation between n and κ which allows on the one hand to increase the constraints on the restitution but also to ensure the respect of the principle of causality for the couple n and κ at the end of the iterative process on the whole covered spectral domain. In short, the goal of the OEM is to obtain a meaningful solution by regularizing the retrieval with a priori information about the variables. This information is composed of an a priori vector formed by na
and κa
values, and an a priori variance-covariance matrix
(Rodgers, Citation2000). In this case, the goal of the retrievalis to find the real and imaginary parts of the refractive index
which are the approximation of the true state x, which best agrees with both the measurement and the a priori information. The solution
is found by an iterative process (Rodgers, Citation2000):
(6)
(6)
where y is the measured extinction spectrum, F is the forward model used (here it corresponds to the scattering theory), is the Jacobian matrix, and KT is its transposed. Previously
(Hubert et al. Citation2017; Deguine et al. Citation2020), was estimated only from the signal-to-noise ratio. We have here another procedure which determines an average noise in the two spectral regions including both the instrumental noise and the error made by the smoothing of the experimental spectrum. Sε is thus a diagonal matrix so each element is calculated, such that:
(7)
(7)
The first step of the iterative process consists to determine an initial guess for the imaginary component, κa from the Rayleigh theory. The Single Subtractive Kramers-Kronig (SSKK) integration is then performed to calculate the real component, na
. The latter requires an anchor point, na (
), which is the real component of the refractive index at a wavenumber
chosen in the UV-visible spectral region of the spectrum, where the sensitivity of the measurement is maximum for n and minimum for κ (see Herbin et al. Citation2017). Sa is estimated from the difference between the experimental spectrum and the calculated one using the na
and κa
estimations, typically set to 2%. These a priori xa and Sa are used by the forward model F to simulate an extinction spectrum and modify at each iteration according to EquationEquation (6)
(6)
(6) to improve the comparison between measured and calculated spectra F(x).
The retrieved state is obtained after convergence, that is to say when there is no further improvement in the difference between the intensities of the calculated and measured spectra. This is generally the case when this difference is of the order of magnitude of the instrumental noise.
3.2. CRIs retrieval
In previous works we have used Mie theory to calculate the extinction. On the one hand, because Mie theory is well understood and easy to apply, given the size distribution and complex refractive indices of the particles (Bohren and Huffman, Citation1983), and on the other hand because it is classically used for modeling radiative transfer through the scattering atmosphere in both climate modeling calculations and satellite data retrieval (Bond et al. Citation2013; Nishizawa et al. Citation2008; Clarisse et al. Citation2010). The quartz retrieval using the method described in Section 3.1 give acceptable results in the NIR and UV-visible parts of the spectrum as suggested in the Section 3.1 and the . However, the use of Mie theory for irregular particle shapes failed in the TIR spectral range. In practical terms, this means that despite the good quality of the measurements and the a priori (values and variabilities), the algorithm failed to converge satisfactory to reproduce the measured extinction spectrum in the thermal infrared region. This can be explained by the fact that here the shape factor χ is too significant to be neglected. Mie theory is derived only for homogeneous spherical particles and it is well known that mineral aerosols can be inhomogeneous and irregular in shape (Dick et al. Citation1998). This can have a significant impact on the optical properties (Kalashnikova and Sokolik Citation2004) and then introduces inaccuracies and errors in the aerosol characterization (Pierangelo et al. Citation2004).
To overcome this difficulty, some methods for calculating the scattering by nonspherical particles, such as T-matrix or discrete dipole approximation (DDA) (Drain and Flatau Citation1994; Mischenko et al. Citation2002) have been tested (Dubovik et al. Citation2006; Kalashnikova et al. Citation2005). These methods offer more flexibility in constructing model particles that are inhomogeneous and irregularly shaped, but they are more computationally demanding and they still involve significant approximations and assumptions. Thus, it is clear that further experimental studies are needed to assess the relevance of these different approaches, but at present it is still very difficult to accurately characterize the shape of the particles. For example, SEM appears to be an interesting tool, but it suffers from a lack of statistical representation of the sample and only gives information about the shape in two dimensions.
Furthermore, in the particular case of quartz, several works have tested the use of different methods to calculate the extinction (Mogili et al. Citation2007, Hudson et al. Citation2008, Reed et al. Citation2017) from literature CRI. In particular, Reed et al. (Citation2017) have recently attempted to reproduce their quartz infrared spectrum from a minimization method using T-matrix by varying the form factor which offers more degrees of freedom. However, even using a wide form factor distribution, the fit remains unsatisfactory. This suggests that although the consideration of particle shape is important, it is not sufficient to explain the remaining discrepancies which are attributable to incorrect refractive index values.
Previous studies (Hudson et al. Citation2008; Reed et al. Citation2017) have shown that the continuous distribution of ellipsoids (CDE) model, corresponding to the case where all forms are equiprobable, better reproduce the resonance peak positions and band shapes than Mie theory and provides remarkably good fits to the infrared extinction data for some mineral components (especially calcite and quartz), it therefore seems appropriate to replace in our algorithm the Mie extinction cross section calculation by the CDE expression (Bohren and Huffman, 1983):
(8)
(8)
where k = 2 π/λ, and V = 4/3 π
3 is the equivalent volume of particles.
However, expression 7 is only valid in the Rayleigh approximation, i.e., for size parameters x≪1, which is incompatible with our method of retrieving the indices, which requires the use of the whole extinction spectrum. In order to overcome this difficulty we added a step to the procedure which consists in determining the wave number limit of the validity of the Rayleigh approximation. In the method described in Herbin et al. (Citation2017) the first step is to obtain an a priori set of indices using the Rayleigh approximation and a fit from the Mie theory. Here we jointly perform a fit from Mie and CDE calculations. The limit wavenumber corresponds to the one for which we obtain an identical value of the imaginary part of the index from both calculations. For this study this value is 1333 cm−1. In addition, compared to previous work Deguine et al. Citation2020; Herbin et al. Citation2017; Hubert et al. Citation2017), we have included in the optimal estimation routine the fact that the fit of the CRIs by the CDE between 650 cm−1 and 1333 cm−1 is constrained by the values obtained from Mie between 1333 cm−1 and 40,000 cm−1. Note that the use of the whole spectrum and the KK relation ensures the homogeneity and continuity of the retrieved CRIs.
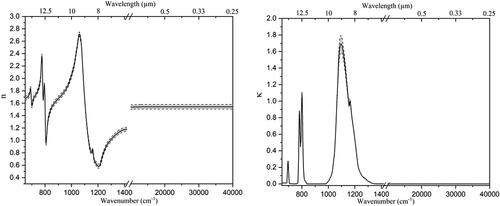
The latter are shown in and given as supplementary material.
Figure 4. Real (left panel) and imaginary (right panel) parts of the retrieved complex refractive index of quartz (in black lines). The uncertainties are illustrated by a grey band delimited by black dash.
The characterization of the retrieved quantities in terms of error sources is essential to estimate the quality of the results. A major advantage of the OEM is to provide an efficient way for characterizing the retrieved state, which is given by (Rodgers, Citation2000): The total error variance-covariance matrix can then be written as the sum of three individual contributions:
(9)
(9)
In EquationEquation (9)(9)
(9) , the first term
is the smoothing error, which accounts for the sensitivity of the measurements to the retrieved parameters; the second term
is the measurement error (see Section 3.1); and the third one
is the model parameter error, which represents the imperfect knowledge of the size distribution parameters. These covariance matrices are calculated from the identity matrix I; the gain matrix G, whose rows are the derivatives of the retrieved state with respect to the spectral points and it is defined by:
and the averaging kernel matrix A, gives a measure of the sensitivity of the retrieved state to the true state, which is defined by:
Sb is the variability on the non-retrieved parameters of the model, corresponding here to the aerosol concentration and size distribution. Sb values are given by the uncertainties estimated by the SD retrieval procedure, i.e., 1% for the concentration, 0.5% for Dve and 1% for σ. The trace of Stotal matrix give the total uncertainty at each wavenumber, represented by dash lines in , and they are on average for the whole spectral range of 2.5% for the real part n, and 1.7% for the imaginary part κ of the refractive indices.
The calculated extinction spectrum using the retrieved CRI is compared to the experimental one in . We can notice the very good agreement quantified by an average root mean square (RMS) of 1.47 10−3 calculated for the whole spectral range and 3.68 10−5 in the infrared between 650 and 1333 cm−1. These RMS are much lower than the measurement noise (see Section 2.3).
Figure 5. Comparison between the experimental quartz spectrum (grey line) and the calculated one at the end of the retrieval process (black line). The two strong rovibrational absorption bands visible around 1600 and 3600 cm−1 on the grey line are due to residual water vapor and they are therefore not considered in the calculated extinction spectrum (black line). The inset shows a zoomed portion of the extinction spectra in the TIR (between 650 and 1350 cm−1).
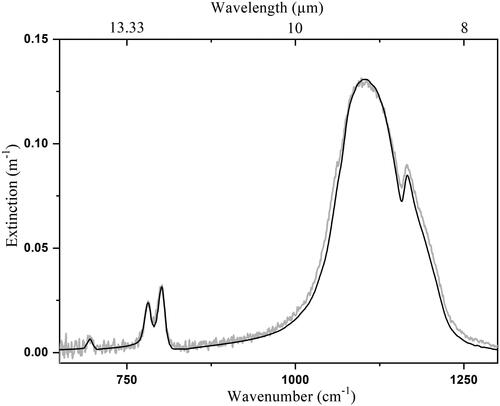
Optical properties are dependent of the chemical composition and of the sample fabrication process. However, to ensure that the complex refractive indices are those of the material and not of the medium, an additional work has been done. Using the same experimental conditions, the extinction spectrum of another quartz sample (S2) purchased from Sigma-Aldrich (Fluka, purity 99%, particle size < 10 μm, density of 2.6 g.cm−3) have been recorded as well as the corresponding size distribution (Dve = 0.2 µm and σ = 2.4). shows the comparison between the experimental extinction spectrum obtained from S2 and the simulated one calculated by the CDE relation Equation(6)(6)
(6) using the complex refractive index previously retrieved from S1 sample (). Comparison has been done on the whole spectral range, but only an expanded view in the IR spectral region has been selected, where the CRIs values are the most discussed in the literature. This extinction spectrum covers the spectral region 650–1333 cm−1 at a spectral resolution of 1 cm−1. Simulated extinction spectrum from retrieved optical constants presented in shows an excellent agreement with the data in terms of band shapes, peak positions and intensities. The overlay is not perfect, but the comparison is very satisfactory considering the fact that the quartz sample is not exactly similar. This result illustrates not only the consistency of the simulated extinction from the retrieved CRIs with the measurement, but also the good reproducibility of the whole process, both experimental and numerical.
Figure 6. Comparison between the experimental quartz spectrum (grey line) corresponding to sample S2 and the calculated one (black line) using the CRIs retrieved for S1 () and the size distribution measurement of S2.
4. Conclusion
Previous studies demonstrated that Mie theory was suitable for reproducing the extinction of aerosols even if they were not spherical. However, this assumption failed to reproduce the infrared part of the spectrum in particular around the resonance peak around 10 µm for birefringent compounds such as crystalline quartz and calcite. Thus, whatever the scattering theory (Mie, CDE, T-Matrix, DDA) and the refraction indices of the literature used, it appears difficult to correctly simulate the spectrum of crystalline quartz in the thermal infrared. The latter being one of the major elements of mineral dust, this represents a significant source of uncertainty for their retrieval by remote sensing measurements and therefore for the quantification of their radiative impact. This highlights the necessity to improve the quartz optical properties. For this purpose, we used an experimental set-up allows recording simultaneously high spectral resolution extinction spectra and size distribution of homogeneous well-mixed aerosol flow. These data are then combined in a numerical procedure to obtain new quartz optical constants. As the retrieval process of the CRIs from the Mie theory does not lead to a satisfactory convergence in the TIR, we adapted our algorithm in order to replace it by the CDE formula between 650 and 1333 cm−1. Since the latter is limited to small size parameters, the rest of the spectrum is adjusted simultaneously from Mie theory. We then obtain a continuous and coherent set of real n and imaginary parts of the complex refractive index from 650 to 40,000 cm−1. These new optical constants were then used to fit an extinction spectrum from another different sample of crystalline quartz. The general agreement shows that our approach is suitable to reproduce the experimental quartz extinction spectrum and validates the consistency of the new CRIs. The latter are available on request or in online supplementary materials and they can be introduced in the existing optical constants databases such as ARIA (Aerosol Refractive Index Archive). Finally, recent work exploiting these data has shown the interest of having homogeneous optical properties with high spectral resolution for a better physico-chemical characterization of aerosols from the IASI satellite instrument (Alalam et al. Citation2022). Current experimental efforts focus on extending the spectral range covered toward the far infrared (100–650 cm−1), particularly in preparation for the FORUM space mission.
Supplemental Material
Download MS Excel (190.9 KB)Acknowledgments
The authors thank Sylvie Gosselin and Valentine Bizet for the technical support.
Disclosure statement
No potential conflict of interest was reported by the authors.
Additional information
Funding
References
- Ackerman, S. A. 1997. Remote sensing aerosols using satellite infrared observations. J. Geophys. Res. 102 (D14):17069–79. doi:10.1029/96JD03066.
- Alalam, P., L. Deschutter, A. A. Choueiry, D. Petitprez, and H. Herbin. 2022. Aerosol mineralogical study using laboratory and IASI measurements: Application to East Asian Deserts. Remote Sens. 14 (14):3422. doi:10.3390/rs14143422.
- Alexander, J. M., M. Bell, D. Imre, P. D. Kleiber, V. H. Grassian, and A. Zelenyuk. 2016. Measurement of size-dependent dynamic shape factors of quartz particles in two flow regimes. Aerosol Sci. Technol. 50 (8):870–9. doi:10.1080/02786826.2016.1200006.
- Bohren, C., and D. Huffman. 1983. Absorption and scattering of light by small particles. New York: John Wiley & Sons.
- Bond, T. C., S. J. Doherty, D. W. Fahey, P. M. Forster, T. Berntsen, B. J. DeAngelo, M. G. Flanner, S. Ghan, B. Kärcher, D. Koch, et al. 2013. Bounding the role of black carbon in the climate system: A scientific assessment. J. Geophys. Res. Atmos. 118 (11):5380–552. doi:10.1002/jgrd.50171.
- Boucher, O., D. Randall, P. Artaxo, C. Bretherton, G. Feingold, P. Forster, et al. 2013. Clouds and aerosols. In Climate change 2013: The physical science basis. Contribution of working group I to the fifth assessment report of the inter-governmental panel on climate change; book section, ed. T. Stocker, D. Qin, G.-K. Plattner , M. Tignor, S. Allen, J. Boschung, 571–658. Cambridge, United Kingdom and New York, NY, USA: Cambridge University Press.
- Clarisse, L., D. Hurtmans, A. J. Prata, F. Karagulian, C. Clerbaux, M. De Mazière, and P.-F. Coheur. 2010. Retrieving radius, concentration, optical depth, and mass of different types of aerosols from high-resolution infrared nadir spectra. Appl. Opt. 49 (19):3713–722.
- Deguine, A., D. Petitprez, L. Clarisse, S. Gumundsson, V. Outes, G. Villarosa, and H. Herbin. 2020. Complex refractive index of volcanic ash aerosol in the infrared, visible, and ultraviolet. Appl. Opt. 59 (4/1):884–95.
- DeSouza-Machado, S. G., L. L. Strow, S. E. Hannon, and H. E. Motteler. 2006. Infrared dust spectral signatures from AIRS. Geophys. Res. Lett. 33 (3):L03801. doi:10.1029/2005GL024364.
- Dick, W. D., P. J. Ziemann, P. F. Huang, and P. H. McMurry. 1998. Optical shape fraction measurements of submicrometre laboratory and atmospheric aerosols. Meas. Sci. Technol. 9 (2):183–96. doi:10.1088/0957-0233/9/2/006.
- Drain, B. T., and P. J. Flatau. 1994. Discrete-dipole approximation for scattering calculations. J. Opt. Soc. Am. A 11 (4):1491–9. doi:10.1364/JOSAA.11.001491.
- Dubovik, O., A. Sinyuk, T. Lapyonok, B. N. Holben, M. Mishchenko, P. Yang, T. F. Eck, H. Volten, O. Muñoz, B. Veihelmann, et al. 2006. Application of spheroid models to account for aerosol particle nonsphericity in remote sensing of desert dust. J. Geophys. Res. 111 (D11):D11208. doi:10.1029/2005JD006619.
- Heaney, P., C. Prewitt, and G. Gibbs. 1994. Silica: Physical behavior, geochemistry and materials applications, 29. Virginia Tech, USA: Mineralogical Society of America.
- Ginoux, P., D. Garbuzov, and N. C. Hsu. 2010. Identification of anthropogenic and natural dust sources using Moderate Resolution Imaging Spectroradiometer (MODIS) Deep Blue level 2 data. J. Geophys. Res. Atmos. 115:5204.
- Grainger, R., D. Peters, G. Thomas, A. Smith, R. Siddans, E. Carboni, and A. Dudhia. 2013. Measuring volcanic plume and ash properties from space. Geol. Soc. Spec. Publ. 380 (1):293–320.
- Granados-Muñoz, M. J., M. Sicard, R. Román, J. A. Benavent-Oltra, R. Barragán, G. Brogniez, C. Denjean, M. Mallet, P. Formenti, B. Torres, et al. 2019. Impact of mineral dust on shortwave and longwave radiation: Evaluation of different vertically resolved parameterizations in 1-D radiative transfer computations. Atmos. Chem. Phys 19:523–42.
- He, M., W. Yan, Y. Chang, K. Liu, and X. Liu. 2019. Fundamental infrared absorption features of α-quartz: An unpolarized single-crystal absorption infrared spectroscopic study. Vib. Spectrosc. 101:52–63. doi:10.1016/j.vibspec.2019.02.003.
- Herbin, H., O. Pujol, P. Hubert, and D. Petitprez. 2017. New approach for the determination of aerosol refractive indices–Part I: Theoretical bases and numerical methodology. J. Quantum Spectrosc. Radiat. Transfer 200:311–9. doi:10.1016/j.jqsrt.2017.03.005.
- Hinds, W. C. 1999. Aerosol technology: Properties, behavior, and measurement of airborne particles. 2nd ed., 483 pp., New York: John Wiley.
- Hlavay, J., K. Jonas, S. Elek, and J. Inczédy. 1978. Characterization of the particle size and the crystallinity of certain minerals by IR spectrophotometry and other instrumental method. II. Investigations on quartz and feldspar. Clays Clay Miner 26 (2):139–43. doi:10.1346/CCMN.1978.0260209.
- Hubert, P., H. Herbin, N. Visez, O. Pujol, and D. Petitprez. 2017. New approach for the determination of aerosol refractive indices – part II: Experimental set-up and application to amorphous silica particles. J. Quant. Spectrosc. Radiat. Transf. 200:320–7. doi:10.1016/j.jqsrt.2017.03.037.
- Hudson, P. K., M. A. Young, P. D. Kleiber, and V. H. Grassian. 2008. Coupled infrared extinction spectra and size distribution measurements for several non-clay components of mineral dust aerosol (quartz, calcite, and dolomite). Atmos. Environ. 42 (24):5991–99. doi:10.1016/j.atmosenv.2008.03.046.
- Kalashnikova, O. V., and IN. Sokolik. 2004. Modeling the radiative properties of nonspherical soil-derived mineral aerosols. J. Quant. Spectrosc. Radiat. Transf. 87 (2):137–66. doi:10.1016/j.jqsrt.2003.12.026.
- Kalashnikova, O. V., R. Kahn, I. N. Sokolik, and W.-H. Li. 2005. Ability of multiangle remote sensing observations to identify and distinguish mineral dust types: Optical models and retrievals of optically thick plumes. J. Geophys. Res. 110:D18S14. doi:10.1029/2004JD004550.
- Khlystov, A. 2004. An algorithm for combining electrical mobility and aerodynamic size distributions data when measuring ambient aerosol. Aerosol. Sci. Technol. 38:229–38.
- Kim, J. H., G. W. Mulholland, S. R. Kukuck, and D. Y. H. Pui. 2005. Slip correction measurements of certified PSL nanoparticles using a nanometer differential mobility analyzer (nano-DMA) for Knudsen number from 0.5 to 83. J. Res. Natl. Inst. Stand. Technol. 110 (1):31–54.
- Kitamura, R., L. Pilon, and M. Jonasz. 2007. Optical constants of silica glass from extreme ultraviolet to far infrared at near room temperature. Appl. Opt. 46 (33):8118–33.
- Kleiber, P. D., V. H. Grassian, M. A. Young, and P. K. Hudson. 2009. T-matrix studies of aerosol particle shape effects on IR resonance spectral line profiles and comparison with an experiment. J. Geophys. Res. 114 (D21):D21209. doi:10.1029/2009JD012710.
- Klüser, L., P. Kleiber, T. Holzer-Popp, and V. H. Grassian. 2012. Desert dust observation from space e Application of measured mineral component infrared extinction spectra. Atmosph. Env. 54 (54):419–27. doi:10.1016/j.atmosenv.2012.02.011.
- Longtin, D. R., E. P. Shettle, J. R. Hummel, and J. D. Pryce. 1988. A wind dependent desert aerosol model: Radiative properties. Hanscom AFB, MA: Air Force Geophysics Laboratory.
- McPeath, R., S. Bass, D. Newnham, J. Ballard, and J. Remedios. 2002. Comparison of aerosol and thin film spectra of super cooled ternary solution aerosol. J. Geophys. Res. 107:4371.
- Mischenko, M. I., L. D. Travis, and A. A. Lacis. 2002. Scattering, absorption, and emission of light by small particles. Cambridge, UK: Cambridge University Press.
- Mogili, P. K., K. H. Yang, M. A. Young, P. D. Kleiber, and V. H. Grassian. 2007. Environmental aerosol chamber studies of extinction spectra of mineral dust aerosol components: Broadband IR-UV extinction spectra. J. Geophys. Res. 112:D21204. doi:10.1029/2007JD008890.
- Nishizawa, T., N. Sugimoto, I. Matsui, A. Shimizu, B. Tatarov, and H. Okamoto. 2008. Algorithm to retrieve aerosol optical properties from high-spectral-resolution lidar and polarization mie-scattering lidar measurements. IEEE Trans. Geosci. Remote Sens. 46 (12):4094–103. doi:10.1109/TGRS.2008.2000797.
- Nussenzveig, H. M., and W. J. Wiscombe. 1980. Efficiency factors in Mie scattering, 1490–1494 (45).
- Petrov, D. V., E. A. Zhuzhulina, and A. A. Savushkin. 2021. Influence of the scattering particle shape on the SiO2 silicate feature. Acta Astrophys. Tau 2 (1):26–9.
- Pierangelo, C., A. Chedin, S. Heilliette, N. Jacquinet-Husson, and R. Armante. 2004. Dust altitude and infrared optical depth from AIRS. Atmos. Chem. Phys. 4 (7):1813–22. doi:10.5194/acp-4-1813-2004.
- Prata, A. J. 1989. Observations of volcanic ash clouds in the 10–12 μm window using AVHRR/2 data. Int. J. Remote Sens. 10 (4-5):751–61. doi:10.1080/01431168908903916.
- Reed, B. E., D. M. Peters, R. McPheat, A. J. Smith, and R. G. Grainger. 2017. Mass extinction spectra and size distribution measurements of quartz and amorphous silica aerosol at 0.33–19 μm compared to modelled extinction using Mie, CDE, and T -matrix theories. J. Quantitat Spectros. Radiat. Transfer 199:52–65. doi:10.1016/j.jqsrt.2017.05.011.
- Rodgers, C. D. 2000. Inverse methods for atmospheric sounding: The theory and practice. Hackensack, NJ: World Scientific.
- Saidou Chaibou, A. A., X. Ma, and T. Sha. 2020. Dust radiative forcing and its impact on surface energy budget over West Africa. Sci. Rep. 10 (1):12236.
- Spitzer, W. G., and D. A. Kleinman. 1961. Infrared lattice bands of quartz. Phys. Rev. 121 (5):1324–35. doi:10.1103/PhysRev.121.1324.
- Steyer, T. R., K. L. Day, and D. R. Huffman. 1974. Infrared absorption by small amorphous quartz spheres. Appl. Opt. 13 (7):1586–90.
- Sugimoto, N., and Z. Huang. 2014. Lidar methods for observing mineral dust. J. Meteorol. Res. 28 (2):173–84. doi:10.1007/s13351-014-3068-9.
- Usher, C. R., A. E. Michel, and V. H. Grassian. 2003. Reactions on mineral dust. Chem. Rev. 103 (12):4883–940.
- Winker, D. M., J. L. Tackett, B. J. Getzewich, Z. Liu, M. A. Vaughan, and R. R. Rogers. 2013. The global 3-D distribution of tropospheric aerosols as characterized by CALIOP. Atmos. Chem. Phys. 13 (6):3345–61. doi:10.5194/acp-13-3345-2013.
- Wang, Z., I. Uno, K. Yumimoto, X. Pan, X. Chen, J. Li, Z. Wang, A. Shimizu, and N. Sugimoto. 2019. Dust heterogeneous reactions during long-range transport of a severe dust storm in May 2017 over East Asia. Atmosphere 10 (11):680. doi:10.3390/atmos10110680.
- Wenrich, M. L., and R. P. Christensen. 1996. Optical constants of minerals derived from emission spectroscopy: Application to quartz. J. Geophys. Res. 101 (B7):15921–31. doi:10.1029/96JB01153.