
 ?Mathematical formulae have been encoded as MathML and are displayed in this HTML version using MathJax in order to improve their display. Uncheck the box to turn MathJax off. This feature requires Javascript. Click on a formula to zoom.
Abstract
In the present study, we propose a novel extended population balance equation (PBE) model for aggregation and sintering and couple it with computational fluid dynamics (CFD) to investigate synthesis of silica nanoparticles in a laminar diffusion flame. The extended PBE includes finite-rate sintering of primary particles by solving the PBE together with a transport equation for the number concentration of primary particles. In the process simulated, the particles are formed via the oxidation of a vapor precursor, hexamethyldisiloxane (HMDSO), and the aerosol processes include nucleation, condensation, aggregation and sintering. The model is validated with detailed experimental in-situ SAXS data found in the literature and is also compared with a monodisperse and a two-PBE approach. Good agreement is found between the extended one-PBE and two-PBE models, while both of them provide a substantial improvement over the monodisperse one. Furthermore, the coupled CFD-PBE simulation with the extended one-PBE model reduces substantially the computational time as compared with the two-PBE model and requires less than twice the time needed for the monodisperse model. Excellent agreement is found between numerical predictions and experimental data for temperature along the centerline and reasonably good agreement is found between numerical predictions and SAXS data for primary particle diameters. While results for the particle number concentration are in qualitative agreement with the experimental data, the particle formation rate is overpredicted, leading to an overestimation of the number concentration of the primary particles. This is attributed to uncertainties in the experimental data and precursor decomposition kinetics.
EDITOR:
1. Introduction
Aerosol flame synthesis is one of the main methods for the industrial production of nanomaterials and has received increased attention over the last few decades. Flame reactors are simple, scalable and most favorable in terms of energy use (Buesser and Pratsinis Citation2012). Today, 80–90% of the commercially available flame-made nanomaterials are manufactured in diffusion or spray flame reactors (Wegner and Pratsinis Citation2003b). The nanoparticles produced find a wide range of applications in gas sensors, energy storage materials, nanotoxicity studies, catalysts, biomaterials, and electroceramics (Meierhofer and Fritsching Citation2021), among others. It is thus desirable to develop models that can aid the production of tailor-made nanoparticles by predicting the particle size and morphology and linking them to process design and operating conditions.
A number of complex transport and kinetic processes take place in flame synthesis of nanoparticles. Fluid mechanics ‘set the stage’ by establishing the temperature and reactant distribution in the domain. Gas-phase chemical kinetics govern the fuel combustion and the precursor decomposition and oxidation. Aerosol processes include nucleation, condensation, aggregation, and sintering. In spite of extensive experimental and theoretical research over the last few decades, modeling, and simulation of the overall aerosol flame synthesis process remains a challenge (Buesser and Gröhn Citation2012). Prediction of particle morphology in different flow regimes, such as laminar or turbulent, is a particularly difficult task (Camenzind et al. Citation2008).
Flame-made nanoparticles are polydisperse in terms of particle sizes, and their polydispersity is characterized by the particle size distribution (PSD). Aerosol dynamics can be described by the population balance equation (PBE), also known as the general dynamic equation (GDE) for aerosols, which describes the spatial and temporal evolution of the PSD due to all the aforementioned physicochemical phenomena encountered in nanoparticle flame synthesis. Furthermore, spatial phenomena such as particle convection, diffusion, and thermophoresis cause particles to follow different trajectories with different temperature and species-concentration histories, leading to a product with a wide variety in morphology. Therefore, the comprehensive modeling of flame synthesis requires coupling of PBE with fluid dynamics, species transport and chemical kinetics to predict nanoparticle properties in laminar and turbulent flows. The role of CFD-PBE simulations is twofold: first, they allow comparison with experimental data to reveal sources of uncertainties and, thus, guide theoretical and experimental research, and second, they can predict the particle properties (primary particle and aggregate sizes, number concentrations, etc.) in the whole reactor domain and thus facilitate the design and scale-up of reactors.
A number of CFD-based studies of flame synthesis of nanoparticles have been reported in the literature. In the present work, the proposed methodology is applied to silica synthesis; hence we survey the relevant studies in chronological order, focusing on the modeling approach adopted in each case. For studies on other inorganic nanoparticles, we refer to the review articles of Buesser and Pratsinis (Citation2012); Buesser and Gröhn (Citation2012), Meierhofer and Fritsching (Citation2021) and Raman and Fox (Citation2016). Furthermore, a review of experimental studies including in-situ measurements of silica nanoparticle synthesis in flames has been conducted, and the studies are summarized in .
Table 1. Comparison of reported flame-made silica characteristics found in selected studies in the literature measured with in-situ techniques.
The coupling of aerosol and fluid dynamics for modeling silica nanoparticle formation in laminar flows was explored in the studies of Kim and Pratsinis (Citation1988), Pratsinis and Kim (Citation1989) and Kim and Pratsinis (Citation1989). A method of moments, where the PSD was assumed to adopt a lognormal shape, was employed to describe aerosol dynamics, while only spherical particles were considered.
Lee, Oh, and Choi (Citation2001) investigated flame synthesis of silica non-spherical nanoparticles in a laminar flat flame. A one-dimensional flame model was employed, together with the sectional two-dimensional PBE model of Xiong and Pratsinis (Citation1993), which accounts for the evolution of aggregate structure. Different expressions for the sintering characteristic time were tested, including a hybrid model between viscous flow and atomistic diffusion sintering models (Ehrman Citation1999). Numerical predictions for number concentrations and particle volume fractions were compared with the in-situ experimental data of Chang and Biswas (Citation1992). Later, Kim et al. (Citation2003) performed two-dimensional CFD simulations to investigate flame synthesis of silica nanoparticles by oxidation of silicon tetrachloride (SiCl4) in a co-flow diffusion laminar flame. A two-PBE sectional model was coupled with CFD and the hybrid sintering model was employed. Their model slightly underestimated the primary particle sizes.
Subsequently, Ji et al. (Citation2007) investigated flame synthesis of silica nanoparticles via CFD. They implemented a moment model and coupled it with commercial CFD software to simulate synthesis of silica nanoparticles through oxidation of tetraethylorthosilicate (TEOS) in a hydrogen diffusion flame reactor. Good agreement with the experimental ex-situ data of Jang (Citation2001) was achieved by performing a parametric analysis and adjusting the particle formation and growth rate constants. However, their model did not distinguish between primary particles and aggregates. Buddhiraju and Runkana (Citation2012) advanced the analysis of Ji et al. (Citation2007) by using a monodisperse population balance model that accounts for fractal aggregates. Results were compared again with the ex-situ experimental data of Jang (Citation2001) and were in close agreement.
Gröhn et al. (Citation2011) incorporated a monodisperse moment model that accounts for fractal aggregates within CFD. They used the Reynolds-averaged Navier-Stokes equations (RANS) approach with a realizable k- turbulence model to model flame synthesis of silica nanoparticles through oxidation of hexamethyldisiloxane (HMDSO) vapor in turbulent methane/oxygen diffusion flames. Furthermore, they investigated different sintering-time expressions, and the results were compared with experimental ex-situ particle size data. Their model underpredicted the primary particle sizes at high oxygen flow rates and at high silica production rates. Olivas-Martinez et al. (Citation2015) used a commercial CFD software to model flame spray pyrolysis (FSP) for synthesis of silica nanopowder and demonstrated the capability of CFD models to be used in the design process of FSP reactors. The standard k-
turbulence model was employed to describe fluid dynamics, spray droplet evolution was described from the Lagrangian point of view and the quadrature method of moments (QMOM) was used to solve the PBE. Their model incorporated nucleation and coagulation of nanoparticles. However, finite-rate sintering was not considered and, therefore, primary particle and aggregate sizes were not distinguished. Instead, the particles were assumed to be spherical, and a finite value of a sticking coefficient was incorporated in the coagulation kernel.
Vo et al. (Citation2017) developed a sparse-Lagrangian multiple mapping conditioning (MMC) model in the context of large eddy simulation (LES), thus accounting for turbulence-chemistry interaction. This model was applied to describe silica nucleation in a temporal mixing layer and the results were validated against data obtained via direct numerical simulations (DNS). Subsequently, this approach was employed by Neuber et al. (Citation2019) who presented a joint experimental and numerical study of flame synthesis of silica nanoparticles. They showed the modeling capabilities of the PBE-MMC-LES approach by simulating flame synthesis of silica nanoparticles in a turbulent reacting jet. This approach was based on a sectional model for aerosol dynamics and also considered the interaction between turbulence, chemistry and particle dynamics. Aggregation of non-spherical particles was considered by assuming a constant primary particle diameter of 0.98 nm. To an extent, a fair agreement was found with the experimental data, while discrepancies were attributed to uncertainties in the precursor-decomposition reaction mechanism.
Feroughi et al. (Citation2017) studied experimentally and numerically a premixed laminar low-pressure flame seeded with low concentrations of HMDSO, and they proposed a reaction scheme for the decomposition and combustion of HMDSO. This scheme was incorporated, along with a monodisperse moment model, into CFD to simulate flame synthesis of nanoparticles. A fair agreement between numerical predictions and experimental particle sizes was found, while the model slightly underpredicted the primary particle sizes at high precursor concentrations. The proposed reaction mechanism was utilized by (Rittler et al. Citation2017) where they developed and presented a model within the LES framework for describing flame spray pyrolysis for synthesis of nanoparticles; however, a comparison with experimental data was not attempted. Recently, Dasgupta et al. (Citation2022) used a commercial CFD software to perform unsteady RANS and study silica nanoparticle synthesis from flame spray pyrolysis. Nanoparticle dynamics was described with the hybrid method of moments while the model of Tsantilis, Briesen, and Pratsinis (Citation2001) for sintering time was employed. Different operating conditions of a complex geometry reactor were investigated, and mean particle diameters were compared with ex-situ experimental data.
Several points can be concluded from the preceding literature review. First, there is a need to develop models capable of predicting the change in particle morphology at different flow regimes. Second, most of the reported CFD studies on turbulent flames were within the context of RANS, which adds extra uncertainty due to the need for modeling turbulent flow, turbulence-chemistry interaction and turbulence-particle interaction where extra terms arise from the Reynolds averaging of the PBE (Rigopoulos Citation2007; Tsagkaridis, Rigopoulos, and Papadakis Citation2022). The modeling challenges arising in turbulent-flow simulations are discussed in more detail in the review articles of Rigopoulos (Citation2010) and Raman and Fox (Citation2016). The extra uncertainty introduced by turbulence closure models could lead to compensation of modeling errors and this complicates the efforts in identifying the precise sources of discrepancies when comparing with experiments. Furthermore, in most of the studies, a monodisperse or moment method was employed for the solution of PBE, which involves further modeling assumptions and does not predict the evolution of the PSD directly. Finally, in most cases, the validation of previous CFD models was done by comparing final primary particle sizes with ex-situ experimental data for particles, while comparison with in-situ data focusing on the evolution of particle growth has been overlooked.
In light of the aforementioned points, the purpose of the present article is twofold. First, we propose a novel extended population balance model for simulating aerosol flame synthesis with the following key characteristics: it distinguishes between primary particles and aggregates, accounts for finite-rate sintering and is computationally efficient. To accomplish this, a sectional method is employed to solve the PBE, which is solved together with a transport equation for the number concentration of primary particles. This approach is more computationally efficient (especially with respect to coupling with CFD) than a two-dimensional or a two-equation PBE while still being able to predict the evolution of primary particle sizes. Second, the aforementioned PBE is coupled with a detailed CFD model and employed to predict the detailed experimental in-situ small-angle X-ray scattering (SAXS) measurements of Camenzind et al. (Citation2008) in a laminar silica synthesis diffusion flame. The quality of CFD simulations is subject to the uncertainties and assumptions involved in the mathematical model. Laminar flames do not pose the complications of turbulence and turbulence-kinetics interaction, and furthermore, the sectional approach employed is free of the closure models required by monodisperse and moment methods. By employing an approach with minimum assumptions with respect to fluid dynamics and population balance modeling, we aim to limit the modeling uncertainties to the selection of aerosol kinetic models and, therefore, shed light on the nature of discrepancies between predictions and experimental results.
The rest of the article is organized as follows: First, the governing equations and population balance models employed in this study are introduced. The subsequent sections describe the numerical solution method, the kinetic models employed and the flame configuration and computational setup. Results are then presented and discussed, and the article concludes with a summary of the main findings.
2. Mathematical formulation
2.1. Reacting flow
The variable density and low Mach number formulation of the conservation equations for mass, momentum, species and energy is employed and summarized below. The equations are presented with Cartesian tensor notation. The continuity equation is:
(1)
(1)
The momentum equation is
(2)
(2)
where
is the velocity component in the i-th direction, p is the pressure,
is the density and
is the gravitational acceleration. For a Newtonian fluid, the stress tensor is given by
where
is the dynamic viscosity of the gas mixture,
is the Kronecker delta, and the strain rate is defined by
The species transport equation is
(3)
(3)
where
are the mass fraction and diffusion coefficient of a chemical species into the gas mixture, respectively,Footnote1 while the mass source due to chemical reaction is denoted
Fick’s diffusion law and the Hirschfelder and Curtiss approximation (Hirschfelder, Curtiss, and Bird Citation1955; Poinsot and Veynante Citation2005) have been employed to calculate
A correction velocity is employed to ensure mass conservation (Poinsot and Veynante Citation2005). The species transport coefficients are estimated with relationships derived from the kinetic theory of gases. The dynamic viscosity of the mixture is obtained by Wilke’s mixing rule (Wilke Citation1950). Finally, the energy equation is written in terms of specific enthalpy that includes the thermal and chemical enthalpies, as follows:
(4)
(4)
where
and
denote enthalpy losses due to the thermal radiation from gas species and particles, respectively, and M is the number of chemical species. Since both chemical and thermal enthalpies are included in the transported quantity, the interchange between them due to reaction does not appear explicitly. The thermal conductivity, k, is obtained by the averaging formula of Mathur and Saxena (Citation1967). Viscous heating, Soret and Dufour effects have been neglected in the overall formulation.
2.2. Population balance
A population balance equation (PBE) is employed to describe aerosol dynamics. Particle morphology is an important factor and its prediction is one of the objectives of the present article. A two-dimensional formulation (Koch and Friedlander Citation1990; Xiong and Pratsinis Citation1993) introduces an additional dimension such as particle surface area, but its Discretized form is too expensive for coupling with CFD. A two-PBE formulation employs two sets of PBEs, one for the number density of particles and another one for number of primary particles (Rogak Citation1997) or particle surface area (Tsantilis and Pratsinis Citation2000); such an approach is computationally feasible and able to incorporate morphology effects, but still requires twice the number of equations as compared with the one-PBE approach. A monodisperse model (Kruis et al. Citation1993) has also been proposed, although this entails several assumptions. In the present section, we first describe the monodisperse and two-PBE approaches employed in our study. Subsequently, a new formulation is proposed that, while employing one PBE, incorporates elements of the two-PBE approach with respect to the description of morphology.
Before proceeding, we first summarize the description of particle morphology adopted in the present study. Coalescence and sintering give rise to fractal aggregates, which are clusters of primary particles. The aggregation kernel must, therefore, be formulated in terms of the aggregate collision diameter, Fractal-like aggregates follow a power-law relationship that relates their collision diameter with the number of primary particles per aggregate,
and their average diameter,
and assumes the following form (Friedlander Citation2000; Buesser and Pratsinis Citation2012):
(5)
(5)
where
is a prefactor associated with the aggregate anisotropy (Heinson, Sorensen, and Chakrabarti Citation2010) and
is the fractal dimension, which has values close to 3 for compacted aggregates and close to 1 for chain-like structures (Friedlander Citation2000). The evolution of
has little effect on final particle characteristics (Goudeli, Eggersdorfer, and Pratsinis Citation2015). In the present simulations, the values
and
were employed corresponding to ballistic cluster–cluster aggregation in the free molecule regime (Ball and Jullien Citation1984; Friedlander Citation2000).
2.2.1. The monodisperse model
The simplest and probably the most widely used model for describing aerosol dynamics in flame-synthesis studies is the monodisperse model of Kruis et al. (Citation1993). In this model, only transport equations for the moments of the PSD are solved, while both aggregate and primary particle size distributions are assumed to be monodisperse. Its success in describing relatively well average particle properties can be attributed to some unique features of nanoparticle flame synthesis, in particular the rapid attainment of the self-preserving aerosol size distribution (SPSD) by coagulation, which simplifies the modeling strategy Buesser and Pratsinis (Citation2012). While the monodispersed model was initially formulated in terms of surface area, in the present work we reformulate it in terms of the number concentration of primary particles for consistency with the detailed PBE models to be discussed later. Specifically, transport equations for the number concentration of aggregates, N and particle volume fraction, and V, are solved along with a transport equation for the number concentration of primary particles, This formulation is equivalent to that of (Kruis et al. Citation1993; Gröhn et al. Citation2011) and the model implementation is validated with the data of Goudeli, Eggersdorfer, and Pratsinis (Citation2015) (Figure S1 of the supplementary information). The equations to be solved are:
(6)
(6)
(7)
(7)
(8)
(8)
where
is the volume of a SiO2 monomer, the particle mean size is given by
is the volume of a nucleus particle,
is the diffusion coefficient of particles of volume v estimated by the Stokes-Einstein equation (Friedlander Citation2000), J is the nucleation rate,
is the aggregation kernel and
is the sintering characteristic time. The kinetic expressions employed will be shown in Section 4. The last term in EquationEquation (7)
(7)
(7) represents the condensation process, where
is the partial pressure of the SiO2 gas species and
is the Boltzmann constant. In the monodisperse model, the
fractional moment of the PSD is given by
The velocity,
is equal to the sum of the flow velocity,
and the thermophoretic velocity,
and the latter can be estimated from the following relationship (Friedlander Citation2000):
(9)
(9)
where T is the local temperature of the gas mixture. The average primary particle size,
and the average number of primary particles per aggregate,
can be calculated as follows:
(10)
(10)
(11)
(11)
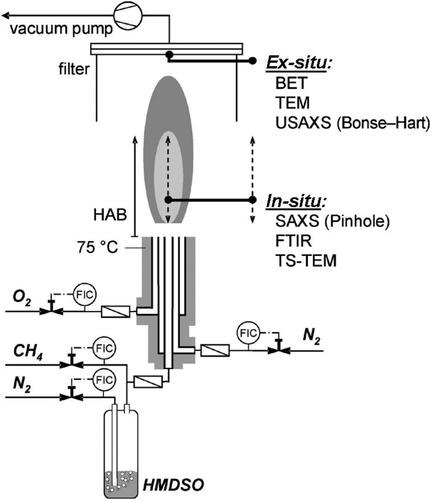
Figure 1. Experimental setup for the synthesis of the SiO2 nanoparticles with a co-flow diffusion flame burner. Reprinted from ‘Nanostructure evolution: from aggregated to spherical SiO2 particles made in diffusion flames’, by A. Camenzind, H. Schulz, A. Teleki, G. Beaucage, T. Narayanan and S.E. Pratsinis, European Journal of Inorganic Chemistry, 2008, vol. 6, p. 911–918. Copyright Wiley-VCH GmbH. Reproduced with permission.
2.2.2. The two-PBE model for aggregation and sintering
A more comprehensive approach to the prediction of the PSD constitutes the direct use of the PBE and its solution by Discretization (the so-called sectional approach). Three main augmentations to the basic PBE have been proposed to account for particle morphology: the two-dimensional PBE, the modified one-dimensional PBE and the coupled two-PBE approach. The two-dimensional approach is too expensive for coupling with a CFD simulation; hence CFD-based efforts have employed the other two methods, a comparison between which can be found in Sun, Rigopoulos, and Liu (Citation2021) in the context of soot formation. In the present work, the two-PBE approach will be used, and its equations are briefly summarized below. The PBE for the aggregates is (Friedlander Citation2000):
(12)
(12)
where v and w express volume of aggregates, while
is the particle number density concentration (denoting number of particles per unit of particle volume and mixture volume). B and C denote the nucleationFootnote2 and condensation rates, respectively, while
is the Dirac delta function. In the two-PBE approach, an additional PBE must be solved to account for particle morphology. In the present formulation, this is an equation for the number density of primary particles and takes the following form (Sun, Rigopoulos, and Liu Citation2021):
(13)
(13)
where
is the number density function of primary particles that form an aggregate of volume v per unit volume,
is the average number of primary particles per aggregate of volume v and
is the condensation rate on primary particles. By definition, the
is given by:
(14)
(14)
Note that, unlike n and
is not a distribution. It is also worth mentioning that the integration of EquationEquations ((12)
(12)
(12) and Equation(13))
(13)
(13) over v results in transport equations for the number concentration of aggregates, N, and the number concentration of primary particles,
which are the variables solved for in the monodisperse model discussed earlier.
Sintering of incipient particles smaller than a minimum particle diameter can be considered instantaneous (Tsantilis, Briesen, and Pratsinis Citation2001). A critical diameter that distinguishes particles that coalesce instantaneously from those that fuze with a finite rate can be introduced in the two-PBE model. This way, particles smaller than the critical diameter are assumed to be spherical, while the number of equations to be solved in Discretization methods is reduced since
where
This value was selected to be 1 nm in the present study.
From knowledge of and
we estimate the number concentration of primary particles,
the average primary particle diameter,
the average number of primary particles per aggregate,
and the average radius of gyration of aggregates as follows:
(15)
(15)
(16)
(16)
(17)
(17)
(18)
(18)
where
is the diameter of the primary particles in an aggregate of volume v,
is the aggregate diameter given by EquationEquation (5)
(5)
(5) , and
is the volume of the smallest detectable particles (1 nm) by SAXS measurements (Camenzind et al. Citation2008).
The assumption inherent in the two-PBE model is that all aggregates of particle volume v consist of equally-sized spherical primary particles. While this is not strictly true, similar assumptions have been used in experimental techniques (Iyer et al. Citation2007), while transmission electron microscope (TEM) images of aggregates have repeatedly shown that the distribution of primary particles within an aggregate is relatively uniform (Kammler et al. Citation2005), supporting the assumptions adopted here. The two-PBE model is a comprehensive approach that yields information for both aggregate and primary particle size distributions and their evolution at a reduced cost as compared with a two-dimensional PBE, but the number of equations to be solved is still twice that of a one-PBE approach, which is significant when it comes to coupling with CFD.
2.2.3. A Novel extended one-PBE model for aggregation and sintering
In the present section, we propose an extended one-PBE model that captures aggregation dynamics and can describe particle-morphology evolution while maintaining computational cost to a level commensurable with other one-PBE approaches. One-PBE models have been employed in the modeling of soot formation in laminar and turbulent flows by simply introducing a predefined cutoff size (Netzell, Lehtiniemi, and Mauss Citation2007; Rodrigues et al. Citation2018) separating primary particles and aggregates that corresponds to the average primary particle size observed experimentally. This approach does not include a finite-rate sintering model, and a detailed discussion of its shortcomings can be found in Sun, Rigopoulos, and Liu (Citation2021). Here, we overcome this problem by solving the PBE together with a transport equation for the number concentration of primary particles, In this way, the sintering process is incorporated into the model and the one-PBE model can predict the evolution of primary particle size.
The evolution of the PSD of aggregates is described by the same equation (EquationEquation (12)(12)
(12) ) as in the two-PBE model. To obtain the additional equation, we assume that the primary particle size is monodisperse (i.e., it is the same for aggregates of all sizes, unlike in the case of the two-PBE model). Based on this assumption,
can be expressed as:
(19)
(19)
where v is the volume of an aggregate and
is the average primary particle volume. By substituting EquationEquation (19)
(19)
(19) into EquationEquation (13)
(13)
(13) and integrating both sides of Equation(13)
(13)
(13) over v, we derive a transport equation for the number concentration of primary particles:
(20)
(20)
where V the particle volume fraction and
is the
fractional moment of the PSD. The condensation term is absent since it does not alter the number concentration of primary particles, while the aggregation terms cancel out after the integration of Equation(13)
(13)
(13) over v. EquationEquation (20)
(20)
(20) is solved along with Equation(12)
(12)
(12) but, unlike the second equation in the two-PBE model, does not require Discretization in the particle volume domain. The
and
are then estimated by EquationEquations ((10)
(10)
(10) and Equation(11))
(11)
(11) . The major advantage of EquationEquation (20)
(20)
(20) over the conventional one-PBE model is that it brings a finite-rate sintering model into the PBE. Compared with the two-PBE model, the drawback is the assumption of monodisperse primary particle size. The importance of this assumption will be discussed in Section 6, where results from both models will be compared with experimental data.
3. Numerical methods
A sectional method is employed for the numerical solution of the PBE (Liu and Rigopoulos Citation2019). It is a conservative finite volume method that was recently extended to the two-PBE formulation by Sun, Rigopoulos, and Liu (Citation2021). The method provides an accurate prediction of the distribution with a small number of sections while conserving the first moment (with respect to volume) during the aggregation process, which is important for satisfying the mass balance. The method can employ an arbitrary non-uniform grid for Discretization along the particle volume domain and has also been shown to be robust and efficient when incorporated within a CFD framework (Liu and Rigopoulos Citation2019; Sun, Rigopoulos, and Liu Citation2021; Sun and Rigopoulos Citation2022). This approach is used for both the one- and two-PBE formulations.
The PBE models have been implemented in our in-house CFD code BOFFIN, which is based on the variable-density low Mach number formulation of the Navier-Stokes equations and has been used to simulate laminar and turbulent flames with soot formation that have similar features to the problem considered here (Sun, Rigopoulos, and Liu Citation2021; Sun and Rigopoulos Citation2022). The Navier-Stokes equations are discretized by applying the finite volume method on a staggered grid. A second-order central Discretization scheme is employed for the convection and viscous terms, while a second-order accurate Crank-Nicolson method is employed for the temporal integration. The convection and viscous terms are treated implicitly. The pressure-velocity coupling is dealt with an iterative SIMPLE-type scheme. The transport equations for the reactive scalars and Discretized PBE are solved with a fractional step method, where separate fractional steps were employed for convection-diffusion, chemical reaction, and PBE integration. A backward Euler scheme is used for the integration of the chemical reaction step, while the explicit Euler scheme was selected for the PBE step since the Discretized PBE is not stiff. The convection-diffusion term is solved as described above with the addition that van Leer’s TVD scheme was employed for the convection terms to ensure boundedness for the reactive scalars.
4. Gas-phase and aerosol kinetics
4.1. Gas-phase kinetics and radiation
The reaction mechanism for methane combustion used in the present study is the Gas Research Institute (GRI) 1.2 mechanism (Frenklach et al. Citation1995), containing 175 steps and 31 species. The reduced two-step mechanism proposed by Feroughi et al. (Citation2017) is employed for the HMDSO (precursor) decomposition and oxidation and is shown in . This global two-step HMDSO mechanism has been used previously in the literature to study the synthesis of silica nanoparticles via flame spray pyrolysis (Rittler et al. Citation2017).
Table 2. Global two-step reaction mechanism for HMDSO combustion (Feroughi et al. Citation2017).
Following Barlow et al. (Citation2001), the optically thin hypothesis is invoked in the present study to model thermal radiation from gas species. The radiative loss term in the enthalpy h equation due to the radiation of the most abundant species H2O, CO2, CH4, and CO can be computed according to:
(21)
(21)
where
W/
is the Stefan-Boltzmann constant,
K is the ambient background temperature, i-index indicates summation over the four major radiating species,
is the partial pressure of species i and
is the Planck mean absorption coefficients expressed as polynomials in temperature (Barlow et al. Citation2001; Grosshandler, Citation1993).
4.2. Nucleation
We follow an approach similar to that described in Shekar et al. (Citation2012) to describe the nucleation process. We assume that two molecules (monomers of SiO2) in the gas phase collide to form a dimer. The dimers are considered to be the first primary particles in the simulation. The free molecule regime kernel is used to describe the self-collision frequency of the monomers. Based on these considerations, the nucleation rate is given by:
(22)
(22)
where
is Avogadro’s number,
is the gas-phase concentration of SiO2 monomers and
is the free molecule coagulation kernel given by:
(23)
(23)
where
is the Van der Waals enhancement factor whose value is approximated to 1.88 based on the observations of Kennedy and Harris (Citation1990),
is the Boltzmann constant, and
and
are the mass and diameter of a SiO2(g) molecule, respectively. It is assumed that SiO2(g) molecules have diameter
nm and that the density of silica particles is
kg/
After Discretization of the PBE, the nucleation source term in EquationEquation (13)
(13)
(13) takes the form:
(24)
(24)
where
is the volume of dimers (volume of nuclei),
is the representative volume (midpoint) in the section that covers the volume of nuclei and
is the interval of that section, respectively.
The approach described above will be used for the results in Section 6, except for Section 6.4.2 where some alternative nucleation models will be explored in order to investigate the sensitivity of the simulation to the choice of nucleation model.
4.3. Condensation
Condensation is considered as a collision process between silica monomers and particles. Let section i denote the range In the Discretized PBE, three different condensation scenarios are considered that can change the number density,
within section i: Equation(1)
(1)
(1) condensation of monomers on particles of section i,
Equation(2)
(2)
(2) condensation of monomers on particles of section
that will enter into section i,
and Equation(3)
(3)
(3) condensation of monomers on particles of section i that will go to section
The condensation rate for each of the scenarios mentioned above is evaluated according to (Sun, Rigopoulos, and Liu Citation2021; Rodrigues et al. Citation2018):
(25)
(25)
(26)
(26)
(27)
(27)
where the collision frequency of a monomer and a particle in section i is evaluated as follows:
(28)
(28)
where
is the volume at the middle of section i and
is the collision diameter of the particles at section i evaluated according to EquationEquation (5)
(5)
(5) . The amplification factor of 1.28 is due to Van der Waals interactions and its value was approximated based on the observations of Kennedy and Harris (Citation1990). Following Sun, Rigopoulos, and Liu (Citation2021), in terms of Discretized PBE, the condensation source terms in EquationEquations (12)
(12)
(12) and Equation(13)
(13)
(13) in section i can be evaluated as:
(29)
(29)
(30)
(30)
where
is the average number of primary particles per aggregate for particles in section i and
is the particle volume range for that section.
4.4. Sintering
Sintering of two particles in contact is driven by the tendency of the system to reduce its surface free energy (Koch and Friedlander Citation1990). Thus, the sintering term in EquationEquation (13)(13)
(13) reduces the number of primary particles. Silica nanoparticles are amorphous materials with low viscosity, and viscous flow (Frenkel Citation1945) is considered the dominant mechanism when sintering takes place (Friedlander Citation2000). Many different expressions for the sintering characteristic time,
of silica nanoparticles appear in the literature without a consensus on which
is more suitable for flame synthesis modeling (Park and Park Citation2015). Goudeli, Eggersdorfer, and Pratsinis (Citation2015) discussed different sintering times of silica found in the literature and tested them in a perfectly stirred reactor (PSR).
In the present study, all four expressions shown in were tested. The Tsantilis et al. expression provided the best results and was thus employed for all the results shown in Section 6, except for Section 6.4.1 where results with all four expressions are compared.
Table 3. Characteristic sintering times for silica nanoparticles tested in the current study.
4.5. Aggregation
Expressions for the aggregation kernel, depend on the Knudsen number,
where
is the mean free path of the gas estimated by Willeke’s formula (Willeke Citation1976). The expressions for the free molecule particle size regime
and the continuum regime
are (Friedlander Citation2000):
(31)
(31)
(32)
(32)
where
is the Cunningham slip correction factor. A harmonic mean of the two expressions (Pratsinis Citation1988) is employed for the transition regime
(33)
(33)
4.6. Thermal radiation from particles
In heavily particle-laden flames, thermal losses due to the radiation from nanoparticles need to be accounted for in the model (Modest Citation2003). The radiative loss term due to the radiation from the nanoparticles is expressed as:
(34)
(34)
where
is the silica volume fraction and
is a proportionality constant. It can be shown that, in the optically thin limit, the heat loss due to emission of thermal radiation from a spherical object surrounded by a vacuum is proportional to the object’s volume (Modest Citation2003). Therefore, it is reasonable that
is proportional to
in EquationEquation (34)
(34)
(34) . Furthermore, Lee (Citation2011) studied the emission properties of silica aggregates at high temperatures and employed the below expression for the spectral radiant intensity
from the particles in a flame:
(35)
(35)
where h is Planck’s constant, c the speed of light in the medium,
the wavelength,
the emissivity of silica and A is an arbitrary constant. Lee (Citation2011) observed that
is a linear increasing function of temperature, while
is expected to be a weak function of
at the wavelengths of interest; therefore, the emissivity of silica is assumed to follow the relationship
Based on these considerations, integration of EquationEquation (35)
(35)
(35) over
and all possible directions results in an expression for the radiative heat flux similar to EquationEquation (34)
(34)
(34) , giving support to the radiation model adopted here. In the absence of any information for the value of A, the value
m
K
was selected in the present study, which is lower than the value of 1307 m
K
used in sooting flame simulations and gave good agreement with the experimental results, as will be shown in Section 6.1.
5. Flame configuration and computational setup
5.1. Flame configuration
The flame under investigation is the ‘S-2’Footnote3 laminar case of Camenzind et al. (Citation2008) and, to the best of our knowledge, the present work is the first simulation of this experiment. The synthesis of silica nanoparticles takes place by oxidation of HMDSO in oxygen/methane diffusion flames. This flame was selected because it is one of the few laminar flames for which in-situ experimental data for the particles are available in the literature (); Camenzind et al. (Citation2008) provided a plethora of particle data for several heights above the burner (HAB) obtained via in-situ SAXS measurements.
The experimental setup is shown in . The co-flow diffusion flame reactor used in the experiment comprised three concentric stainless-steel tubes. The inner tube diameters were mm,
mm, and
mm, while the tube wall thickness was 0.3 mm (Wegner and Pratsinis Citation2003a). Mass flow controllers were employed to maintain constant levels of all gas flow rates, which are given below at standard temperature and pressure (STP) conditions. In particular, 0.3 l/min of N2 passed through a reservoir filled with liquid HMDSO to deliver HMDSO vapor. The HMDSO consumption rate was 6.5 g/h, which corresponds to a SiO2 production rate of 4.8 g/h. Subsequently, the HMDSO-laden N2 gas flow was mixed with 0.5 l/min of methane CH4 and delivered in the reactor through the center tube. The first annulus was fed with 0.5 l/min of N2 to prevent particle deposition on the reactor tips. The second annulus was fed with 2 l/min of O2. The temperature of the reactor and the tubes was maintained at 75
C to prevent precursor condensation on the tube walls. The Reynolds number, based on the bulk velocity and the outer diameter of the reactor, was
5.2. Computational setup
Two-dimensional axisymmetric simulations were performed, with an axisymmetric boundary condition being applied along the centerline and a symmetry boundary condition being applied at the opposite side. A zero-gradient boundary condition was applied at the outlet boundary in the streamwise direction. In the plots, the r coordinate is defined to denote the cross-stream direction. The stream bulk velocities of the jets coming from the inner tube, the first and second annulus were
m/s,
m/s, and
m/s, respectively. The inlet velocities were estimated based on the given mass flow rates reported earlier and by assuming that the temperature of the streams was 75
C. At the inflow, laminar flow velocity profiles were employed for the inner jet as well as through the annular sections for the other two jet streams. The inlet velocity profiles are shown in Figure S2 of the supplementary information. In the absence of any information for the entrainment velocity, a uniform velocity
m/s was used for the air co-flow stream at the inlet and the ambient temperature was set to
C. Test cases showed that
has a minor effect on the results (Figure S3 of the supplementary information). The mole fractions of the species for the inner stream were set to
and
The thickness of the burner tubes was 0.3 mm, which was taken into account in the simulation by applying a no-slip boundary condition at these radii. The inlet boundary conditions employed in this study are summarized in .
Figure 2. Contour plots of (a) velocity and (b) temperature fields.
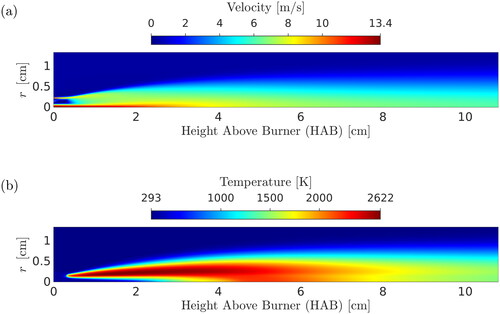
Figure 3. Contour plots of (a) silica volume fraction and (b) primary particle diameter fields.
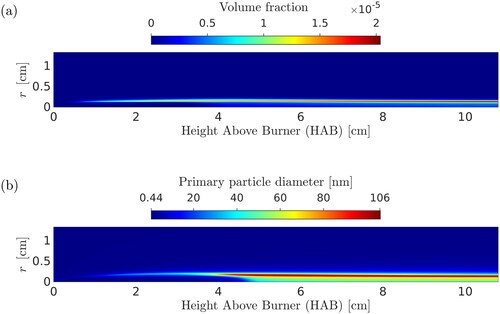
Table 4. Inlet boundary conditions, where denotes the stream bulk inlet velocity in the streamwise direction.
The size of the computational domain is where
mm is the inner tube diameter. A computational grid with
cells with spacing increasing exponentially by factors 1.0132 and 1.03 in the axial and radial directions, respectively, was employed. Images of the computational domain and grid are shown in Figure S4 of the supplementary information. Grid refinement was employed at the height of the second annulus to ensure that at least ten cells were used to capture the inlet velocity profile. Tests with a finer grid comprising about 4.5 times more cells showed that grid independence had been achieved, and the results are shown in Figure S5 of the supplementary information. The time step was
s, resulting in a maximum Courant-Friedrichs-Levy (CFL) number of 0.03. Each simulation was run until the solution reached a steady state independent of the initial conditions. Following this, the simulations were run for more than 3 million time steps, corresponding roughly to 0.4 s of the simulated process.
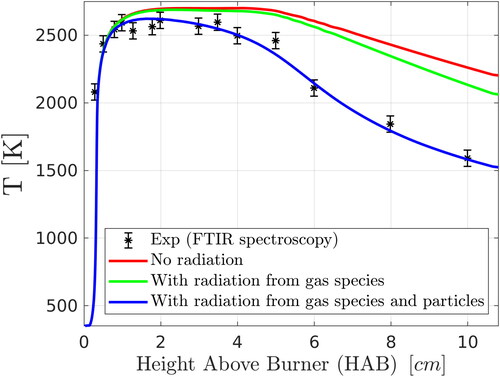
Figure 4. Comparison of numerical predictions (two-PBE model) with the experimental FTIR data of Camenzind et al. (Citation2008) for flame temperature along the centerline and effect of radial averaging. An average experimental error of 60 K given by Kammler et al. (Citation2002) was used in the figure for the FTIR data.
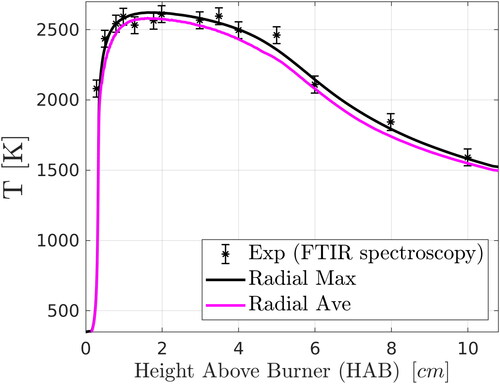
Figure 5. Comparison of numerical predictions (two-PBE model) with experimental data for flame temperature and effect of emission of thermal radiation from gas species and from particles. Results of the radial maximum temperature for each case are compared with the experimental FTIR data of Camenzind et al. (Citation2008). An average experimental error of 60 K given by Kammler et al. (Citation2002) was used in the figure for the FTIR data.
Regarding the Discretization of the PBE, the particle volume domain covered particle sizes from 0.44 nm to 1 m in diameter and was discretized with an exponential grid comprising 60 intervals. Convergence studies with a perfectly stirred reactor showed that this grid sufficed to describe the PSD evolution accurately.
Finally, to ensure that conservation of mass was achieved in the simulation, the silica mass flow rate at the exit of the computational domain was calculated as g/h. The relative difference with the reported (Camenzind et al. Citation2008) silica production rate (4.8 g/h) is less than 1%.
6. Results and discussion
In the present section, the results are presented and discussed. Particular emphasis is given to the validation of the modeling strategy adopted in this study by comparing numerical predictions of particle field quantities with reference in-situ experimental data. Numerical simulations performed with the three population balance models described in Section 2 are referred to as ‘2PBE’, ‘1PBE’, and ‘Mono’, while ‘Exp’ refers to experimental results. An analysis of the calculated timescales and rates is presented to draw insight into the model predictions. Results obtained from alternative sintering and nucleation models are also presented in order to demonstrate the sensitivity of the predictions to modeling choices. Finally, the computational performance of the PBE models is analyzed.
6.1. Flow field and temperature
Contour plots of the velocity and temperature fields are shown in . The numerical results from the three models tested in this study were in good agreement with each other in terms of temperature and velocity fields; therefore, contour plots only for the two-PBE model are shown. The simulation was allowed to reach a steady state before the results were extracted. The volume fraction throughout the domain is shown in . Particles are formed within the flame reaction zone, which is located approximately 1.4 mm away from the flame centerline. It can be seen that particles stay within this thin layer at all downstream locations. This is reasonable considering the very low diffusivity of particles (estimated from the Stokes-Einstein relation (Friedlander Citation2000)) and the laminar flow in the experiment.
Furthermore, a contour plot of the primary particle diameter is shown in . Primary particles have diameters less than 15 nm at low HABs, while they grow in size rapidly at HAB
cm at the flame front and eventually reach constant values downstream. It is observed from that the maximum primary particle sizes appear within the thin layer where the maximum silica volume fraction is located. As will be explained later, in the vicinity above the burner, the particle formation rate is comparable to particle aggregation rates, resulting in small average primary particle sizes. After the flame front at
HAB
cm, conversion of the precursor is almost complete, the effect of particle nucleation is less significant and sintering becomes the dominant mechanism, leading to rapid primary-particle growth. At HAB
cm, sintering ceases, and aggregation becomes the dominant mechanism. This explains why the primary particle size remains almost constant at these locations.
A comparison of numerical results for temperature with the experimental data of Camenzind et al. (Citation2008) is shown in . As before, only results with the two-PBE model are shown in and since all of the three PBE models resulted in similar temperature distributions. Accurate prediction of temperature is the cornerstone of flame synthesis modeling, as it is driving many of the subsequent processes. In the present study, numerical results for flame temperature are in good agreement with the experimental data, largely due to the direct coupling of detailed chemistry with flow, the absence of modeling uncertainties involved in turbulent flame simulations (turbulence modeling and turbulence-chemistry interaction), and the inclusion of the model for the thermal radiation from particles.
The experimental temperature data were obtained using Fourier transform infrared (FTIR) spectroscopy (Griffiths and De Haseth Citation2007; Morrison et al., Citation1997) which is a line-of-sight technique over the total flame width. It has been documented that the FTIR data represent a radial-average temperature of the diffusion flame in the region close to the burner tip, where reactants are not mixed (Camenzind et al. Citation2008) (in fact, in this region, the temperature on the flame centerline is well below the reported values, which can also be observed in ), while further downstream the radial average does not differ significantly from the centerline value. For this reason, numerical results for the radial maximum value of temperature at each height above the burner are plotted (solid black line) in , instead of the centerline values. Radial maximum temperatures are more representative of the experimental data. Emitted radiation (relevant to FTIR measurements) scales with the fourth power of temperature; thus, it can be expected that regions with the highest temperature would dominate in the FTIR data analysis. Nevertheless, radial averaging of values of cells in the flame reaction zone was performed, and results are also presented in (solid magenta line). The flame reaction zone was approximated with the cells whose value of CO2 concentration is greater than 80% of the radial maximum value at each height above the burner. However, both lines in lie within an average experimental error of 60 K (Kammler et al. Citation2002) for most HABs, indicating that the flame temperature was predicted accurately by the simulation.
In order to quantify the effect of thermal radiation from gas species and from particles, two alternative simulations were performed and are compared with the one including radiation in . In one case (red line), all radiation thermal losses were neglected, while in another (green line) radiation from gas species only was considered. When only radiation from gas species is considered, then the CFD model considerably overestimates the experimental data at downstream locations. A better agreement with the experimental data is achieved when the emission of radiation from particles is included. These results suggest that thermal losses due to radiation from particles have a non-trivial effect on the evolution of the temperature field.
6.2. Comparison with experimental SAXS data
Comparisons of numerical predictions with the experimental SAXS data of Camenzind et al. (Citation2008) will now be shown. In SAXS measurements, a monochromatic X-ray beam penetrates the flame and is collected on a SAXS detector located a few meters away from the flame. However, particle quantities cannot be uniform in the radial direction in the vicinity of the burner tip where reactants are not mixed. As discussed earlier, the flame reaction zone, where particles are formed, is located slightly off the centerline. The experimental particle data refer to the thin flame zone where the scattered intensity (relevant to SAXS measurements) should be maximum. This was also discussed in Sztucki, Narayanan, and Beaucage (Citation2007) where it was found that the maximum scattered intensity was achieved when the X-ray beam penetrated the flame in the soot growth zone located slightly off the centerline of the flame. For this reason, we present data along the pathline of maximum silica volume faction, accounting also for the radius of the beam 0.1 mm. It should also be mentioned that the smallest detectable particle size by the SAXS measurements was 1 nm, and this was taken into account in the post-processing of the simulation results by not accounting for particles smaller than that when averaging the PSD.
The average primary particle diameter, the average aggregate radius of gyration,
the number concentration of primary particles,
and the average number of primary particles per aggregate,
along the pathline of maximum silica volume fraction are shown in , respectively. The plots show the results from the three PBE models and the measurements. Focusing initially on the results obtained with the more comprehensive two-PBE model, we can see that good agreement with experiments is found for primary particle diameters. In particular, the model predicts relatively well
at low HABs while overestimating by about 15% the experimental data at downstream locations (HAB
cm). This indicates that aggregation and sintering are represented well by the model. Furthermore, fair agreement can be observed for
and
In particular, the model overestimates
(by about 43% at HAB
cm), most likely due to uncertainties involved in the precursor decomposition kinetics/nucleation model and the questionable validity of EquationEquation (5)
(5)
(5) at the first stages of particle synthesis. Furthermore,
is overestimated, and this is consistent with the overprediction of
discussed below.
Figure 6. Comparison of the experimental SAXS data of Camenzind et al. (Citation2008) with numerical predictions for (a) primary particle diameter, (b) radius of gyration of aggregates, (c) primary particle number concentration and (d) average number of primary particles per aggregate along the pathline of maximum silica volume fraction. Results were obtained with the two-PBE, the extended one-PBE, and the monodisperse model (described in Section 2).
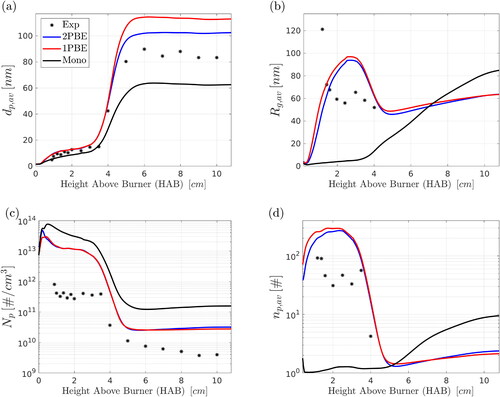
Numerical predictions for are in qualitative agreement with the SAXS data. However, the particle formation rate is overpredicted, leading to an overestimation of
by approximately 1.5 orders of magnitude (). This discrepancy is most likely related to uncertainties involved in the SAXS measurements, precursor decomposition kinetics and the nucleation model. Regarding the precursor decomposition/oxidation reaction mechanism in particular, data obtained with low-pressure flames and low HMDSO concentrations were employed for the development of the two-step chemical reaction mechanism of Feroughi et al. (Citation2017), while the flame examined here was at atmospheric pressure and the precursor concentration was relatively high. Nevertheless, it should be mentioned that the good agreement with primary particle diameter is more important, as this quantity is of more practical interest.
Aggregates are formed at low HABs where takes values close to 200, while compact - almost spherical - particles are formed at downstream locations where
declines quickly and reaches values close to 3 (). The reduction of
is also observed in the SAXS data at HAB
cm. Experimental data for downstream locations are unavailable, but the model suggests that the residence time of particles at high temperatures (i.e., at
HAB
cm) is large enough for almost complete coalescence of aggregates, leading to compact structures at HAB
cm. This can also be seen in by comparing the values of
and
in the two-PBE model predictions at downstream locations; twice
is only slightly greater than
Results obtained with the extended one-PBE and the monodisperse model is also presented in . Overall, good agreement was found between the two-PBE and the extended one-PBE models. Specifically, the extended one-PBE model somewhat overestimated primary particle sizes at downstream locations (by about 35% relative to the SAXS data and by about 10% relative to the two-PBE results at HAB cm), while excellent agreement was found between the two models for the rest of the particle quantities. On the other hand, the monodisperse model underestimates
() (by about 26% relative to the SAXS data and by about 39% relative to the two-PBE results at HAB
cm). Furthermore, the monodisperse model underestimates
() and
(), at the early stages of particle synthesis, i.e., at HAB
cm, while the two-PBE and the extended one-PBE models describe the evolution of particle morphology in a more accurate manner (both quantitatively and qualitatively).
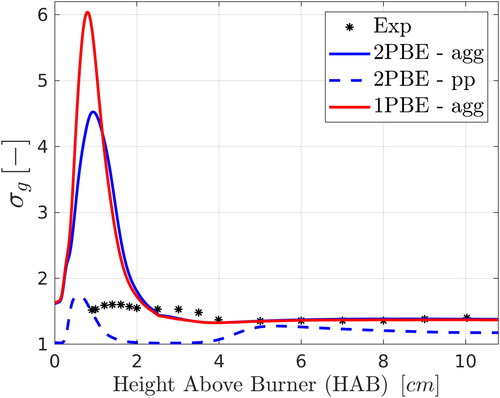
Measurements are also available for the geometric standard deviation, of the primary particle size distribution. This quantity can be predicted only by the two-PBE model. However, as explained earlier, aggregates at downstream locations are quite compact and comprise only a few primary particles, most likely connected by sinter bonds; thus, they would be difficult to distinguish by SAXS measurements. It is therefore worth comparing with predictions of
for both primary particles and aggregates. shows the measurements and the predictions by the two-PBE (for both primary particles and aggregates) and the one-PBE (for aggregates only) models; results with the monodisperse model are not included since
in that case is unity by definition. It can be seen that better agreement is found when comparing with the simulation results for aggregates than for primary particles. In particular, the figure shows good agreement between the numerical predictions of
for aggregates with the SAXS data (approximately 1.4% relative difference at HAB
cm) at downstream locations where aggregation is the dominant mechanism and the PSD attains the self-preserving distribution (the
for aggregates approaches an asymptotic value of approximately 1.38). The two-PBE and one-PBE models are in good agreement with each other except at low HABs, where both overpredict the SAXS data. At that stage, nucleation, condensation and aggregation take place simultaneously and the PSD is far from the self-preserving state. The disagreement can be partly explained by the fact that
was estimated from SAXS measurements based on the measured polydispersity index and assuming a lognormal particle size distribution of spherical primary particles (Kammler et al. Citation2005), while at these HABs the PSD was far from lognormal.
Figure 7. Comparison of the experimental SAXS data of Camenzind et al. (Citation2008) with numerical predictions for the geometric standard deviation of aggregate (agg) and primary particle (pp) size distributions along the pathline of maximum silica volume fraction.
6.3. Timescale analysis
The coupling of CFD with population balance allows the calculation of the timescales of different processes at all points in the domain, which can provide further insight on the results presented so far and furthermore help identify the dominant mechanisms. Timescales are defined for nucleation, aggregation and sintering in a consistent way and summarized in ; in all cases, the total number of particles (primary or aggregates, depending on the process) is divided by the rate of the process (or its absolute value when needed). We also define a flow timescale as the residence time, of particles along the pathline of maximum silica volume fraction.
Table 5. Definition of timescales for processes encountered in silica flame synthesis.
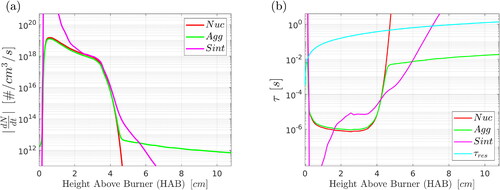
Results for the nucleation, aggregation and sintering rates along the pathline of maximum silica volume fraction are presented in , while results for the timescales are depicted in . The value of is quite constant at HAB
cm, while it starts to drop at downstream locations (). At low HABs, the flame front is positioned slightly off the centerline and particles are constantly formed within the flame reaction zone. Nucleation and aggregation rates reach comparable values () within this zone, resulting in constant primary particle number concentrations in this region () and relatively small average primary particle sizes (). On the other hand, after the flame front on the centerline (HAB
cm), precursor conversion is almost complete; the nucleation rate decreases by several orders of magnitude and sintering of particles becomes the dominant mechanism. This is demonstrated by , where it can be seen that the sintering rate is higher than the nucleation and aggregation rates at
HAB
cm. In terms of timescales, the sintering timescale is smaller than (or comparable to) the nucleation and aggregation timescales at
HAB
cm (), indicating that the effect of sintering is more profound in this region. This explains the reduction of
and the apparent growth of the average primary particle sizes () at these HABs. At HAB
cm, the temperature decreases, attenuating the effect of sintering and resulting in constant
values. Aggregation becomes the dominant mechanism at HAB
cm (see the intersection of the lines in ). The sintering timescale becomes greater than the residence time of particles in the flow at HAB
cm, indicating that the effect of sintering is negligible in that region.
Figure 8. Rates (absolute values) of kinetic processes (a) and timescales (b) along the pathline of maximum silica volume fraction. Results were obtained with the two-PBE model. Note that, for the sintering process in (a), the rate refers to the number concentration of primary particles,
6.4. Investigation of alternative model choices
6.4.1. Models for the characteristic sintering time
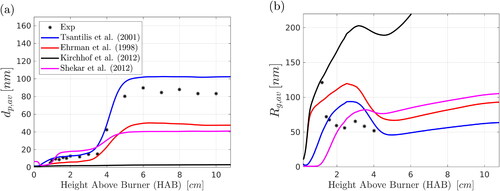
As explained in Section 4.4, the results shown so far were obtained with the Tsantilis, Briesen, and Pratsinis (Citation2001) expression for the characteristic sintering time, Simulations were also performed with the other models shown in , and the results for
and
are shown in . The model of Ehrman, Friedlander, and Zachariah (Citation1998) predicts greater sintering times (smaller coalescence rates) compared to that of Tsantilis, Briesen, and Pratsinis (Citation2001), leading to an underestimation of
for all HABs. The experimentally derived expression of Kirchhof et al. (Citation2012) fails to capture the coalescence of the nucleus-size nanoparticles (it must be noted that particle diameters larger than 10 nm were considered by Kirchhof et al., Citation2012) and thus does not predict well the particle morphology. Shekar et al. (Citation2012) proposed an expression where the sintering parameters were acquired by fitting their model to the experimental data of Seto et al. (Citation1997). The resulting sintering time leads to an overestimation of
at low HABs and an underestimation of
at large HABs. The use of the expression of Tsantilis, Briesen, and Pratsinis (Citation2001) slightly overpredicts
at the downstream locations. The model of Tsantilis, Briesen, and Pratsinis (Citation2001) accounts for the particle-size dependence of the melting point of silica and the parameter
m () was proposed as a first approximation. Overall, results obtained with the
of Tsantilis, Briesen, and Pratsinis (Citation2001) are in better agreement with the experimental data compared to the other
cases, at least for the flame conditions examined in the present study. Regarding
the sintering models predict similar trends and slightly overestimate the SAXS data, with the exception of the Kirchhof et al. (Citation2012) model, which yields a greater overprediction.
Figure 9. Effect of sintering time on (a) primary particle diameter, (b) aggregate radius of gyration. Results were obtained with the two-PBE model. Comparison is also made with the experimental data of Camenzind et al. (Citation2008).
6.4.2. Nucleation models
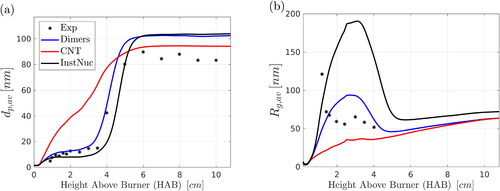
The reliable prediction of particle nucleation rates remains an unresolved problem in the field of flame synthesis of nanomaterials (Rosner Citation2005). In the present section, we investigate some alternatives to the approach described in Section 4.2 and used to obtain the results presented so far.
It is customary in flame-synthesis studies to assume that fast precursor oxidation leads to silica monomers (molecules) that serve as the first primary particles (Ulrich Citation1971). This approach will be referred to here as the instantaneous nucleation assumption. The reasoning behind this approach is that monomer vapor is usually in a supersaturated state, the nucleation barriers can be neglected (Xiong and Pratsinis Citation1991) and, even if the critical clusters (nuclei) comprise few molecules, coagulation quickly extinguishes initial differences (Gröhn et al. Citation2011; Tsantilis, Kammler, and Pratsinis Citation2002). Theoretical tools to describe nucleation rate have also been developed, with the most celebrated one being the classical nucleation theory, a discussion of which can be found, for example, in Ford (Citation2004). Here, we compare instantaneous nucleation, the classical nucleation theory as formulated by Girshick and Chiu (Citation1989) and the dimers-based approach that was discussed in Section 4 and used for the results presented in Section 6. Results obtained with the three nucleation models for and
along the pathline of maximum silica volume fraction are presented in , respectively. The classical theory overestimates
at low HABs, while the instantaneous model overestimates
at low HABs. The dimers-based approach seems to describe better the evolution of the particle morphology; however, all models predict similar particle sizes at downstream locations.
Figure 10. Effect of nucleation model on (a) primary particle diameter and (b) aggregate radius of gyration. Three models are compared: instantaneous nucleation (InstNuc), classical nucleation theory (CNT) and the dimers-based approach that was used for the rest of the results. Results were obtained with the two-PBE model. Comparison is also made with the experimental data of Camenzind et al. (Citation2008).
6.5. Analysis of computational performance
The total CPU time per timestep for simulating all processes (including flow field, scalar convection/diffusion, gas phase reaction, and PBE solution) for each of the three models is presented in and it can be seen that the simulation with the one-PBE model requires about a third of the CPU time spent on the two-PBE model. Remarkably, it is even comparable with the time required by the monodisperse model (less than twice). This difference is much greater than suggested by the number of equations in each model (116 for the two-PBE compared with 61 equations for the extended one-PBE) and is explained by the fact that the Discretization of the particle volume domain in the one-PBE model allows for the tabulation of the aggregation kernel. On the other hand, tabulation of the aggregation kernel for the two-PBE was not employed because it would be very memory-intensive; in particular, tabulation of the kernel in the one-PBE requires storing a three-dimensional matrix (for two volumes and ) since, at one time instant,
is the same for all particle volume pairs, while the two-PBE requires a four-dimensional matrix since every section has a different
This discussion demonstrates that coupling CFD with population balance is computationally feasible, while the extended one-PBE model is a major step forward in terms of balancing accuracy and computational speed. It should be emphasized that, while this reduction in CPU time is not essential for the simulation of the present laminar flame as the total CPU time is manageable with all approaches, the advantages offered by the extended one-PBE model will be crucial when it comes to the coupling of detailed population balance modeling with LES for the simulation of turbulent flame synthesis.
Table 6. Comparison of PBE models for describing aerosol dynamics and particle morphology.
7. Conclusions
In the present work, the synthesis of silica nanoparticles in a laminar diffusion flame was studied via population balance modeling coupled with CFD. Three population balance models were investigated: a monodisperse model, a detailed two-PBE model and an extended one-PBE model. The last of these constitutes a new development and is an augmentation of the basic PBE with a finite-rate sintering expression, while an additional transport equation is solved for the total number of primary particles. The extended one-PBE model can predict the evolution of particle morphology while reducing substantially the computational cost as compared with the two-PBE model.
The models were coupled with an in-house CFD code in order to conduct two-dimensional simulations of silica synthesis via oxidation of HMDSO in a laminar diffusion jet flame. The methodology was validated against the experimental in-situ SAXS data of Camenzind et al. (Citation2008). Results with all models were in excellent agreement with the experimental data for the temperature. Thermal losses due to radiation from particles were found to have a non-trivial effect on the evolution of the temperature field. The predictions by the two-PBE and extended one-PBE model for primary particle sizes were in good agreement with the SAXS data indicating that aggregation and sintering were described relatively well, while the models slightly overestimated the aggregate sizes and the number of primary particles per aggregate. By contrast, the monodisperse model did not capture particle morphology at the early stages of the synthesis. The particle formation rate was overpredicted by all models, leading to an overestimation of the number concentration of primary particles. This discrepancy is most likely due to uncertainties in the experimental data, precursor decomposition kinetics and the nucleation model. The coupling of CFD and PBE also allowed the calculation of the rates and timescales of all processes along the domain. This analysis shed light on the mechanisms underlying the evolution of particle properties and the dominant mechanisms at different spatial locations. An investigation of alternative nucleation and sintering models was also conducted and the analysis showed that, overall, results obtained with the dimers-based nucleation model and the sintering characteristic time of Tsantilis, Briesen, and Pratsinis (Citation2001) were in better agreement with the experimental data compared to those obtained with the other models.
The one-PBE model yielded results close to those of the two-PBE model at a substantially reduced computational cost, indicating that it provides a good balance of physical detail and speed. Most importantly, the time taken for the CFD-PBE simulation with the one-PBE model was less than twice the time needed for the CFD-monodisperse model, while the former provided a much better description of the evolution of particle morphology. The superior speed of the one-PBE model was largely owing to the tabulation of the aggregation kernel.
Overall, the results showed that the coupling of CFD and detailed PBE is capable of describing the evolution of particle properties during silica flame synthesis. The computational advantage offered by the extended one-PBE model paves the way for its coupling with LES and the comprehensive simulation of aerosol synthesis in turbulent flames, which will be the objective of future work.
Supplemental Material
Download PDF (954.8 KB)Acknowledgments
The authors gratefully acknowledge Prof. Sotiris E. Pratsinis for his help on the interpretation of the experimental results of Camenzind et al. (Citation2008) and for insightful discussions on silica synthesis, as well as Dr Eirini Goudeli for her help on the validation of the monodisperse model.
Disclosure statement
The authors report no conflict of interest.
Additional information
Funding
Notes
1 Chemical species are denoted with the subscript and no summation is implied by repeated Greek subscripts.
2 Unlike J in EquationEquations (6)–(8), B is a source of particle number density rather than particle number.
3 Camenzind et al. (Citation2008) used the notation “S-y” to refer to a series of SiO2-producing flames with different O2 flow rates, y [l/min].
References
- Ball, R. C., and R. Jullien. 1984. Finite size effects in cluster-cluster aggregation. J. Phyique Lett. 45 (21):1031–5. doi:10.1051/jphyslet:0198400450210103100.
- Barlow, R. S., A. N. Karpetis, J. H. Frank, and J. Y. Chen. 2001. Scalar profiles and NO formation in laminar opposed-flow partially premixed methane/air flames. Combust. Flame. 127 (3):2102–18. doi:10.1016/S0010-2180(01)00313-3.
- Buddhiraju, V. S., and V. Runkana. 2012. Simulation of nanoparticle synthesis in an aerosol flame reactor using a coupled flame dynamics–monodisperse population balance model. J. Aerosol Sci. 43 (1):1–13. doi:10.1016/j.jaerosci.2011.08.007.
- Buesser, B., and A. J. Gröhn. 2012. Multiscale aspects of modeling gas-phase nanoparticle synthesis. Chem. Eng. Technol. 35 (7):1133–43. doi:10.1002/ceat.201100723.
- Buesser, B., and S. E. Pratsinis. 2012. Design of nanomaterial synthesis by aerosol processes. Annu. Rev. Chem. Biomol. Eng. 3:103–27.
- Camenzind, H., A. Schulz, G. Teleki, T. Beaucage, S. Narayanan, and E. Pratsinis. 2008. Nanostructure evolution: from aggregated to spherical SiO2 particles made in diffusion flames. Eur. J. Inorg. Chem. 2008 (6):911–8. doi:10.1002/ejic.200701080.
- Chang H. and P. Biswas. 1992. In situ light scattering dissymmetry measurements of the evolution of the aerosol size distribution in flames. J. Colloid Interface Sci. 153 (1):157–66.
- Cho, J., and M. Choi. 2000. Determination of number density, size and morphology of aggregates in coflow diffusion flames using light scattering and local sampling. J. Aerosol Sci. 31 (9):1077–95. doi:10.1016/S0021-8502(99)00574-1.
- Choi, M., J. Cho, J. Lee, and H. W. Kim. 1999. Measurements of silica aggregate particle growth using light scattering and thermophoretic sampling in a coflow diffusion flame. J. Nanopart. Res. 1 (2):169–83. doi:10.1023/A:1010092113802.
- Chung, S.-L., Y.-C. Sheu, and M.-S. Tsai. 1992. Formation of SiO2, Al2O3, and 3Al2O3 ·2SiO2 particles in a counterflow diffusion flame. J. Amer. Ceram. Soc. 75 (1):117–23.
- Dasgupta, D., P. Pal, R. Torelli, S. Som, N. Paulson, J. Libera, and M. Stan. 2022. Computational fluid dynamics modeling and analysis of silica nanoparticle synthesis in a flame spray pyrolysis reactor. Combust. Flame. 236:111789. doi:10.1016/j.combustflame.2021.111789.
- Ehrman, S. H. 1999. Effect of particle size on rate of coalescence of silica nanoparticles. J Colloid Interface Sci. 213 (1):258–61.
- Ehrman, S. H., S. K. Friedlander, and M. R. Zachariah. 1998. Characteristics of SiO2/TiO2 nanocomposite particles formed in a premixed flat flame. J. Aerosol Sci. 29 (5–6):687–706. doi:10.1016/S0021-8502(97)00454-0.
- Feroughi, O. M., L. Deng, S. Kluge, T. Dreier, H. Wiggers, I. Wlokas, and C. Schulz. 2017. Experimental and numerical study of a HMDSO-seeded premixed laminar low-pressure flame for SiO2 nanoparticle synthesis. Proc. Combust. Inst. 36 (1):1045–53. doi:10.1016/j.proci.2016.07.131.
- Ford, J. 2004. Statistical mechanics of nucleation: A review. Proceedings Institution Mech. Engineer, Part C: J. Mech. Engng. Sci. 218 (8):883–99.
- Frenkel. 1945. Viscous flow of crystalline bodies under the action of surface tension. J. Phys. 9 (385).
- Frenklach, M., H. Wang, M. Goldenberg, G. P. Smith, and D. M. Golden. GRI-MECH: An optimized detailed chemical reaction mechanism for methane combustion. Topical report, September 1992-August 1995. Technical report, SRI International, Menlo Park, CA (United States), 1995.
- Friedlander, S. K. 2000. Smoke, dust, and haze: Fundamentals of aerosol dynamics. 2nd ed. Oxford: Oxford University Press.
- Girshick, S. L., and C. P. Chiu. 1989. Homogeneous nucleation of particles from the vapor phase in thermal plasma synthesis. Plasma Chem. Plasma Process. 9 (3):355–69. doi:10.1007/BF01083672.
- Goudeli, E., M. L. Eggersdorfer, and S. E. Pratsinis. 2015. Aggregate characteristics accounting for the evolving fractal-like structure during coagulation and sintering. J. Aerosol Sci. 89:58–68. doi:10.1016/j.jaerosci.2015.06.008.
- Griffiths, P. R., and J. A. De Haseth. 2007. Fourier transform infrared spectrometry. Hoboken, NJ: John Wiley & Sons.
- Gröhn, J., B. Buesser, J. K. Jokiniemi, and S. E. Pratsinis. 2011. Design of turbulent flame aerosol reactors by mixing-limited fluid dynamics. Ind. Eng. Chem. Res. 50 (6):3159–68. doi:10.1021/ie1017817.
- Grosshandler, W. L. 1993. Radcal: a narrow band model for radiation. Calculations in a Combustion Environment, NIST Technical Note, 1402.
- Heinson, W. R., C. M. Sorensen, and A. Chakrabarti. 2010. Does shape anisotropy control the fractal dimension in diffusion-limited cluster-cluster aggregation? Aerosol Sci. Tech. 44 (12):i–iv. doi:10.1080/02786826.2010.516032.
- Hirschfelder, J. O., C. F. Curtiss, and R. B. Bird. 1955. Molecular theory of gases and liquids. Phys. today 8 (3):17. doi:10.1063/1.3061949.
- Iyer, S. S., T. A. Litzinger, S. Y. Lee, and R. J. Santoro. 2007. Determination of soot scattering coefficient from extinction and three-angle scattering in a laminar diffusion flame. Combust. Flame. 149 (1–2):206–16. doi:10.1016/j.combustflame.2006.11.009.
- Jang, H. D. 2001. Experimental study of synthesis of silica nanoparticles by a bench-scale diffusion flame reactor. Powder Technol. 119 (2–3):102–8. doi:10.1016/S0032-5910(00)00407-1.
- Ji, Y., H. Y. Sohn, H. D. Jang, B. Wan, and T. A. Ring. 2007. Computational fluid dynamic modeling of a flame reaction process for silica nanopowder synthesis from tetraethylorthosilicate. J American Ceramic Society. 0 (0):071019062949004–??? doi:10.1111/j.1551-2916.2007.02080.x.
- Kammler, H. K., G. Beaucage, D. J. Kohls, N. Agashe, and J. Ilavsky. 2005. Monitoring simultaneously the growth of nanoparticles and aggregates by in situ ultra-small-angle x-ray scattering. J. Appl. Phys. 97 (5):054309. doi:10.1063/1.1855391.
- Kammler, H. K., S. E. Pratsinis, P. W. Morrison, Jr., and B. Hemmerling. 2002. Flame temperature measurements during electrically assisted aerosol synthesis of nanoparticles. Combust. Flame. 128 (4):369–81. doi:10.1016/S0010-2180(01)00357-1.
- Kennedy, M., and S. J. Harris. 1990. Enhancement of silica aerosol coagulation by van der Waals forces. Aerosol Sci. Tech. 12 (4):869–75. doi:10.1080/02786829008959399.
- Kim, H. J., J. I. Jeong, Y. Park, Y. Yoon, and M. Choi. 2003. Modeling of generation and growth of non-spherical nanoparticles in a co-flow flame. J. Nanopart. Res. 5 (3/4):237–46. doi:10.1023/A:1025570125689.
- Kim, H. W., and M. Choi. 2003. In situ line measurement of mean aggregate size and fractal dimension along the flame axis by planar laser light scattering. J. Aerosol Sci. 34 (12):1633–45. doi:10.1016/S0021-8502(03)00358-6.
- Kim, S., and S. E. Pratsinis. 1988. Manufacture of optical waveguide preforms by modified chemical vapor deposition. AIChE J 34 (6):912–21. doi:10.1002/aic.690340603.
- Kim, S., and S. E. Pratsinis. 1989. Modeling and analysis of modified chemical vapor deposition of optical fiber preforms. Chem. Eng. Sci. 44 (11):2475–82. doi:10.1016/0009-2509(89)85191-7.
- Kirchhof, J., H. Förster, H. J. Schmid, and W. Peukert. 2012. Sintering kinetics and mechanism of vitreous nanoparticles. J. Aerosol Sci. 45:26–39. doi:10.1016/j.jaerosci.2011.10.006.
- Koch, W., and S. K. Friedlander. 1990. The effect of particle coalescence on the surface area of a coagulating aerosol. J. Colloid Interface Sci. 140 (2):419–27. doi:10.1016/0021-9797(90)90362-R.
- Kruis, F. E., K. A. Kusters, S. E. Pratsinis, and B. Scarlett. 1993. A simple model for the evolution of the characteristics of aggregate particles undergoing coagulation and sintering. Aerosol Sci. Tech. 19 (4):514–26. doi:10.1080/02786829308959656.
- Lee, B. W., S. Oh, and M. Choi. 2001. Simulation of growth of nonspherical silica nanoparticles in a premixed flat flame. Aerosol Sci. Tech. 35 (6):978–89. doi:10.1080/027868201753306741.
- Lee, J. 2011. Estimation of emission properties for silica particles using thermal radiation spectroscopy. Appl. Opt. 50 (22):4262–7.
- Liu, A., and S. Rigopoulos. 2019. A conservative method for numerical solution of the population balance equation, and application to soot formation. Combust. Flame. 205:506–21. doi:10.1016/j.combustflame.2019.04.019.
- Mathur, S., and S. C. Saxena. 1967. Methods of calculating thermal conductivity of binary mixtures involving polyatomic gases. Appl. Sci. Res. 17 (2):155–68. doi:10.1007/BF00419783.
- Meierhofer, F., and U. Fritsching. 2021. Synthesis of metal oxide nanoparticles in flame sprays: review on process technology, modeling, and diagnostics. Energy Fuel. 35 (7):5495–537. doi:10.1021/acs.energyfuels.0c04054.
- Modest, F. 2003. Radiative Heat Transfer. Academic Press: Cambridge MA, USA, 2nd edition,
- Morrison, P. W., Jr., R. Raghavan, A. J. Timpone, C. P. Artelt, and S. E. Pratsinis. 1997. In situ fourier transform infrared characterization of the effect of electrical fields on the flame synthesis of TiO2 particles. Chem. Mater. 9 (12):2702–8. doi:10.1021/cm960508u.
- Netzell, K., H. Lehtiniemi, and F. Mauss. 2007. Calculating the soot particle size distribution function in turbulent diffusion flames using a sectional method. Proc. Combust. Inst. 31 (1):667–74. doi:10.1016/j.proci.2006.08.081.
- Neuber, G., C. E. Garcia, A. Kronenburg, B. A. Williams, F. Beyrau, O. T. Stein, and M. J. Cleary. 2019. Joint experimental and numerical study of silica particulate synthesis in a turbulent reacting jet. Proc. Combust. Inst. 37 (1):1213–20. doi:10.1016/j.proci.2018.06.074.
- Olivas-Martinez, M., H. Y. Sohn, H. D. Jang, and K.-I. Rhee. 2015. Computational fluid dynamic modeling of the flame spray pyrolysis process for silica nanopowder synthesis. J. Nanopart Res. 17 (7):324. doi:10.1007/s11051-015-3109-z.
- Park, H. K., and K. Y. Park. 2015. Control of particle morphology and size in vapor-phase synthesis of titania, silica and alumina nanoparticles. KONA 32 (0):85–101. doi:10.14356/kona.2015018.
- Poinsot, T., and D. Veynante. 2005. Theoretical and numerical combustion. Morningside, Australia: RT Edwards, Inc.,
- Pratsinis, S. E. 1988. Simultaneous nucleation, condensation, and coagulation in aerosol reactors. J. Colloid Interface Sci. 124 (2):416–27. doi:10.1016/0021-9797(88)90180-4.
- Pratsinis, S. E., and K.-S. Kim. 1989. Particle coagulation, diffusion and thermophoresis in laminar tube flows. J. Aerosol Sci. 20 (1):101–11. doi:10.1016/0021-8502(89)90034-7.
- Raman, V., and R. O. Fox. 2016. Modeling of fine-particle formation in turbulent flames. Annu. Rev. Fluid Mech. 48 (1):159–90. doi:10.1146/annurev-fluid-122414-034306.
- Rigopoulos, S. 2007. PDF method for population balance in turbulent reactive flow. Chem. Eng. Sci. 62 (23):6865–78. doi:10.1016/j.ces.2007.05.039.
- Rigopoulos, S. 2010. Population balance modelling of polydispersed particles in reactive flows. Prog. Energy Combust. Sci. 36 (4):412–43. doi:10.1016/j.pecs.2009.12.001.
- Rittler, L., I. Deng, A. Wlokas, and M. Kempf. 2017. Large eddy simulations of nanoparticle synthesis from flame spray pyrolysis. Proc. Combust. Inst. 36 (1):1077–87. doi:10.1016/j.proci.2016.08.005.
- Rodrigues, P., B. Franzelli, R. Vicquelin, O. Gicquel, and N. Darabiha. 2018. Coupling an LES approach and a soot sectional model for the study of sooting turbulent non-premixed flames. Combust. Flame 190:477–99. doi:10.1016/j.combustflame.2017.12.009.
- Rogak, S. N. 1997. Modeling small cluster deposition on the primary particles of aerosol agglomerates. Aerosol Sci. Technol. 26 (2):127–40. doi:10.1080/02786829708965419.
- Rosner, D. E. 2005. Flame synthesis of valuable nanoparticles: Recent progress/current needs in areas of rate laws, population dynamics, and characterization. Ind. Eng. Chem. Res. 44 (16):6045–55. doi:10.1021/ie0492092.
- Scheckman, J. H., P. H. McMurry, and S. E. Pratsinis. 2009. Rapid characterization of agglomerate aerosols by in situ mass- mobility measurements. Langmuir. 25 (14):8248–54. doi:10.1021/la900441e.
- Seto, T., A. Hirota, T. Fujimoto, M. Shimada, and K. Okuyama. 1997. Sintering of polydisperse nanometer-sized agglomerates. Aerosol Sci. Tech. 27 (3):422–38. doi:10.1080/02786829708965482.
- Shekar, S., A. J. Smith, W. J. Menz, M. Sander, and M. Kraft. 2012. A multidimensional population balance model to describe the aerosol synthesis of silica nanoparticles. J. Aerosol Sci. 44:83–98. doi:10.1016/j.jaerosci.2011.09.004.
- Sun, B., and S. Rigopoulos. 2022. Modelling of soot formation and aggregation in turbulent flows with the LES-PBE-PDF approach and a conservative sectional method. Combust. Flame. 242:112152. doi:10.1016/j.combustflame.2022.112152.
- Sun, B., S. Rigopoulos, and A. Liu. 2021. Modelling of soot coalescence and aggregation with a two-population balance equation model and a conservative finite volume method. Combust. Flame 229:111382. doi:10.1016/j.combustflame.2021.02.028.
- Sztucki, M., T. Narayanan, and G. Beaucage. 2007. In situ study of aggregation of soot particles in an acetylene flame by small-angle x-ray scattering. J. Appl. Phys. 101 (11):114304. doi:10.1063/1.2740341.
- Tsagkaridis, M., S. Rigopoulos, and G. Papadakis. 2022. Analysis of turbulent coagulation in a jet with discretised population balance and DNS. J. Fluid Mech. 937 (A25) doi:10.1017/jfm.2022.57.
- Tsantilis, S., and S. E. Pratsinis. 2000. Evolution of primary and aggregate particle-size distributions by coagulation and sintering. AIChE J. 46 (2):407–15. doi:10.1002/aic.690460218.
- Tsantilis, S., H. Briesen, and S. E. Pratsinis. 2001. Sintering time for silica particle growth. Aerosol Sci. Tech. 34 (3):237–46. doi:10.1080/02786820119149.
- Tsantilis, S., H. K. Kammler, and S. E. Pratsinis. 2002. Population balance modeling of flame synthesis of titania nanoparticles. Chem. Eng. Sci. 57 (12):2139–56. doi:10.1016/S0009-2509(02)00107-0.
- Ulrich, G. D. 1971. Theory of particle formation and growth in oxide synthesis flames. Combust. Sci. Technol. 4 (1):47–57. doi:10.1080/00102207108952471.
- Ulrich, G. D., and J. W. Rieh. 1982. Aggregation and growth of submicron oxide particles in flames. J. Colloid Interface Sci. 87 (1):257–65. doi:10.1016/0021-9797(82)90387-3.
- Vo, S., A. Kronenburg, O. T. Stein, and M. J. Cleary. 2017. Multiple mapping conditioning for silica nanoparticle nucleation in turbulent flows. Proc. Combust. Inst. 36 (1):1089–97. doi:10.1016/j.proci.2016.08.088.
- Wegner, K., and S. E. Pratsinis. 2003a. Nozzle-quenching process for controlled flame synthesis of titania nanoparticles. AIChE J. 49 (7):1667–75. doi:10.1002/aic.690490707.
- Wegner, K., and S. E. Pratsinis. 2003b. Scale-up of nanoparticle synthesis in diffusion flame reactors. Chem. Eng. Sci. 58 (20):4581–9. doi:10.1016/j.ces.2003.07.010.
- Wilke, C. R. 1950. A viscosity equation for gas mixtures. J. Chem. Phys. 18 (4):517–9. doi:10.1063/1.1747673.
- Willeke, K. 1976. Temperature dependence of particle slip in a gaseous medium. J. Aerosol Sci. 7 (5):381–7. doi:10.1016/0021-8502(76)90024-0.
- Xiong, Y., and S. E. Pratsinis. 1991. Gas phase production of particles in reactive turbulent flows. J. Aerosol Sci. 22 (5):637–55. doi:10.1016/0021-8502(91)90017-C.
- Xiong, Y., and S. E. Pratsinis. 1993. Formation of agglomerate particles by coagulation and sintering - Part I. A two-dimensional solution of the population balance equation. J. Aerosol Sci. 24 (3):283–300. doi:10.1016/0021-8502(93)90003-R.
- Zachariah, M. R., D. Chin, H. G. Semerjian, and J. L. Katz. 1989. Silica particle synthesis in a counterflow diffusion flame reactor. Combust. Flame. 78 (3-4):287–98. doi:10.1016/0010-2180(89)90018-7.