
 ?Mathematical formulae have been encoded as MathML and are displayed in this HTML version using MathJax in order to improve their display. Uncheck the box to turn MathJax off. This feature requires Javascript. Click on a formula to zoom.
Abstract
In 2011, the Euro 5b light-duty vehicle legislation introduced particle number (PN) limits for vehicle homologation. To measure PN concentrations, specific condensation particle counters (CPC) with a counting efficiency (CE) of 50% at 23 nm are required. The usage of such automotive CPCs will significantly increase with the upcoming legislation for PN measurements during periodic technical inspections, which comes along with the need for simple calibration methods for particle number counters using salt particles. In this work, we examined the counting characteristics of an automotive AVL 23 nm CPC with inorganic salt particles. We further investigated the usability of different atomized inorganic salt particles for calibration purposes focusing on CE and linearity. The CE varies greatly depending on the chemical salt composition: While NaI was fully activated down to 18 nm and linear over the full concentration range, the CE of other atomized salt solutions showed a strong concentration dependency with a d50 diameter ranging from 38.2 nm to 69.5 nm for atomized NaCl with increasing concentration. Such effects were not found for tube-furnace generated salt particles within similar concentration ranges. When a hot dilution was applied, the non-linear behavior was minimized and the CE overall increased, leading to a d50 of 27.3 nm for atomized NaCl. Based on those findings, we propose a simplified calibration method for automotive PN counters without the need for a differential mobility analyzer due to the high CE of atomized NaI particles.
EDITOR:
1. Introduction
Particulate matter emitted by internal combustion engine vehicles is one of the main sources of air pollution in urban areas and causes adverse health effects (Brook et al. Citation2010; Hooftman et al. Citation2018). As part of the Euro 5/6 norm, particle number (PN) limits for type-approval tests were introduced, resulting in significant reductions of PN levels in urban environment (Murzyn et al. Citation2021). Homologation measurements assess only a limited number of vehicles per type, require traceability according to ISO 17025 and are of high effort. An increasing number of countries have started to introduce mandatory PN measurements during periodical technical inspections, allowing continuous monitoring of the entire vehicle fleet. While requirements regarding accuracy and sensitivity are less stringent, the measurement instruments must be robust, affordable and usable in garages (Burtscher, Lutz, and Mayer Citation2019). Equally to counters for homologation measurements, calibration is required annually, but a simplified calibration procedure that allows for high-throughput calibration is still lacking.
With the Euro 5/6 emission standard, the United Nations Economic Commission for Europe introduced a solid particle number emission limit of km–1 for light-duty vehicle homologation in addition to already preexisting limits for particle mass based on research findings by the Particle Measurement Programme (Giechaskiel, Dilara, and Andersson Citation2008; Giechaskiel et al. Citation2008). Regulation No. 83 (R83) requires the sampling system to consist of a dilution tunnel, a sampling probe, and a volatile particle remover upstream of a particle number counter (Regulation 83, Citation2015). Although no measurement technology is mentioned in the R83, the specifications only allow the use of a condensation particle counter (CPC). Within the R83, the counting characteristics and calibration procedure requirements are specified. The CPC must operate in full flow mode and have a linear response over the entire counting range with a correlation coefficient of
with linear regression forced through the origin. In addition, the measurement uncertainty must be within
over the entire single-particle measurement range of the CPC.
The counting efficiency (CE) of the CPC must be and
for particles with an electrical mobility diameter of
nm and
nm, respectively. Calibration of the CPC must be performed annually, with the CE to be evaluated at 23 nm.
A detailed calibration procedure is not given in the R83. Instead, two methods are suggested: Calibration can be done directly with an aerosol electrometer or indirectly with a CPC, which has been calibrated directly with an electrometer while sampling the aerosol. In addition, a standard traceable calibration method, such as the ISO 27891 (Citation2015), which proposes a similar procedure as the R83, has to be used.
The d50 (often also called cutoff) of a CPC is the diameter, at which the CE is 50%. Since the primary use case of CPCs that have its d50 at 23 nm (also called 23 nm CPCs) are exhaust emission measurements, it would be suitable also to use combustion aerosol for calibration. The ISO 27891 acknowledges that different chemical compositions of the reference aerosol result in different CEs at the cutoff size region and also requires that the particle composition to be stated on the calibration certificate. However, in the R83, neither any calibration aerosol nor eventually associated impacts on the calibration results and the target application are mentioned. Therefore, for the right choice of a calibration aerosol, different aspects have to be considered, such as (i) correlation to diesel soot, (ii) stability of the aerosol generation process, (iii) reproducibility and repeatability of the calibration results, (iv) safety and health aspects, (v) process efficiency concerning costs, throughput times and maintenance, and (vi) the possibility for eventual calibration measurements in the field. The first of those aspects is best met by using a combustion engine-generated test aerosol. However, the stable generation of combustion aerosol, let alone diesel aerosol, with the required size distribution, concentration range, and long-term stability is not feasible in a laboratory setting. Furthermore, the composition of combustion diesel aerosol varies significantly with load (Cheng et al. Citation2015), driving cycle (Popovicheva et al. Citation2017), and engine type (Toner, Sodeman, and Prather Citation2006).
The miniCAST (Combustion Aerosol Standard) supplied by Jing is a diffusion flame generator commonly used to generate soot aerosol for laboratory applications. The flame is quenched with a mixing gas, enabling aerosol growth. Terres et al. (Citation2021) determined the CE of a reference 23 nm CPC at several laboratories across Europe using the same particle generator based on the miniCAST, resulting in different CEs ranging from < 20% to > 40%. Further studies found that automotive CPCs with a nominal 50% CE at 23 nm (determined via initial calibration with emery oil particles) show significantly lower CEs when measuring other particle materials, such as soot or NaCl. (Giechaskiel et al. Citation2009; Wang et al. Citation2010). The working fluid of the CPC can change the counting characteristics as well. Kulmala et al. (Citation2007) studied the influence of particle composition for butanol- and water-based CPCs. The CE was increased if the particle was soluble in the working fluid. Wlasits et al. (Citation2020) reported variations in CE for butanol-, water- and diethylene glycol-based CPCs depending on the particle composition. NaCl particles showed a reduced CE compared to other particle compositions with a butanol-based CPC.
In addition to PN measurements for vehicle type approval, tailpipe PN measurements within periodic technical inspections are introduced to monitor the particle emission conformity during the vehicles’ lifetime (BMDV. Citation2021). Large-scale fleet monitoring via periodical technical inspections requires a large number of PN instruments (about 35.000 only in Germany) that have to calibrated annually. This substantiates the need for a calibration process using stable, safe and easy-to-use test aerosols, such as atomized NaCl particles.
Atomization of inorganic salt solutions and subsequent evaporation of the solvent has been proven to be a reliable, flexible, and cheap technique for aerosol generation (Liu and Lee Citation1975). Stabile et al. (Citation2013) compared the particle size distribution (PSD) of several atomized solutions and obtained similar PSDs in terms of geometric mean diameter (GMD), geometric standard distribution (GSD), and total PN concentration for different soluble salts with the same molar concentrations. However, knowledge of the counting characteristics of atomized solutions and how they differ from other generation methods is still limited.
1.1. Scope of this work
The aforementioned studies investigated the influence of the aerosol composition on the counting characteristics of 23 nm automotive CPCs. With 23 nm CPCs increasingly used as a calibration reference for periodical technical inspection devices, a stable and linear response of the reference CPC is required. However, further research regarding the influence of the generation method on the CE is still required. In this context, we aim to answer several practically relevant questions in this work.
Firstly, we evaluated the influence of the generation method of inorganic salt particles on the CE. The evaporation-condensation method is a commonly used generation method which allows for variable control of the GMD, generates high concentrations ( cm–3), and produces narrow size distributions (
). Drawbacks, such as a lengthy heating period prior to use, the general bulkiness of the setup, high temperatures of the furnace, and generally finicky usage, render the setup unfeasible outside of laboratory applications. Contrary, the atomizer allows for a cheap and straightforward generation of soluble substances with lower PN concentrations and a narrower adjustment range regarding the GMD. Furthermore, these experiments also allowed for comparison with previously reported data (Giechaskiel et al. Citation2009; Wang et al. Citation2010) on NaCl particles generated with the evaporation-condensation method.
Secondly, the influence of different salt compositions on the CE was evaluated. Both generation methods allow for a change in the salt composition. Additionally to NaCl, which is commonly used for aerosol generation, we evaluated NaBr, NaF, and NaI. These experiments were conducted to possibly correlate the CE to the chemical composition.
Thirdly, the atomized particles were systematically evaluated for their use as a calibration aerosol. We investigated the robustness of the CE toward changes in the PN concentration and solute concentration within the atomizer. Previously unreported, non-linear behavior was then characterized by systematically changing the PN concentration. In addition, the effect of a hot dilution on the linearity and CE was investigated.
Based on the obtained results, we propose a simplified calibration method, which allows for calibration of the plateau efficiency of a 23 nm CPC without requiring a differential mobility analyzer (DMA).
2. Methods
2.1. Experimental setup
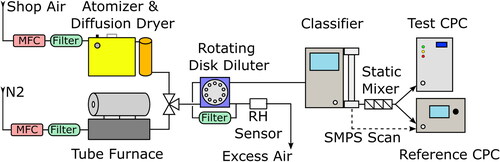
The experimental setup to determine the CE is shown in . We generated polydisperse salt particles by using an atomizer with a diffusion dryer or a tube furnace. Downstream of the aerosol generator, we used a rotating disk diluter that allowed for variation of the dilution rate (DR) and, therefore, the particle number concentration of the aerosol. The aerosol was then classified with respect to the electric mobility diameter by passing it through an X-ray neutralizer and a DMA. After classifying, the aerosol stream was passed through a static mixer and then split to the test and reference CPC to measure the CE of the former. We measured the PSD for each CE curve with the Scanning Mobility Particle Sizer (SMPS), which consists of the X-ray neutralizer, the DMA, and the reference CPC. We used conductive silicon tubing to minimize electrostatic losses. The CE was evaluated with a TSI 3775 CPC acting as a reference device, which has a CE of 100% for electrical mobility diameters larger than 18 nm for every of the considered test aerosols (Shi et al. Citation2005).
Figure 1. Experimental Setup to determine the CE with either atomized or furnace-generated aerosol. The flow of the aerosol-free gases was regulated with a mass flow controller. The aerosol was either generated with an atomizer or in a tube furnace before it entered the rotating disk diluter. The diluted aerosols then entered the DMA for classification and a static mixer before it was measured with a reference and test CPC. SMPS scans were also performed to evaluate the PSD.
2.2. Instrumentation
2.2.1. Aerosol generation
We used a Topas ATM 220 atomizer in combination with a Topas DDU570 diffusion dryer to generate atomized salt aerosols. The shop air provided a pressure of 3 bar, and a Vögtlin red-y GSC-C mass flow controller set the flow at 2.5 L min–1. A HEPA filter was used to remove preexisting particles. The Topas DDU 570 diffusion dryer was operated with silica gel and ensured a relative humidity below 20% downstream of the dryer. Ultra-pure water was processed in-house and used as a solvent for the salt solutions. In addition to NaCl (Honeywell, > 99.5% purity), which is commonly used for aerosol calibration procedures, we evaluated the CE for atomized NaF, NaBr, and NaI (all from Sigma Aldrich, > 99% purity solutions). Properties of the different salts are shown in . For each solution, molar concentrations of mol/l and
mol/l (equivalent to 0.5 wt% and 100 ppmw for NaCl) were used. These two concentrations are referred to as high and low concentrations from here on. We put each solution in an ultrasonic bath before use and cleaned the nozzle between each measurement. The atomizer was operated with ultra-pure water for several minutes before using a different solution.
Table 1. Table of salt properties.
In addition to atomization, we used the evaporation-condensation technique described by Scheibel and Porstendörfer (Citation1983) to generate NaCl and NaBr particles in a tube furnace (Carbolite MTF 12/38/250). A ceramic combustion boat containing a small amount of the respective salt was placed centrally in the tube furnace. The nitrogen flow through the quartz tube was controlled with the mass flow controller at 2 L min–1. The hot gas stream was then guided through a cooling loop, leading to supersaturation and nanoparticle generation by nucleation. Changing the temperature of the tube furnace allowed for a variation of the GMD, with higher temperatures leading to larger particles. The temperature of the tube furnace was set to 725C for NaCl and 600
C for NaBr for these measurements.
2.2.2. Dilution
The aerosol was diluted with a rotating disk diluter from an AVL particle counter. The diluter was originally designed to comply with PN regulation requirements according to the R83. The diluter had two channels, one for the undiluted aerosol and one for the particle-free gas (Bergmann and Pongratz Citation2009; Hueglin, Scherrer, and Burtscher Citation1997). A rotating disk, driven by a stepper motor with cylindrical cavities, allowed gas exchange between the two channels. The transfer rate, and thus the aerosol concentration in the dilute conduit, was directly proportional to the ratio between the frequency and the flow rate of the dilute gas path. The stepper motor allowed for continuous control of the rotating frequency.
The DR was kept between 1:5 and 1:250 for these experiments. The excess air was filtered with a HEPA filter and then reused as dilution air to maintain a constant gas and moisture composition regardless of the DR. The diluter was temperature controlled to 55C with the built-in heating cartridge to ensure stable temperature condition since it heats itself up depending on the rotation speed and hence the DR. We also performed measurements at a hot dilution stage, where the diluter was heated to 150 and 190
C.
2.2.3. Particle size selection
We used a TSI 3083 electrostatic classifier for particle size selection according to the electrical mobility diameter. The classifier consisted of a TSI 3088 X-ray neutralizer for charge conditioning and a TSI 3081 long DMA for the subsequent selection of the particle mobility diameter. The nominal flow rate through the DMA was 1.3 L min–1 (the sum of the CPCs’ flow rates of 1 and 0.3 L min–1). The sheath flow rate was set to 15 L min–1, ensuring a sheath-to-sample ratio of > 1:10. This results in a highly monodisperse particle distribution after size selection. The aerosol then passed a static mixer before entering the CPCs. An SMPS scan was performed for each solution and temperature setting. For these measurements, the TSI 3775 CPC was operated in the 1.5 L min–1 mode and the flow equalizer of the DMA was used to compensate for the additional flow of 0.2 L min–1 to keep a constant flow rate and residence time through the system. The additional dilution caused by the equalizer was accounted for, and the PN concentration shown in was recalculated.
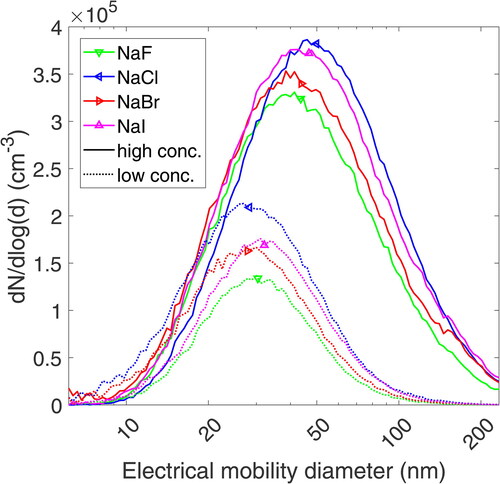
Figure 2. PSDs and their respective GMD indicated with squares of several atomized salt solutions. Each respective aerosol was diluted at a DR of 1:50 and a temperature of 55C. Two different molar salt concentrations were used.
2.2.4. Condensation particle counters
The CPC under test was an AVL 23 nm CPC (AVL List GmbH Citation2022). It operates at a flow rate of 1 L min–1 in full flow mode. The wick was replaced, and the CPC under test was factory calibrated at AVL according to ISO 17025 and ISO 27891 before the measurements.
The reference instrument used was a TSI 3775 CPC with a nominal CE of 0.5 for particles with an electrical mobility diameter of 4 nm. The CPC has a CE of > 0.9 for particles with a mobility diameter > 10 nm and fully counts particles above 18 nm (Shi et al. Citation2005). The CPC has two flow modes of 0.3 and 1.5 L min–1, the low flow mode was used for all measurements except for SMPS scans.
To confirm that the results are not manufacturer-related or caused by a faulty unit, validation experiments were conducted with a TSI 3790 CPC measuring in parallel. Similar to the AVL CPC, the TSI 3790 CPC has a d50 of 23 nm and is also approved for exhaust emission measurements.
2.3. Particle size distributions measurements
The PSD was scanned for each dilution level and temperature setting. To establish comparability between the CEs as a function of DR and concentration, it was necessary to ensure that the resulting PSDs were comparable for different salt solutions. This allowed for a subsequent investigation of the influence of the DR, temperature, and salt concentration on the CE.
2.4. Evaluation of the counting efficiency
As mentioned above, CPCs for automotive applications are typically characterized by two main quantities: (i) the counting efficiency and (ii) the linearity of the sensor response within the measuring range. The CE is defined as the number concentration of particles counted by the CPC divided by the actual number concentration. Particles larger than a typical d50 size are activated, and thus, counted. The CE denotes the fraction of particles activated by the CPC under test. The evaluation of CE can be performed either with an electrometer when sampling electrostatically classified aerosol or with a suitable CPC as a reference device. The characteristic CE as a function of the electrical mobility diameter can be fitted with a two-parameter model (Stolzenburg and Mcmurry Citation1991). Wang et al. (Citation2010) and Wiedensohler et al. (Citation2018) included a plateau efficiency parameter A to account for systematic over- or undercounting in the plateau region at large particle sizes:
(1)
(1) d0 denotes the lower detection limit of the CPC and d50 gives the diameter at which 50% of the particles are activated and counted. Formula 1 was used to evaluate the d50 diameter for various test aerosols and allow for comparison with previously conducted work.
We determined the CE of the test CPC for the low concentration regime at a 1:250 DR and low molar solute concentrations (equivalent to 100 ppmw for NaCl) for atomized NaF, NaCl, NaBr, and NaI. In addition, the CE of NaCl and NaBr aerosol generated in the tube furnace was evaluated at a DR of 1:250. The aerosol was diluted at a temperature of 55C.
We measured the CE of NaCl generated with the atomizer (low and high molar concentration) and the tube furnace. The CE at a DR of 1:5, 1:50, and 1:250 was evaluated. The PN concentration at a DR of 1:5 for tube furnace-generated particles exceeded the CPCs single count mode limits. Therefore no valid data could be obtained for these settings.
Measurements were performed at dilution temperatures of 55, 150, and 190C. The total volume of gas transported through the cavities increased with the temperature. The rotation speed of the diluter was not changed for higher temperatures to avoid a change in the residence time of the aerosol in the system.
2.4.1. Evaluation of the uncertainty
The measurement uncertainty was calculated according to The Guide to the expression of uncertainty in measurement (GUM) (JCGM. Citation2008). Uncertainty contributors were the reference CPC including the flow rate variation (± 10% according to the manual), the test CPC (± 5.6% according to the ISO 17025 calibration certificate), splitter bias correction factor (± 2%) and statistical variance (between ± 0.1% to 2% depending on the counted PN concentration). This leads to uncertainties of 13% − 14% of the measured CE. Uncertainties were not plotted to avoid overloading in the plots. Size distributions and CE measurements were repeated several times, daily variations of the CE for repeated measurements were typically within 5%. The sizing accuracy of the DMA is ± 1% at 100 nm according to the device manual.
2.5. Polydisperse measurement of the linearity and plateau counting efficiency
Based on the results in chapter 3.2, we evaluated the plateau efficiency parameter A and the linearity of the test CPC with atomized, polydisperse NaI (high concentration) aerosol. At first, we measured the monodisperse CE at electrical mobility diameters of 30, 50, 75, and 100 nm. Subsequently, we performed polydisperse CE measurements for 10 PN concentrations ranging from < 100 cm–3 to the single particle count limit of 30 000 cm–3. The rotating disk diluter diluted the aerosol with a DR of 1:200. Due to the high concentrations of the polydisperse aerosol, we used an additional dilution bridge for further dilution. The average CE of the monodisperse measurement was then used to adjust for the CE measurements of the polydisperse aerosol.
3. Results
3.1. Particle size distributions for atomized salts
The PSDs were measured for each respective atomized salt at high and low concentrations at a DR of 1:50. The resulting unimodal size distribution parameters (GMD, GSD and PN concentration) are listed in the online supplemental information (SI) in Table S1. shows unimodal size distributions that are comparable for the same molar concentrations. The GMD for the low salt concentrations ranges from 27 to 32 nm, while for the high concentration solutions, the GMD lies between 43 and 50 nm. This trend is consistent with previously reported results from Stabile et al. (Citation2013) and Chen and Chein (Citation2006), confirming that the GMD increases with the mass concentration of the salt solution. A variation in the GMD between different laboratory setups is expected due to differences in flow rates, pressure, and residence time of the aerosol. The similarity of the PN concentration and shape of the size distribution with regards to the GMD and GSD allows for comparing CEs between different salts without changing the DR or considering different ratios of doubly charged particles. NaCl aerosol generated in a tube furnace had an overall narrower distribution and higher PN concentration, with the GMD ranging from 18.5 to 66 nm depending on the furnace temperature, as shown in the SI in . CE measurements were performed at 725C, resulting in a GMD of 39.7 nm.
While the PN concentrations decreased at elevated dilution temperatures, the GMD and GSD of the size distribution remained unaffected. The reduction was mainly caused by the thermal expansion of the gas, which resulted in a higher flow rate through the diluter and, therefore, an increased DR. The DR is increased by a factor of 1.28 for 150C and 1.41 for 190
C, resulting in lower PN concentrations for both CPCs.
3.2. Influence of the chemical composition and generation method
Since the aerosol composition heavily influences the CE, the influence of different salt compositions and generation methods was investigated. The CE curves of four different atomized salt solutions with low concentrations and two furnace-generated aerosols are shown in . Most significant is the CE of NaI, which was 100% for particles as small as 18 nm. Measurements at even smaller sizes did not show sufficient particle concentrations after size selection to reliably estimate the CE. This was caused by the decrease in charging probability at small mobility diameters (Wiedensohler Citation1988) and low particle number concentrations of the initial PSD, as seen in . Furthermore, the CE decreased for the TSI 3775 reference CPC at sizes below 18 nm (Shi et al. Citation2005). The CE of NaI varied between 1.02 and 1.04 for all sizes between 18 and 100 nm, a variation less than 2% over the entire mobility diameter range.
Figure 3. CE of NaCl, NaBr, NaF, and NaI particles generated via atomization and evaporation-condensation method. The color indicates the particle coposition. Aerosol generated with the tube furnace is indicated with a star in the legend and shown with quadrilaterals. The black boxes indicate regulatory requirements at 23 and 41 nm. The CE of atomized aerosol particles is shown with triangles.
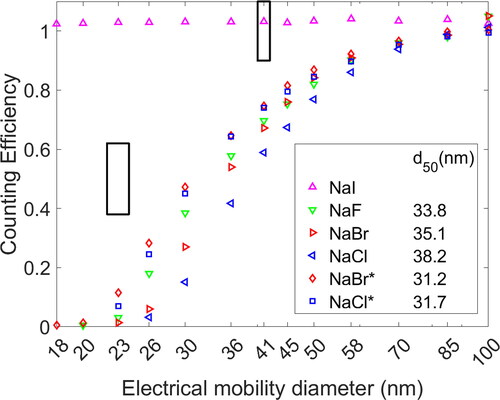
The CEs for other salt particles were well below regulatory requirements of 0.5 ± 0.12 for 23 nm. Furnace-generated NaCl had a d50 of 31.7 nm. All d50 values were fitted according to Equationequation 1(1)
(1) . Compared to atomized salts, the aerosol generated in the tube furnace had a higher CE. NaCl particles generated with an atomizer had a reduced CE with a d50 diameter of 38.2 nm. A similar trend was observed for NaBr particles. Particles generated in the tube furnace had a d50 diameter of 31.2 nm, while the d50 increased to 35.1 nm for the same aerosol generated with an atomizer. Atomized NaF particles had a higher CE compared to NaBr at smaller electrical mobility diameters, but the CE was lower at larger sizes, leading to a fitted d50 value of 33.8 nm.
3.3. Influence of the salt concentration and dilution rate
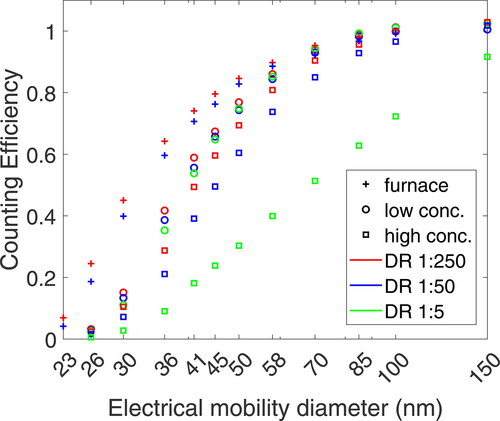
The dependency of the PN concentration and base material (salt in the combustion boat or solute concentration) should be minimal for its use as calibration aerosol. Therefore, CE curves of atomized NaCl particles for two molar concentrations at three DRs are shown in . The CE slightly increases with the DR for all three aerosols. While the shift in d50 is less than 5% for tube furnace-generated particles or atomized particles generated from the low molar concentration, the CE of the 23 nm CPC significantly decreases at high salt concentrations and low DRs. In the worst case - at a DR of 1:5 and salt concentration of 0.5 wt% - the CE is strongly reduced over the entire size range, even at 150 nm, the 90% CE threshold is barely reached. This reduction leads to a d50 of 69.5 nm, three times more than the diameter the CPC was initially calibrated for. At a DR of 1:250, the decrease in CE is less pronounced with a d50 of 45.3 nm compared to 41.4 nm for the low concentration solution.
Figure 4. CE of NaCl particles for different DRs. Two solute concentrations and tube furnace-generated aerosol was evaluated. The temperature of the furnace was set at 725C. The color indicates the DR which was used. The marker type indicates how the particles were generated.
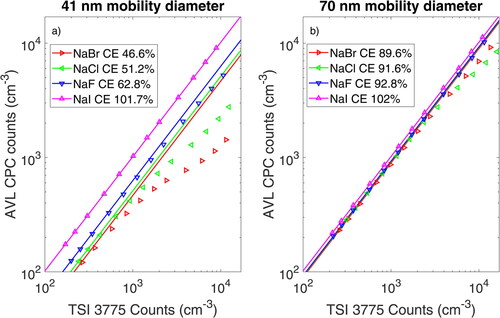
The decrease in CE was also observed for NaBr particles and, to a lesser extent, for NaF particles. shows linearity measurements at electrical mobility diameters of 41 and 70 nm, obtained by varying the DRs between 1:5 and 1:250. We used a cold dilution and high salt concentrations for the measurements in the plot. While the CE of NaI particles was not affected by the DR, NaCl and NaBr particles showed a decrease in CE at higher concentrations. The decrease started at a concentration of 500 cm–3 measured with the test CPC and was more pronounced for the smaller particles. For NaBr particles at 41 nm, the CE decreased from 0.47 to 0.12, a relative reduction of 73% in CE for particles with the same electrical mobility diameter and generation method. At 70 nm, the effect is visible for all test aerosols and is most pronounced for NaCl particles, followed by NaBr particles. NaCl particles show a CE of 0.92 at 70 nm at a high dilution, which decreases to 0.52 for a 1:5 DR. An alternative representation showing the relative and absolute CE depending on the DR can be seen in the SI in section S2.
Figure 5. Linearity measurements of atomized salts with high molar concentrations at 41 nm (a, left) and 70 nm (b, right). The CE stated in the legend indicates the CE of the test CPC measured at the highest DR of 1:250. This CE is also plotted as a solid line to act as a guide to the eye.
3.4. Influence of the dilution temperature
To reduce the PN concentration of combustion engines to measurable levels, aerosol is diluted with a hot dilution prior measurement. The influence of the dilution and its temperature on the CE of NaCl particles is shown in . In , the CE of the high concentration solution was evaluated for two different DRs, 1:5 and 1:250, and three dilution temperatures. The CE increases with higher dilution temperatures. Moreover, at higher temperatures, the influence of the DR on the CE is reduced. In the aforementioned worst-case scenario of a low dilution and high molar concentration, the d50 decreases from 69.5 to 32.1 nm for 190C dilution temperature. A d50 of 29.7 nm was measured for 190
C and a 1:250 DR.
Figure 6. CE of NaCl particles at three dilution temperatures. (a) Influence on the dilution rate for several concentrations and DRs for atomized NaCl particles with high solute concentrations. (b) Comparison of NaCl particles generated in a tube furnace and with an atomizer with a low solute concentration at DR of 1:250.
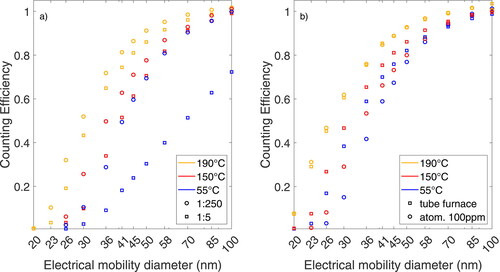
In , the CE of NaCl particles generated with the atomizer using a DR of 1:250 and low solute concentration is compared to the CE of NaCl particles generated in the tube furnace. Similar to atomized NaCl particles, the CE increases for particles generated in a tube furnace with a hot dilution. At a dilution temperature of 190C, the d50 of 27 nm of atomized NaCl particles coincides with the d50 of tube furnace-generated aerosol at 27.3 nm.
Similarly, for NaBr particles, the CE increased for both generation methods, and the d50 was as low as 25.7 nm with a hot dilution compared to a d50 of 63.4 nm for atomized aerosol.
3.5. Polydisperse calibration with NaI particles
The average CE of the monodisperse NaI at sizes of 30, 50, 70, and 100 was measured to be 1.081, which means that CE was overestimated by 8.1% compared to the reference CPC.Footnote1 This plateau efficiency parameter A was used to compensate for systematic over-counting in the polydisperse measurement. The polydisperse measurement is shown in .
Figure 7. (a) Linearity measurement of the AVL CPC with atomized NaI including the respective counting uncertainty of each CPC. The CE in the legend is the averaged CE over 10 measurements. (b) CE adjusted with the correction factor obtained from monodisperse measurements.
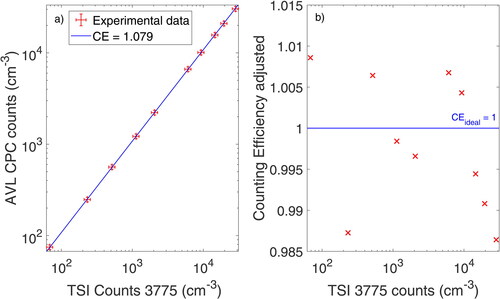
While the ISO 27891 (Citation2015) proposes a linear regression fit to evaluate the CE and linearity, Giechaskiel and Stilianakis (Citation2009) note that the slope of the linear regression is primarily determined by the CE at the highest particle counts and is therefore not suitable for evaluation. With the underlying particle size distribution, the ratio of counted particles was 1.079 in the polydisperse case, leading to an overestimation of 7.9%. After correcting for the plateau efficiency parameter A, we obtained CEs deviating by less than 0.2% overall from the monodisperse CE, with an adjusted, average polydisperse CE of 99.8%. The data for the adjusted polydisperse CE over the concentration range is shown in . The polydisperse CEs obtained at different concentrations deviate by less than 2% over the whole single count mode range and are therefore well within the standard uncertainty limits of ± 10%. Theoretical calculations supporting the experimental data were performed and are shown in the SI in S4.
4. Discussion
4.1. Influence of the generation method
For both NaBr and NaCl particles, the d50 varied depending on the generation method. The CE of NaCl and NaBr particles generated with a tube furnace was rather similar, with a d50 of 31.7 and 31.2 nm, respectively. This compares to a d50 of 38.2 nm for atomized NaCl particles which is an increase of 20% in diameter. Atomized NaBr particles showed a d50 of 35.1 nm, which is a 13% increase in d50. Wang et al. (Citation2010) used a TSI 3790 CPC, which is also used for exhaust emission measurements and calibrated to a d50 of 23 nm with emery oil. Recalculating the CE from their fit data with formula 1 gives a d50 of 33.9 nm for NaCl particles, which agrees reasonably well with our findings (within 2.2 nm). Giechaskiel et al. (Citation2009) used an electrometer as reference device and evaluated the CE of a TSI 3790. At 50 nm electrical mobility diameter, a CE between 0.86 and 0.92 was reported for furnace-generated NaCl particles, which is slightly above the value of 0.85 reported within this work. Therefore, the CE for both NaBr and NaCl increased for aerosol generated with the evaporation-condensation technique.
4.2. Influence of the chemical composition
The CE of atomized particles was heavily dependent on the salt composition. The different CEs can be seen in . Atomized NaI particles were fully counted down to 18 nm by the 23 nm CPC and therefore differed drastically from other aerosols. The CE was stable throughout the PSD due to its low d50 diameter. With its good activation properties and the accompanied 100% CE down to small sizes, NaI is useful for polydisperse linearity measurements within the whole concentration range of PN measurement systems (typically up to 107 cm–3). The linearity results will not be affected by an eventual change of the PSD due to size- and dilution rate-dependent losses in the dilution system (Giechaskiel et al. Citation2010; Krasa et al. Citation2021).
Furthermore, the low mobility diameter at which NaI is fully counted, allows for calibration of the plateau efficiency parameter A (see EquationEquation (1)(1)
(1) ) at sizes with sufficiently high aerosol concentration compared to NaCl, for which particles up to 100 nm may not be fully counted, as shown in . The CE was between 1.02 and 1.04 between 18 and 100 nm, with a deviation of less than 2% for all sizes. Systematic underestimation of the PN concentration can be caused by residual particles deposited on the edge of the critical orifice, which decreases the flow rate, and therefore, the PN concentration being counted in the CPC.
The CE varied for other atomized aerosols, but no trend was observed concerning the salt’s electronegativity, solubility, or vapor pressure of the different inorganic salts. The properties of the salts are listed in . The regulatory requirement of 50 ± 12% could not be fulfilled with atomized salts and a cold dilution. The 23 nm automotive CPCs are commonly calibrated with emery oil, which has higher CEs than the test aerosols used in this study. Giechaskiel et al. (Citation2011) investigated the influence of the particle chemical composition and compared simulations with experimental data. Different theories that can influence the CE for particles based on their composition were characterized. Contact angle theory was used to explain the reduced CE for different particle compositions.
Compared to emery oil, soot particles generated with a MiniCAST show a reduced CE. The CE in the transition region was found to be 40% at 23 nm with a TSI 3790 CPC (Giechaskiel and Bergmann Citation2011; Mamakos et al. Citation2013). Terres et al. (Citation2021) evaluated the CE of a calibrated CPC within round-robin measurements across six laboratories. High uncertainties regarding the CE of soot were reported for the different laboratories, with the CE varying by more than 20% for the same aerosol generator and CPC. The average CE at 23 nm was 28.8%, which is above the CEs measured for the inorganic salts analyzed in this work for a cold dilution. At an electrical mobility diameter of 23 nm and cold dilution, no aerosol exhibited a sufficient CE to allow for a comparison with soot.
4.3. Influence of the salt concentration and dilution rate
The significant decrease in CE for atomized salt particles and low DRs in cannot be attributed to linearity effects caused by a inaccurate coincidence correction. The CE decreased only at high salt concentrations in the solution, but not at lower salt concentrations. This effect was also observed for NaBr and, to a lesser extent, for NaF. To rule out the possibility of a faulty device or a manufacturer-specific problem, measurements were performed with an automotive TSI 3790 CPC with the same counting characteristics. The CE is also reduced for the TSI CPC (shown in the SI in Figure S3). The similarity of the results in Figure S3 lets us conclude that the findings in this study are valid for 23 nm automotive CPCs in general and are not specific for the AVL CPC. The reduction in CE causes problems when calibrating the CPCs, as some aerosols cause non-linearities while others do not.
The reason why these non-linearities occur is still the subject of current investigations. Giechaskiel and Bergmann (Citation2011) observed non-linear counting behavior due to a change in pulse width when the CPC was operated under boosted conditions. However, in this case, the temperature of the CPC was not altered, and no change in pulse width was observed for different solute concentrations and DRs.
Further non-linearities in CPCs may be caused by vapor depletion and condensational heating. These effects were investigated by Lewis and Hering (Citation2013). While the authors analyzed a water-based TSI 3785 CPC, calculations for different temperature settings, geometric properties, and a butanol-based CPC were performed in the supplemental of their study. CPCs with a higher cutoff diameter have a flatter saturation profile and are therefore more prone to slight changes in the saturation ratio. Butanol-based CPCs are less susceptible to condensational heating effects. However, the concentrations required for these effects to be relevant were in the range of and higher for bimodal distributions according to Stratmann et al. (Citation2010). In this case, bigger aerosol takes up enough vapor to suppress the growth of smaller aerosol, which requires a higher saturation ratio. The experiments performed in this study showed a decline in CE for concentrations below 1000 cm–3, which is lower by a factor of 50 compared to reports from previous studies.
A shift in CE due to aerosol carrying multiple positive charges was calculated based on the PSD from and charge probabilities from Wiedensohler (Citation1988). Multiply charged aerosol particles can cause an increase in CE since they are bigger in size for the same electrical mobility. The amount of double charged aerosol particles accounted for less than 8% and 12% for all PSDs with low and high molar concentrations, respectively. Furthermore, charged particles require lower supersaturation compared to uncharged particles, which also increases the CE further. However, this effect is mostly significant in the sub-5 nm regime and has only minimal effect on particles bigger than 10 nm (Scheibel and Porstendörfer Citation1986; Stolzenburg and Mcmurry Citation1991). To evaluate the influence of those effects, the particles were charged again after size selection with a second X-ray charger to restore the charge balance, but the CE remained unchanged.
Physical shrinkage, growth or restructuring of the aerosol after the classification can also influence the CE. Biskos et al. (Citation2006) and Krämer, Pöschl, and Niessner (Citation2000) reported a change in electrical mobility diameter with a change in relative humidity of the carrier air. Li and Hogan (Citation2017) studied the vapor uptake on NaCl cluster ions for different working fluids and reported increased cluster at higher butanol vapor pressures. Changes in mobility diameter were investigated using a tandem DMA setup within this study. To obtain similar dilution factors, the sheath flow to aerosol flow ratio was reduced to 1:5 to partially compensate for the additional dilution caused by the second DMA. The DR of the disk diluter was slightly reduced, resulting in concentrations comparable to those of a 1:10 dilution. Regardless of the particle size selected in the first DMA, the DR of the disk diluter, and the solute concentration, no change in the diameter of the electric mobility was observed. Additional drying of the sheath flow in the DMA did not change the particles electrical mobility diameter. Therefore, the drag on the particles in the DMA is unchanged, they do not take up considerable amounts of vapor or undergo physical restructuring.
4.4. Influence of the dilution temperature
The CE increased with the dilution temperature for NaCl particles, both at low and high molar concentrations. Furthermore, the CE for atomized NaCl particles also increased. The hot dilution temperature mitigated the decrease in CE at low DR for high solute concentrations. At a dilution temperature of 190 C, the CE of atomized aerosols generated with the low solute concentration equaled that of furnace-generated aerosols, as shown in . No change in electrical mobility diameter was observed.
Contrary to the results obtained in this study, Giechaskiel et al. (Citation2009) reported decreased CEs for NaCl treated with a thermodenuder, suspecting condensing water from the carrier air of the sheath flow for non-thermally treated aerosol. Tuch et al. (Citation2016) evaluated the CE of sintered silver particles and obtained a reduced CE after thermal treatment. Sintering at 350C caused a change in electrical mobility diameter for particles with size above 18 nm. No change in CE was observed for smaller silver particles after sintering. The hot dilution stage in this study did not change the electrical mobility diameter regardless of the solute concentration or DR. Therefore, a change in composition due to evaporation upon heating can be ruled out.
4.5. Polydisperse calibration with NaI particles
The CE of the reference CPC was evaluated for atomized NaI (high concentration) for both mono- and polydisperse aerosols. In the case of the polydisperse size distribution, the linearity was checked as well. Due to the low cutoff of NaI, the polydisperse CE showed excellent agreement with that of the monodisperse aerosol, with the CE of the polydisperse aerosol decreasing by only 0.2% on average. While the theoretical evaluation of the CE was subject to variances due to uncertainties of the CE in the cutoff region of NaI, the data correlated very well with experimental results, with over 99% of the polydisperse aerosol being counted in both cases (see Figure S4). This deviation is one order of magnitude below the stated uncertainty of a CPC of ± 10% and therefore allows for precise calibration of the plateau efficiency with polydisperse aerosol.
Compared to previously performed calibrations, the use of an additional DMA is not required. This can be useful during on-site calibrations, where clogging of the flow orifice, flow nozzle, or degradation of the saturator wick can cause a reduction of the CE. While a clogging of the flow orifice can be detected by a reduction in flow rate, no reliable checks can be performed to evaluate the CE easily onside. Calibration with atomized NaI allows for a simple, portable, and low-cost solution to evaluate the plateau efficiency without the use of a DMA, only requiring a compact atomizer and shop air. Furthermore, in calibration laboratories, where a full calibration of the CPC is performed, the linearity check and the estimation of the plateau efficiency could be evaluated simultaneously. The parallel evaluation measurement leads to a significant time reduction for the overall calibration procedure. Future homologation legislation will decrease the cutoff from 23 nm down to 10 nm. It is to be expected, that similar to automotive CPCs, 10 nm CPCs will count NaI particles also at smaller sizes, which would allow for the same calibration procedure.
5. Conclusion
The CE of a 23 nm exhaust emission CPC was experimentally investigated with atomized and tube furnace-generated particles for different inorganic salt particles and solute concentrations. The atomizer produced similar PSDs for the same molar concentrations.
Particles generated with the evaporation-condensation technique showed a higher CE compared to atomized aerosol, with the d50 decreasing from 38.2 to 31.7 nm. The CE is therefore not only influenced by the particle composition, but also by the generation method. The CE of furnace-generated NaCl agreed well with previously reported results.
Additionally to NaCl-, NaF-, NaBr-, and NaI-solutions were atomized. Depending on the anion, the CE varied with no observable trend in anion electronegativity, solubility, or vapor pressure. NaI particles exhibited a significantly higher CE than other aerosols and were fully activated down to 18 nm.
The atomized salts were evaluated regarding their suitability as calibration aerosol. The DR and solute concentration heavily influenced the CE of atomized aerosol, leading to a previously unreported, non-linear counting behavior. This trend was not seen for particles generated in a tube furnace. The d50 diameter of atomized NaCl particles ranged from 38.2 to 69.5 nm for a single generation method and dilution temperature. A hot dilution (i) increased the CE for both atomized and tube furnace-generated aerosol, and (ii) minimized the observed non-linearity effects at low DRs and high solute concentrations. Regulatory requirements were not met even at 190C dilution temperature.
Based on the obtained results, we propose a method to calibrate the plateau efficiency parameter A with polydisperse, atomized NaI. The CE agrees well with that of a monodisperse calibration. This allows for simultaneous and in-field evaluation of the linearity and plateau efficiency without requiring a DMA.
| Nomenclature | ||
| Acronyms | = | |
| CE | = | counting efficiency |
| CPC | = | condensation particle counter |
| DMA | = | differential mobility analyzer |
| DR | = | dilution rate |
| GMD | = | geometric mean diameter |
| GSD | = | geometric standard deviation |
| PN | = | particle number |
| PSD | = | particle size distribution |
| SMPS | = | scanning mobility particle sizer |
Supplemental Material
Download PDF (292.6 KB)Additional information
Funding
Notes
1 Measurements performed in this section were conducted six months after the initial tests, which led to a deviation in plateau CE compared to 3.2.
References
- AVL List GmbH. 2022. AVL particle counter - now AVL CPC inside. Accessed August 14, 2022. https://www.avl.com/documents/10138/3126821/26.08.16_ITS_pdf_web_acpplus_sol_sheet.
- Bergmann, A., and H. Pongratz. 2009. Rotating disc diluter for fluid flows. U.S. Patent 843 451 2B2.
- Biskos, G., A. Malinowski, L. M. Russell, P. R. Buseck, and S. T. Martin. 2006. Nanosize effect on the deliquescence and the efflorescence of sodium chloride particles. Aerosol Sci. Technol. 40 (2):97–106. doi:10.1080/02786820500484396.
- BMDV. 2021. Änderung der Richtlinie für die Durchführung der Untersuchung der Abgase von Kraftfahrzeugen nach Nummer 6.8.2. der Anlage VIIIa Straßenverkehrs-Zulassungs-Ordnung (StVZO). Verkehrsblatt, 404.
- Brook, R. D., S. Rajagopalan, C. A. Pope, J. R. Brook, A. Bhatnagar, A. V. Diez-Roux, F. Holguin, Y. Hong, R. V. Luepker, M. A. Mittleman, et al. 2010. Particulate matter air pollution and cardiovascular disease. Circulation 121 (21):2331–78. doi:10.1161/CIR.0b013e3181dbece1.
- Burtscher, H., T. Lutz, and A. Mayer. 2019. A new periodic technical inspection for particle emissions of vehicles. Emiss. Control Sci. Technol. 5 (3):279–87. doi:10.1007/s40825-019-00128-z.
- Chen, T. M., and H. M. Chein. 2006. Generation and evaluation of monodisperse sodium chloride and oleic acid nanoparticles. Aerosol Air Qual. Res. 6 (3):305–21. doi:10.4209/aaqr.2006.09.0007.
- Cheng, M. T., H. J. Chen, L. H. Young, H. H. Yang, Y. I. Tsai, L. C. Wang, J. H. Lu, and C. B. Chen. 2015. Carbonaceous composition changes of heavy-duty diesel engine particles in relation to biodiesels, aftertreatments and engine loads. J. Hazard. Mater. 297:234–40.
- GESTIS. 2022. Gestis substance database. Institut für Arbeitsschutz der Deutschen Gesetzlichen Unfallversicherung (IFA). https://www.dguv.de/ifa/gestis/gestis-stoffdatenbank/index-2.jsp.
- Giechaskiel, B., and A. Bergmann. 2011. Validation of 14 used, re-calibrated and new TSI 3790 condensation particle counters according to the UN-ECE Regulation 83. J. Aerosol Sci. 42 (3):195–203. doi:10.1016/j.jaerosci.2011.01.002.
- Giechaskiel, B., and N. I. Stilianakis. 2009. A note on the comparison of particle number counters. Meas. Sci. Technol. 20 (7):077003. doi:10.1088/0957-0233/20/7/077003.
- Giechaskiel, B., M. Cresnoverh, H. Jörgl, and A. Bergmann. 2010. Calibration and accuracy of a particle number measurement system. Meas. Sci. Technol. 21 (4):045102. doi:10.1088/0957-0233/21/4/045102.
- Giechaskiel, B., P. Dilara, and J. Andersson. 2008. Particle Measurement Programme (PMP) light-duty inter-laboratory exercise: Repeatability and reproducibility of the particle number method. Aerosol Sci. Technol. 42 (7):528–43. doi:10.1080/02786820802220241.
- Giechaskiel, B., P. Dilara, E. Sandbach, and J. Andersson. 2008. Particle measurement programme (PMP) light-duty inter-laboratory exercise: comparison of different particle number measurement systems. Meas. Sci. Technol. 19 (9):095401. doi:10.1088/0957-0233/19/9/095401.
- Giechaskiel, B., X. Wang, D. Gilliland, and Y. Drossinos. 2011. The effect of particle chemical composition on the activation probability in n-butanol condensation particle counters. J. Aerosol Sci. 42 (1):20–37. doi:10.1016/j.jaerosci.2010.10.006.
- Giechaskiel, B., X. Wang, H.-G. Horn, J. Spielvogel, C. Gerhart, J. Southgate, L. Jing, M. Kasper, Y. Drossinos, and A. Krasenbrink. 2009. Calibration of condensation particle counters for legislated vehicle number emission measurements. Aerosol Sci. Technol. 43 (12):1164–73. doi:10.1080/02786820903242029.
- Hooftman, N., M. Messagie, J. Van Mierlo, and T. Coosemans. 2018. A review of the european passenger car regulations – real driving emissions vs local air quality. Renewable Sustainable Energy Rev. 86:1–21. doi:10.1016/j.rser.2018.01.012.
- Hueglin, C., L. Scherrer, and H. Burtscher. 1997. An accurate, continuously adjustable dilution system (1:10 to 1:104) for submicron aerosols. J. Aerosol Sci. 28 (6):1049–55. doi:10.1016/S0021-8502(96)00485-5.
- ISO 27891. 2015. Standard, International Organization for Standardization, Geneva.
- JCGM. 2008. Evaluation of measurement data – guide to the expression of uncertainty in measurement 100:2008. Standard, Joint Committee for Guides in Metrology.
- Krämer, L., U. Pöschl, and R. Niessner. 2000. Microstructural rearrangement of sodium chloride condensation aerosol particles on interaction with water vapor. J. Aerosol Sci. 31 (6):673–85. doi:10.1016/S0021-8502(99)00551-0.
- Krasa, H., M. Kupper, A. Bergmann, and M. Bainschab. 2021. 10 nm exhaust particle counting system for automotive certification measurements. In 39th Annual Meeting of the American Association for Aerosol Research, AAAR 39th Annual Conference.
- Kulmala, M., G. Mordas, T. Petäjä, T. Grönholm, P. P. Aalto, H. Vehkamäki, A. I. Hienola, E. Herrmann, M. Sipilä, I. Riipinen, et al. 2007. The condensation particle counter battery (cpcb): A new tool to investigate the activation properties of nanoparticles. J. Aerosol Sci. 38 (3):289–304. doi:10.1016/j.jaerosci.2006.11.008.
- Lewis, G., and S. Hering. 2013. Minimizing concentration effects in water-based, laminar-flow condensation particle counters. Aerosol Sci. Technol. 47 (6):645–54. doi:10.1080/02786826.2013.779629.
- Li, C., and C. J. J. Hogan. 2017. Vapor specific extents of uptake by nanometer scale charged particles. Aerosol Sci. Technol. 51 (5):653–64. doi:10.1080/02786826.2017.1288285.
- Liu, B. Y. H., and K. W. Lee. 1975. An aerosol generator of high stability. Am. Ind. Hyg. Assoc. J. 36 (12):861–5. PMID: 1211356.
- Mamakos, A., I. Khalek, R. Giannelli, and M. Spears. 2013. Characterization of combustion aerosol produced by a mini-CAST and treated in a catalytic stripper. Aerosol Sci. Technol. 47 (8):927–36. doi:10.1080/02786826.2013.802762.
- Murzyn, F., C. Sioutas, L. D. Cavellin, F. Joly, A. Baudic, A. Mehel, P. Cuvelier, E. Varea, and B. P. Rouland. 2021. Assessment of air quality in car cabin in and around paris from on-board measurements and comparison with 2007 data. J. Aerosol Sci. 158:105822. doi:10.1016/j.jaerosci.2021.105822.
- Peng, C., L. Chen, and M. Tang. 2022. A database for deliquescence and efflorescence relative humidities of compounds with atmospheric relevance. Fundam. Res. 2 (4):578–87. doi:10.1016/j.fmre.2021.11.021.
- Popovicheva, O. B., C. Irimiea, Y. Carpentier, I. K. Ortega, E. D. Kireeva, N. K. Shonija, J. Schwarz, M. Vojtíšek-Lom, and C. Focsa. 2017. Chemical composition of diesel/biodiesel particulate exhaust by FTIR spectroscopy and mass spectrometry: impact of fuel and driving cycle. Aerosol Air Qual. Res. 17 (7):1717–34. doi:10.4209/aaqr.2017.04.0127.
- Regulation 83. 2015. Regulation No 83 of the Economic Commission for Europe of the United Nations (UNECE) – Uniform provisions concerning the approval of vehicles with regard to the emission of pollutants according to engine fuel requirements [2015/1038]. Off. J. Eur. Union 58:1–249.
- Scheibel, H. G., and J. Porstendörfer. 1983. Generation of monodisperse Ag- and NaCl-aerosols with particle diameters between 2 and 300 nm. J. Aerosol Sci. 14 (2):113–26. doi:10.1016/0021-8502(83)90035-6.
- Scheibel, H. G., and J. Porstendörfer. 1986. Counting efficiency and detection limit of condensation nuclei counters for submicrometer aerosols: Ii. measurements with monodisperse hydrophobic ag and hygroscopic nacl aerosols with particle diameters between 2 and 100 nm. J. Colloid Interface Sci. 109 (1):275–91. doi:10.1016/0021-9797(86)90302-4.
- Shi, Q., H.-S. Han, S. Kerrigan, and E. Johnson. 2005. Characterization of two new butanol-based condensation particle counters (TSI Model 3776 UCPC and 3775 CPC). In American Association for Aerosol Research Conference, Austin, TX.
- Stabile, L., C. V. Trassierra, G. Dell’Agli, and G. Buonanno. 2013. Ultrafine particle generation through atomization technique: The influence of the solution. Aerosol Air Qual. Res. 13 (6):1667–77. doi:10.4209/aaqr.2013.03.0085.
- Stolzenburg, M. R., and P. H. Mcmurry. 1991. An ultrafine aerosol condensation nucleus counter. Aerosol Sci. Technol. 14 (1):48–65. doi:10.1080/02786829108959470.
- Stratmann, F., E. Herrmann, T. Petäjä, and M. Kulmala. 2010. Atmospheric Measurement Techniques Modelling Ag-particle activation and growth in a TSI WCPC model 3785. Atmos. Meas. Tech. 3 (1):273–81. doi:10.5194/amt-3-273-2010.
- Terres, A., B. Giechaskiel, A. Nowak, and V. Ebert. 2021. Calibration uncertainty of 23nm engine exhaust condensation particle counters with soot generators: a European automotive laboratory comparison. Emiss. Control Sci. Technol. 7 (2):124–36. doi:10.1007/s40825-021-00189-z.
- Toner, S. M., D. A. Sodeman, and K. A. Prather. 2006. Single particle characterization of ultrafine and accumulation mode particles from heavy duty diesel vehicles using aerosol time-of-flight mass spectrometry. Environ. Sci. Technol. 40 (12):3912–21. ):doi:10.1021/es051455x.
- Tuch, T., K. Weinhold, M. Merkel, A. Nowak, T. Klein, P. Quincey, M. R. Stolzenburg, and A. Wiedensohler. 2016. Dependence of CPC cut-off diameter on particle morphology and other factors. Aerosol Sci. Technol. 50 (4):331–8. doi:10.1080/02786826.2016.1152351.
- Wang, X., R. Caldow, G. J. Sem, N. Hama, and H. Sakurai. 2010. Evaluation of a condensation particle counter for vehicle emission measurement: Experimental procedure and effects of calibration aerosol material. J. Aerosol Sci. 41 (3):306–18. doi:10.1016/j.jaerosci.2010.01.001.
- Wiedensohler, A. 1988. An approximation of the bipolar charge distribution for particles in the submicron size range. J. Aerosol Sci. 19 (3):387–9. doi:10.1016/0021-8502(88)90278-9.
- Wiedensohler, A., A. Wiesner, K. Weinhold, W. Birmili, M. Hermann, M. Merkel, T. Müller, S. Pfeifer, A. Schmidt, T. Tuch, et al. 2018. Mobility particle size spectrometers: Calibration procedures and measurement uncertainties. Aerosol Sci. Technol. 52 (2):146–64. doi:10.1080/02786826.2017.1387229.
- Wlasits, P. J., D. Stolzenburg, C. Tauber, S. Brilke, S. H. Schmitt, P. M. Winkler, and D. Wimmer. 2020. Counting on chemistry: laboratory evaluation of seed-material-dependent detection efficiencies of ultrafine condensation particle counters. Atmos. Meas. Tech. 13 (7):3787–98. doi:10.5194/amt-13-3787-2020.