
Abstract
Systemic drug delivery via the pulmonary route has a critical limitation because dose uniformity is strongly dependent upon patient inhalation technique. The most frequent and critical errors in inhalation technique are overly forceful inspiration and insufficient breath-holding. In this study, response surface methodology was used with an in silico whole lung particle deposition model for bolus administration to investigate whether varying the inhaled drug particle size could reduce the dependence of deposition upon flow rate and/or breath-holding duration. The range of particle aerodynamic diameters studied was 0.1–10 µm for flow rates between 500–2000 mL/s and breath-holding duration between 0–15 seconds. Comparison with published experimental data showed that this modeling approach can accurately predict the lung deposition. The simulation results indicated that the deposition of particles with aerodynamic diameter in the range of 0.1–1.5 µm should be minimally affected by flow rate over the 500–2000 mL/s range. There was found to be no particle size whose deposition was completely independent of breath-holding duration. The smallest particles, whose deposition is diffusion-driven, were found to be the least sensitive to breath-holding time, but this size is of limited practical use. On the other hand, the simulations indicated that particles with a 1.5 µm diameter would provide acceptable consistency in dose reaching the acini region when the breath-holding duration was greater than 10 seconds. It is hoped that this finding could provide a means of improving dose uniformity for systemic delivery via the pulmonary route by facilitating simplified patient instructions.
EDITOR:
1. Introduction
The lungs are attractive organs for noninvasive systemic delivery of peptide or/and protein drugs because the lungs do not present as harsh an environment as the gastrointestinal tract (e.g., acidity and digestive enzymes) or first-pass metabolism by the liver. In addition, they have a large surface area, good blood supply, a thin diffusion pathway, and high drug permeability (Patton, Fishburn, and Weers Citation2004). Peptide delivery via the pulmonary route has thus been used successfully to deliver biologics into the systemic circulation (Anselmo, Gokarn, and Mitragotri Citation2019). For instance, Afreeza (Mannkind ®) was successfully launched as an inhalable form of insulin and has had some market success (Klonoff Citation2014).
Systemic drug absorption via the pulmonary route requires the following processes to occur in sequence: deposition, dissolution, and absorption (Sakagami Citation2020). Inhaled drugs, which are usually in the form of solid particles, must deposit in the airways. The particles must then dissolve in the fluid lining of the epithelium, enabling the drug to be absorbed into the blood flowing in the adjacent capillaries (Borghardt et al. Citation2015). Unfortunately, however, there is a tendency for rapid clearance of the particles to occur before the drug is sufficiently absorbed to be therapeutically effective. In the tracheobronchial airways, undissolved particles undergo rapid mucociliary clearance, whereas, in the acini airways and alveoli, particles are cleared via the slower process of phagocytosis (Borghardt et al. Citation2015). Thus, the region of deposition affects the degree of drug absorption. In addition, drug absorption rates differ between the large tracheobronchial, small tracheobronchial, and acini airways, which again influences systemic drug absorption.
There is a further challenge for pulmonary delivery: the primary region and total amount of drug deposition depend on patient inhalation technique. Forceful inhalation has been shown to increase deposition in the mouth region and hence to reduce that in the lungs (Newman Citation2017). Insufficient breath-holding similarly can reduce lung deposition (Newman Citation2017). It has been shown that when a patient’s breathing pattern is uncontrolled, the total lung particle deposition varies from 20% to 95% (Brand et al. Citation2000). Although variability in lung dose does not pose a risk of serious side effects in most inhaled therapy (e.g., for asthma and COPD), such a large variability in systemic peptide/protein concentration could potentially lead to overdose, and cause side-effects.
The effect of flow rate and particle size on airway deposition efficiency has been studied extensively in various in silico studies (Darquenne Citation2020; Darquenne et al. Citation2016). Most studies, however, have been limited to either a single airway (Darquenne Citation2020; Kim et al. Citation2019) or a few generations of the airways (Chen et al. Citation2018; Inthavong et al. Citation2010). A few in silico (Koullapis et al. Citation2016) and in vivo (Häussermann, Sommerer, and Scheuch Citation2020; Usmani, Biddiscombe, and Barnes Citation2005) studies have shown a trend that decreasing particle size reduces the effect of high flow rates in the context of whole lung deposition; but, due to the one-factor at a time (OFAT) nature of the studies, it was not possible to investigate the relationship between the two independent factors (i.e., particle size and high flow rate) and the whole and the regional lung depositions quantitatively. Moreover, these studies could not specify a threshold particle diameter below which flow rate has a minimal effect on the total and the regional lung depositions. This study aims to use Design-of-experiment (DoE) methods to address these limitations. DoE methods are a statistical means of creating a descriptive model of the relationships between several independent variables (Montgomery Citation2017).
In this study, an in silico whole lung particle deposition model is used in combination with DoE to define the range of aerodynamic diametersFootnote1 that are least affected by flow rate and to evaluate whether there is a specific aerodynamic diameter range for which lung deposition is minimally affected by breath-holding duration. Bolus administration is assumed, as delivered by dry powder inhalers (DPI) and soft-mist inhalers. Pressurized metered-dose inhalers (pMDI) generate a high initial particle velocity independent of inhalation rate, and hence these are excluded from consideration here. The novelty of the work is that it identifies whether changes could be made to drug particle sizes to reduce the dependence of deposition on inhalation technique and hence improve dose consistency. The findings may help to address the large variability in lung deposition, which is a fundamental challenge in systemic drug delivery via the pulmonary route.
2. Methodology
The first part of the study involved developing an analytical whole lung particle deposition model for both continuous and bolus administration. A healthy lung model was developed using a deterministic multiple-path model (Asgharian, Hofmann, and Bergmann Citation2001). Analytical solutions were used to calculate particle deposition efficiency in the lung airways and were compared against in vivo human data (Heyder et al. Citation1986).
The second part of the study used the bolus administration model with DoE to analyze the relationship between the two independent variables (flow rate and aerodynamic particle diameter) and a response: large tracheobronchial, small tracheobronchial, acini, or whole lung deposition. The descriptive models from DoE were then used to determine the aerodynamic particle diameter range over which deposition is minimally influenced (as defined below) by flow rate. The same approach was then applied to study the effect of breath-holding duration on deposition of different particle sizes.
2.1. Whole lung particle deposition model
The airway model used for the present work was based on a deterministic multiple-path lung model (Asgharian, Hofmann, and Bergmann Citation2001; Montesantos et al. Citation2016). One hundred different lung models were created using a Monte Carlo method on measurements of healthy lungs (Montesantos et al. Citation2013; Raabe et al. Citation1976). Full details of the methods can be found in Supplementary Information 1. The lungs were assumed to undergo linear expansion and contraction, and hence the inhaled and exhaled flow rates were assumed to be constant (Yu Citation1978). The spatial average flow velocity was calculated by dividing volumetric flow by the corresponding airway’s cross-sectional area. The method proposed here was adapted from Anjilvel and Asgharian (Citation1995), and is described in detail in Supplementary Information 2.
Inside the lung airways, particle deposition occurs by one of three processes: inertial impaction, sedimentation, or Brownian diffusion. Several analytical equations were compared, and a combination of analytical equations that best fitted the in vivo data (Heyder et al. Citation1986) was selected (Supplementary information 2). These were taken from Beeckmans (Citation1965), Ingham (Citation1975), and Landahl (Citation1950) for sedimentation, diffusion, and impaction deposition, respectively. ICRP (Citation1994) and Golshahi et al. (Citation2013) were used for extrathoracic deposition for continuous and bolus administration model, respectively. Particles were assumed to be spherical, to have a smooth surface, to be rigid, and to have a unit density (i.e., 1 g/mL). Airway walls were also assumed to be rigid, and particle deposition was assumed to occur upon contact.
2.1.1. Particle deposition in continuous administration
The model was validated against in vivo continuous administration data for the regional lung depositions due to lack of data for bolus administration. A steady flow rate and constant initial concentration were assumed. Deposition efficiency for each airway was calculated using the analytical equations. The deposition efficiency determined concentration drop across the corresponding airway. The particle concentration in each airway was sequentially calculated from the first airway generation to the terminal acini sac. The deposited mass during inhalation was then calculated assuming conservation of mass. For particle deposition during exhalation, the deposited mass was calculated directly from the total mass entering the airway. The deposited mass was thus equal to the total mass entering the airway multiplied by the deposition efficiency. A detailed description of the method and the results, which is based on Anjilvel and Asgharian (Citation1995), can be found in Supplementary Information 2.
2.1.2. Particle deposition in bolus administration
For the modeling of bolus administration, it was assumed that the total mass of particles enters the lungs at the initial inhalation point and that no particles are left behind in an airway if the volume of air in which they are suspended has left that airway. It was also assumed that there was no particle-particle interaction due to the low volume fraction occupied by the particles.
The results for extrathoracic and lung deposition were also compared against in vivo lung deposition data for polydisperse dry powder inhalers (Borgstrom et al. Citation1994; Duddu et al. Citation2002; Newman et al. Citation2000). The bolus model was compared to the continuous model to study the effect of administration mode on particle travel and deposition in the lungs (Supplementary information 3).
Bolus dispersion was modeled using the method from Hofmann, Pawlak, and Sturm (Citation2008). The model includes the effect of (1) mixing in the extrathoracic region, (2) convective mixing in conducting airways, (3) mixing at airway bifurcations, and (4) mixing of residual and new air in the alveoli. The model with bolus dispersion was then validated against in vivo data (Brand et al. Citation1997), and the result is provided in Supplementary information 6.
2.2. Response surface methodology (RSM)
RSM, which is one method of DoE, is a multiple regression analysis that finds the relationship between several independent variables and a selected response, usually in terms of first- or/and second-order polynomials. The rationale of RSM is that quadratic equations can accurately capture a relationship, as long as the parameter range of the independent variables is sufficiently narrow. The first step in applying RSM is, therefore, screening to define ranges of independent variables that are sufficiently narrow to describe the relationship accurately but not so narrow that they exclude the region of interest.
In this study, the region of interest was the aerodynamic particle diameter range for which the whole and the regional lung depositions are minimally affected by flow rate. The flow rate will always have some effect regardless of particle size, and so a particle was deemed to be minimally affected by flow rate if the maximum difference in deposition fraction over the flow rate range between 500–2000 mL/s was equal to or less than 0.05 (i.e., 5%). The basis for choosing 0.05 is the US Food and Drug Administration (FDA) definition of sameness, which is ±5% (Lu et al. Citation2015). The flow rate range was chosen to represent low (500 mL/s or 30 L/min) to very high (2000 mL/s or 120 L/min) inspiration flow rates in bolus administration. The tidal volume was fixed at 1000 mL, and the total lung residence time for particles was fixed at 10s.
A screening step was performed to define the range of aerodynamic particle diameters over which RSM was to be conducted. The absolute difference in lung deposition fraction for flow rates between 2000 mL/s and 500 mL/s was determined for various particle sizes (0.1, 1, 3, and 5 µm). The smallest particle size for which lung deposition was not affected by the flow rate was selected as the lower range for RSM, and the smallest size for which lung deposition was affected by the flow rate was selected as the upper range of RSM. The lower and upper ranges for RSM were thus found to be 0.1 and 1.0 µm, respectively for large tracheobronchial and acini deposition. For small tracheobronchial deposition, the range was found to be 1.0 and 3.0 µm. Breath holding duration was fixed at 10 seconds.
The flow rate range was fixed at 500–2000 mL/s (i.e., low to very high inspiration speed). Both standard central composite design (CCD) and face-centered CCD were evaluated for goodness of fit (coefficient of determination, adjusted R2) and checked for overfitting using the predicted sum of squares, which is expressed as Predicted R2 (Mathews Citation2005). The backward elimination method was used with a threshold p-value of 0.15 (Mathews Citation2005) because it was shown to have a slightly higher goodness of fit out of 0.05, 0.10, 0.15, and 0.20 (data not included). The CCDs with higher R2 and predicted R2 values were selected for analysis (Supplementary information 5). RSM and its statistical analysis were conducted using Minitab® Version 20 (Minitab LLC) software.
Aerodynamic particle diameters for which the deposition fraction changed by more than 0.05 with varying flow rate were found using the descriptive model developed from RSM for the whole lung, the acini, and the large and small tracheobronchial airways. They were compared against the threshold particle diameter found using the analytical lung particle deposition model. The latter was found by calculating the deposition of 0.4 to 2.0 µm particles (with 0.1 µm increments) for flow rates from 500–2000 mL/s (with 500 mL/s increments). The largest particle diameter for which the maximum difference in deposition fraction with changing flow rate was not more than 0.05, was designated the threshold particle diameter.
Subsequently, the effect of breath-holding duration was studied using RSM. The two independent variables were taken to be aerodynamic diameter and breath-holding duration, and the responses were taken to be the whole and the regional lung depositions. The range of breath-holding duration was taken to be 0–15 seconds (representing no breath-holding to a long duration of breath-holding). The range of aerodynamic diameter was the range that was found to be minimally affected by flow rate, as determined in the previous RSM study. Flow rate and tidal volume were fixed at 1000 mL/s and 1000 mL, respectively. Again, standard and face-centered CCDs were compared for goodness of fit (adjusted R2) and predictability (predicted R2) (Mathews Citation2005). The backward elimination method was used with a threshold p-value of 0.15 (Mathews Citation2005).
3. Results
3.1. Whole lung particle deposition model validation
3.1.1. Particle deposition model for bolus administration
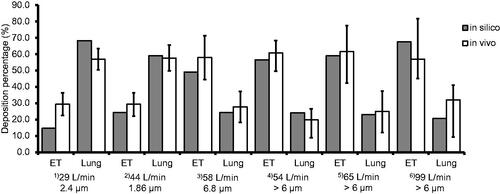
The results from the bolus administration model were compared to in vivo study data (Borgstrom et al. Citation1994; Duddu et al. Citation2002; Newman et al. Citation2000). There was found to be good agreement, suggesting that the model accurately predicts human in vivo bolus lung deposition within the conditions studied ().
Figure 1. Results from the analytical bolus model (“in silico”) are compared to in vivo data (Borgstrom et al. Citation1994; Duddu et al. Citation2002; Newman et al. Citation2000). Six different comparisons, indicated by superscripted bracketed numbers, are made for the extrathoracic region (“ET”) and the lungs (“lung”) deposition. in vivo data for conditions (1) and (2) are taken from Duddu et al. (Citation2002). Condition (3) is taken from Borgstrom et al. (Citation1994). Conditions (4), (5), and (6) are taken from Newman et al. (Citation2000). LPM is an abbreviation for liters per minute (L/min). The particle size is the mass median aerodynamic diameter (MMAD). The orange bars (“in silico”) represent data from the current analytical model. The blue bars (“in vivo”) are the average values for conditions (1), (2), and (3), and the black lines represent one standard deviation. For conditions (4), (5), and (6), the blue bars are the median values, and the black lines with asterisks (*) represent ranges. Particle size distribution for each case is given in Supplementary Information 7.
3.2. Effect of flow rate and aerodynamic diameter on whole and regional lung deposition
3.2.1. Screening step to determine particle size range for RSM
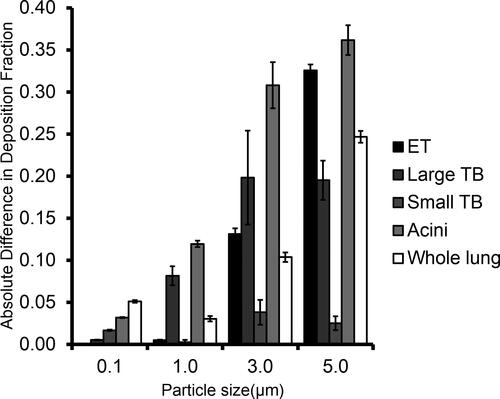
shows the absolute differences in deposition fraction between the high (2000 mL/s) and the low (500 mL/s) flow rates for the whole and regional lung deposition. It shows that smaller particles (0.1 µm diameter) are less affected by the flow rate in regional lung deposition compared to larger particles (1.0, 3.0, and 5.0 µm). The figure also shows that threshold particle diameters for large tracheobronchial and acini deposition exist between 0.1 and 1.0 µm because the difference in deposition fraction increases from below 0.05 at 0.1 µm to above 0.05 at 1.0 µm. The threshold particle diameter for the whole lung deposition appears to exist somewhere between 1.0 and 3.0 µm.
Figure 2. The difference in deposition fraction between high (2000 mL/s) and low (500 mL/s) flow rate is shown for total lung and regional lung (large tracheobronchial, small tracheobronchial, and acini) deposition (n = 3). The error bars represent the standard deviation. The difference increases above 0.05 at 1.0 µm for large tracheobronchial and acini deposition.
3.2.2. Rsm analysis for 0.1–1.0 μm diameter particles
Particles with diameters in the range of 0.1–1.0 µm were analyzed. Particles with aerodynamic diameters between 0.1–1.0 µm were found to deposit predominantly in the acini airways (), and hence the whole lung deposition was similar to that in the acini (). Acini deposition was found to be higher at either end of the particle diameter spectrum and to be lowest at approximately 0.2–0.3 µm diameter (i.e., Log (PD) = −0.7 to −0.5). This is because larger particles on the right-hand side of the spectrum are more likely to deposit by sedimentation, whereas particles on the other side of the spectrum tend to deposit via diffusion. shows that acini deposition decreased with increasing flow rate for particles above 0.6 µm diameter (i.e., Log (PD) = −0.2).
Figure 3. Contour plots showing the relationship between aerodynamic particle diameter (x-axis), flow rate (y-axis), and particle deposition (color boundaries) in (a) large tracheobronchial, (b) small tracheobronchial, (c) acini, and (d) whole lung. The x-axis is in a log-10 scale of aerodynamic particle diameter (µm) and ranges from −1.0 (0.1 µm) to 0 (1.0 µm).
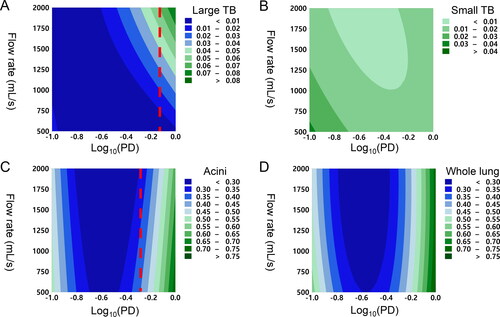
Large tracheobronchial deposition increased with particle diameter and flow rate (). The smaller particles were associated with more consistent delivery of drug particles at varying flow rates, but larger particles with a high flow rate were found to maximize deposition in the region. Particle deposition in the small tracheobronchial airways was found to be low (<3% of emitted dose) for this diameter range for all flow rates (). Although a slight increase in particle deposition with decreasing particle diameter and flow rate was observed, it was less than 5% of the emitted dose (i.e., 0.05 deposition fraction).
It was found that the threshold particle diameters were 0.8 µm and 0.5 µm for large tracheobronchial and acini, respectively (i.e., the maximum particle diameter whose lung deposition is independent of flow rate).
3.2.3. Rsm analysis for 1.0–3.0 µm particles
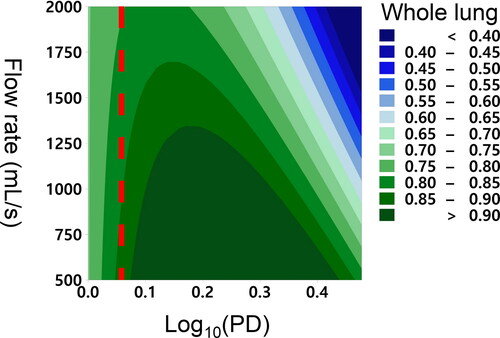
Face-centered RSM analysis was used and had an adjusted R2 value of 86.47%, which was acceptable. shows that lung deposition decreased with increasing flow rate and that the degree of the reduction is greater for larger particles. Increasing particle diameter enhanced lung deposition up to a point, but further increases in particle diameter reduced lung deposition. It was found that the threshold particle diameters were 1.2 µm for the whole lung.
Figure 4. Contour plots show the relationship between aerodynamic particle diameter (x-axis), flow rate (y-axis), and particle deposition (color boundaries) in the whole lung. The x-axis is in a log-10 scale of aerodynamic particle diameter (µm), and it ranges from 0.00 (1 µm) to 0.477 (3 µm). Red dashed lines represent the threshold particle diameters whose deposition is independent of flow rate below the diameter. The threshold aerodynamic particle diameter for whole lungs 1.2 µm.
3.2.4. Validating RSM model against analytical model
Threshold particle diameters were also found using the analytical lung particle deposition model. The threshold particle diameters were found to be 0.7 µm, 0.6 µm, and 1.5 µm for large tracheobronchial, acini, and whole lung deposition, respectively. Thus, there was a good agreement with the RSM results for large tracheobronchial airways (0.8 µm and 0.7 µm), acini (0.6 µm and 0.6 µm), and total lung deposition (1.2 µm and 1.5 µm). Threshold particle diameter for small tracheobronchial airways did not exist because its deposition rarely increased above 5%.
3.3. Effect of breath-holding duration
The results above indicated that particles with an aerodynamic diameter range of 0.1- 1.5 µm are minimally affected by flow rate. The effect of breath-holding duration on the particles was thus next quantified using RSM. It was found that the face-centered CCD had better goodness of fit (adjusted R2) and predictability (predicted R2) (Supplementary information 5). Hence, face-centered CCD was used for the analysis.
The breath-holding duration was shown to dramatically increase deposition in the acini. A similar pattern between whole lung deposition and acini deposition was observed (). This was expected because breathing-holding is known to have a marginal effect on tracheobronchial deposition (Inthavong et al. Citation2010), and this is shown in . Therefore, further analysis of tracheobronchial deposition was not conducted. It was observed that the effect of breath-holding is different for different particle sizes (). For instance, acini deposition of 0.1 µm particles increases less with increasing breath-holding time than that of 1.5 µm particles (). The increase in spacing between the contours in the y-axis for 0.1 µm particles in suggests that they become less sensitive to changes in breath-holding time as it increases. On the other hand, also suggests that deposition rate of 1.5 µm particles does not decrease with breath-holding time.
Figure 5. Contour plots show the relationship between aerodynamic diameter (x-axis), breath-holding time (y-axis), and particle deposition (color boundaries) in (a) large tracheobronchial (Large TB), (b) small tracheobronchial (Small TB), (c) acini, and (d) whole lung.
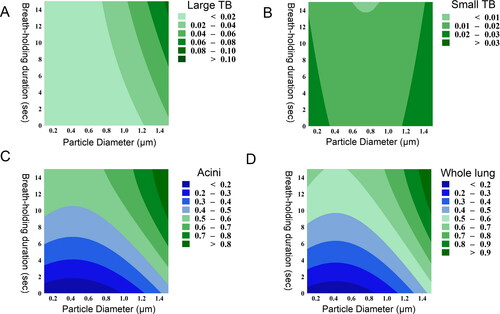
This may be explained by the difference in the mechanism of deposition; 1.5 µm particles are primarily deposited by sedimentation whose downward directional force (i.e., gravity) means particles deposit at a constant rate (assuming uniform particle dispersity in the airways), whereas 0.1 µm particles are deposited by diffusion whose random directional movement means that the deposition rate reduces as particle concentration reduces with breath-holding time. Sedimentation-driven deposition, on the other hand, is faster to achieve complete deposition. For instance, 1.5 µm particles reached over 90% whole lung deposition at 10 seconds of breath-holding (), whereas 0.1 µm only particles deposit approximately 60% at 10 seconds.
4. Discussion
Previous in vivo (Foord, Black, and Walsh Citation1978; Newman et al. Citation2000; Usmani, Biddiscombe, and Barnes Citation2005) and in silico (Koullapis et al. Citation2016) studies investigated the effect of particle size and flow rate on whole lung particle deposition in a one-factor at a time (OFAT) manner. Although the studies were able to describe the relationship between the multiple independent variables and the response qualitatively, they were unable to produce a statistically meaningful mathematical model of the relationship. These studies were thus unable to suggest the range of aerodynamic particle diameters whose deposition would be minimally influenced by the inhalation flow rate. The present study used RSM to describe the relationship between multiple factors (i.e., flow rate, breath-holding time, and particle aerodynamic diameter) and lung deposition. The findings from the current study are in good agreement with the qualitative findings from previous experimental studies. For instance, tracheobronchial deposition was found to increase with increased flow rate with larger particles disproportionately affected (Foord, Black, and Walsh Citation1978; Newman et al. Citation2000; Usmani, Biddiscombe, and Barnes Citation2005). Acini deposition increased when smaller particles (<3 µm) were inhaled at a low flow rate (Foord, Black, and Walsh Citation1978; Usmani, Biddiscombe, and Barnes Citation2005).
RSM modeling was subsequently used to predict the threshold aerodynamic particle diameter, above which deposition is influenced by flow rate. The predictions from RSM were firstly compared against the analytical lung particle deposition model and found to be in good agreement. RSM predicted that the aerodynamic particle diameter range over which whole lung deposition does not change with flow rate is 0.1–1.5 µm. This is in good agreement with various in vivo studies. For instance, Usmani, Biddiscombe, and Barnes (Citation2005) found that oropharyngeal deposition of 1.5 µm monodisperse particles was not affected by flow rate, whereas that of 3.0 µm and 6.0 µm particles were changed. This finding is also consistent with various in vivo studies using commercially available inhalers. Low-density particles whose mass median aerodynamic diameter (MMAD) is approximately 1.7 µm have shown consistent lung delivery regardless of changes in flow rate (Duddu et al. Citation2002). HFA pressurized inhalers (MMAD = 1.1 µm) had an insignificant difference in oropharyngeal deposition with a change in flow rate (Brand et al. Citation2008). Hence, particles with aerodynamic diameters in the range of 0.1–1.5 µm were found to have a reduced dependency of oropharyngeal deposition on flow rate and to deliver a consistent amount to the lungs.
RSM also predicted that particles with 0.1–0.5 µm aerodynamic diameters can achieve consistent drug particle delivery to all lung regions from low to very high flow rates. This is in good agreement with previous in silico findings. In large tracheobronchial airways where inertial impaction predominantly drives deposition (Cheng, Zhou, and Su Citation2015; Longest and Xi Citation2007), increasing flow rate can increase deposition (Ou, Jian, and Deng Citation2020). The degree of effect by flow rate, however, decreases in smaller particles. Ou, Jian, and Deng (Citation2020) found that the difference in deposition efficiency can reach up to 5% in 3.0 µm particles, while it is approximately 10-fold lower (up to 0.4%) in 1.0 µm particles. This further corroborates the finding that particles with aerodynamic diameters of approximately 1 µm deposit in the large tracheobronchial airways in similar amounts despite changes in flow rate.
There was, however, some disagreement with in vivo data. Usmani, Biddiscombe, and Barnes (Citation2005) found that 1.5 µm monodisperse particles showed increased central and intermediate deposition, while peripheral deposition was reduced with increased flow rate. This discrepancy is due to a limitation of the gamma scintigraphy method that it cannot differentiate particle deposition in tracheobronchial and acini airways. For instance, the intermediate and peripheral region does not represent tracheobronchial and acini airways, respectively, and the regions are comprised of both tracheobronchial and acini airways. The apparent discrepancy could be explained by faster alveoli expansion (Darquenne, Harrington, and Prisk Citation2009). Darquenne, Harrington, and Prisk (Citation2009) found that the alveoli expansion rate is faster at a high flow rate, and it increases particle deposition efficiency in the acini. Increased deposition efficiency disproportionately increases particle deposition in the intermediate region compared to in the peripheral region because of decreased particle availability in the periphery after increased deposition in the intermediate region. This would suggest that the decreased deposition in the periphery region observed in Usmani, Biddiscombe, and Barnes (Citation2005) does not necessarily mean decreased acini deposition. Decreased peripheral deposition may be a result of increased acini deposition in the intermediate region, which suggests that the results of the in vivo study (Usmani, Biddiscombe, and Barnes Citation2005) do not necessarily contradict the finding that 0.1–1.5 µm particles are independent of flow rate.
Improving the flow rate independence of particle deposition, however, compromises the deposition fraction delivered to the tracheobronchial airways, where the deposition in the region drops below 10% of emitted dose. Although this would be an issue for asthma or COPD inhaler treatments whose target regions are the tracheobronchial airways, tracheobronchial airways are the favored region of deposition compared to acini for systemic drug absorption. The acini region has higher drug permeability coefficients for most compounds, a larger surface area for drug absorption, and a slower clearance rate (Olsson et al. Citation2011). Reduced deposition in the tracheobronchial region is, therefore, favorable for systemic absorption of inhaled drug(s).
Particles with aerodynamic diameters between 0.1–1.5 µm deposit by sedimentation and/or diffusion, and hence, are dependent on breath-holding duration. It was found, however, that particles with smaller aerodynamic diameters were less sensitive to changes in breath-holding duration (). 0.1 µm was found to be an ideal target aerodynamic diameter to reduce differences in acini deposition in uncontrolled breathing (i.e., large variability in flow rate and breath-holding). However, 0.1 µm particles would be difficult to administer in practice due to high rates of agglomeration and the difficulties associated with consistently manufacturing particles of this size.
Particles whose deposition is sedimentation-driven represent a more practical alternative. It was shown that 1.5 µm particles could achieve flow rate independence () and near-maximum acini deposition at 10 seconds of breath-holding (). This suggests that with patient education on breath-holding alone, it would be possible to achieve greater dose consistency with targeted delivery to the lungs. Breath-holding is considerably easier to control consistently and accurately than flow rate using simple timers or counting protocols.
The findings of the study, however, are limited to the spherical shape and unit density of the particles. This particularly applies to particles whose deposition is diffusion-driven. Aerodynamic diameter includes factors that determine particle deposition in sedimentation and impaction. However, aerodynamic diameter does not describe the factors that determine diffusion-driven deposition, and thus the study assumes spherical shapes and unit density.
Although it is not within the scope of this study, the interaction between the device and the patient breathing profile can increase the variation in lung deposition and thus should be considered in clinical practice. Patients have different breathing profiles to different inhaler devices, which is pronounced in DPI devices. The resistance between the DPI devices varies greatly. The difference in resistance between DPI devices can lead to different patient-recorded breathing profiles (Benque and Khinast Citation2021). The findings, however, are unlikely to change despite variations in patient-recorded breathing profile because the variation in lung deposition due to flow rate for particles with a diameter below 1.5 μm were found to be minimal.
Emitted dose of DPI, including its amount and particle size distribution, also depends on the patient’s breathing profile. For instance, the negative pressure during inhalation determines the degree of de-agglomeration of powders and, in turn, influences the amount and the particles emitted from the inhaler (Kolanjiyil, Kleinstreuer, and Sadikot Citation2017). On the other hand, soft mist inhalers do not rely on patient breathing for aerosol emission. Thus, its emitted dose and particle size distribution are minimally affected by the patient breathing maneuver. Moreover, the mean velocity of aerosols from soft mist inhalers is significantly slower than the inhaled air velocity at the back of the mouth (Alatrash et al. Citation2019). Thus, soft mist inhalers are less prone to the device and patient breathing interaction.
Low variability is crucial for safe and efficacious peptide or/and protein therapy. A large variation in lung deposition, however, is an inherent issue that disincentivizes systemic peptide/protein delivery via the pulmonary route. This study found the optimal particle diameter that reduces the variability in lung deposition but has not yet shown the reduced variability in systemic drug exposure. In future studies, we plan to couple the whole lung deposition model with a pharmacokinetics model and study the effect of particle diameter and breathing characteristics on drug exposure of various peptide and protein drugs (e.g., insulin, growth hormone, and others).
5. Conclusion
In this study, an analytical whole lung particle deposition model and RSM were validated against experimental data and used to find the particle aerodynamic diameter for which lung deposition is minimally influenced by flow rate and breath-holding time. The RSM analysis predicted that lung deposition of 0.1–1.5 µm particles would be minimally affected by flow rate. The threshold diameter for the whole lung was found to be higher because a reduction in particle deposition in one lung region increases deposition in another region (and vice versa), making whole lung deposition less dependent upon flow rate. Particles of all sizes were found to be affected by breath-holding duration. 0.1 µm particles, whose deposition is diffusion-driven, would be ideal for reducing deposition variability in uncontrolled breathing conditions. Challenges associated with consistent manufacturing and agglomeration, however, would likely render such nanoparticulate formulations impractical. 1.5 µm particles represent a more practical alternative, enabling dose consistency and targeting of the acini region provided that the breath-holding duration is greater than 10 seconds. A consistent breath-holding time would be much easier to achieve through patient education than flow rate control, thereby hopefully helping to improve dose uniformity.
Supplemental Material
Download MS Word (1.8 MB)Notes
1 i.e. the diameter of a spherical particle having a density of 1000 kg m−3 and which settles in still air at the same velocity as the particle in question (DeCarlo et al. Citation2004).
References
- Alatrash, A., R. Mehri, N. Ogrodnik, E. Matida, and F. Fiorenza. 2019. Experimental study of Spiriva Respimat soft mist inhaler spray characterization: Size distributions and velocity. J. Aerosol Med. Pulm. Drug Deliv. 32 (5):293–302. doi:10.1089/jamp.2018.1501.
- Anjilvel, S., and B. Asgharian. 1995. A multiple-path model of particle deposition in the rat lung. Fundam. Appl. Toxicol. 28 (1):41–50. doi:10.1006/faat.1995.1144.
- Anselmo, A. C., Y. Gokarn, and S. Mitragotri. 2019. Non-invasive delivery strategies for biologics. Nat. Rev. Drug Discov. 18 (1):19–40. doi:10.1038/nrd.2018.183.
- Asgharian, B., W. Hofmann, and R. Bergmann. 2001. Particle deposition in a multiple-path model of the human lung. Aerosol Sci. Technol. 34 (4):332–9. doi:10.1080/02786820119122.
- Beeckmans, J. M. 1965. The deposition of aerosols in the respiratory tract: I. Mathematical analysis and comparison with experimental data. Can. J. Physiol. Pharmacol. 43 (1):157–72. doi:10.1139/y65-015.
- Benque, B., and J. G. Khinast. 2021. Estimating inter-patient variability of dispersion in dry powder inhalers using CFD-DEM simulations. Eur. J. Pharm. Sci. 156:105574. doi:10.1016/j.ejps.2020.105574.
- Borghardt, J. M., B. Weber, A. Staab, and C. Kloft. 2015. Pharmacometric models for characterizing the pharmacokinetics of orally inhaled drugs. AAPS J. 17 (4):853–70. doi:10.1208/s12248-015-9760-6.
- Borgstrom, L., E. Bondesson, F. Moren, E. Trofast, and S. P. Newman. 1994. Lung deposition of budesonide inhaled via Turbuhaler: A comparison with terbutaline sulphate in normal subjects. Eur. Respir. J. 7 (1):69–73. doi:10.1183/09031936.94.07010069.
- Brand, P., I. Friemel, T. Meyer, H. Schulz, J. Heyder, and K. Häuβinger. 2000. Total deposition of therapeutic particles during spontaneous and controlled inhalations. J. Pharm. Sci. 89 (6):724–31. doi:10.1002/(SICI)1520-6017(200006)89:6%3C724::AID-JPS3%3E3.0.CO;2-B.
- Brand, P., B. Hederer, G. Austen, H. Dewberry, and T. Meyer. 2008. Higher lung deposition with Respimat® Soft MistTM Inhaler than HFA-MDI in COPD patients with poor technique. Int. J. Chronic Obstruct. Pulm. Dis. 3 (4):763. doi:10.2147/COPD.S3930.
- Brand, P., C. Rieger, H. Schulz, T. Beinert, and J. Heyder. 1997. Aerosol bolus dispersion in healthy subjects. Eur. Respir. J. 10 (2):460–7. doi:10.1183/09031936.97.10020460.
- Chen, X., Y. Feng, W. Zhong, B. Sun, and F. Tao. 2018. Numerical investigation of particle deposition in a triple bifurcation airway due to gravitational sedimentation and inertial impaction. Powder Technol. 323:284–93. doi:10.1016/j.powtec.2017.09.050.
- Cheng, Y. S., Y. Zhou, and W. C. Su. 2015. Deposition of particles in human mouth–throat replicas and a USP induction port. J. Aerosol Med. Pulm. Drug Deliv. 28 (3):147–55. doi:10.1089/jamp.2013.1105.
- Darquenne, C. 2020. Deposition mechanisms. J. Aerosol Med. Pulm. Drug Deliv. 33 (4):181–5. doi:10.1016/j.jaerosci.2019.04.015.
- Darquenne, C., J. S. Fleming, I. Katz, A. R. Martin, J. Schroeter, O. S. Usmani, J. Venegas, and O. Schmid. 2016. Bridging the gap between science and clinical efficacy: Physiology, imaging, and modeling of aerosols in the lung. J. Aerosol Med. Pulm. Drug Deliv. 29 (2):107–26. doi:10.1089/jamp.2015.1270.
- Darquenne, C., L. Harrington, and G. K. Prisk. 2009. Alveolar duct expansion greatly enhances aerosol deposition: A three-dimensional computational fluid dynamics study. Philos. Trans. A Math. Phys. Eng. Sci. 367 (1896):2333–46. doi:10.1098/rsta.2008.0295.
- DeCarlo, P. F., J. G. Slowik, D. R. Worsnop, P. Davidovits, and J. L. Jimenez. 2004. Particle morphology and density characterization by combined mobility and aerodynamic diameter measurements. Part 1: Theory. Aerosol Sci. Technol. 38 (12):1185–205. doi:10.1080/027868290903907.
- Duddu, S. P., S. A. Sisk, Y. H. Walter, T. E. Tarara, K. R. Trimble, A. R. Clark, M. A. Eldon, R. C. Elton, M. Pickford, and P. H. Hirst. 2002. Improved lung delivery from a passive dry powder inhaler using an engineered PulmoSphere® powder. Pharm. Res. 19 (5):689–95. doi:10.1023/A:1015322616613.
- Foord, N., A. Black, and M. Walsh. 1978. Regional deposition of 2.5–7.5 μm diameter inhaled particles in healthy male non-smokers. J. Aerosol Sci. 9 (4):343–57. doi:10.1016/0021-8502(78)90037-X.
- Golshahi, L., M. L. Noga, R. Vehring, and W. H. Finlay. 2013. An in vitro study on the deposition of micrometer-sized particles in the extrathoracic airways of adults during tidal oral breathing. Ann. Biomed. Eng. 41 (5):979–89. doi:10.1007/s10439-013-0747-0.
- Häussermann, S., K. Sommerer, and G. Scheuch. 2020. Regional lung deposition: In vivo Data. J. Aerosol Med. Pulm. Drug Deliv. 33 (6):291–9. doi:10.1089/jamp.2020.29032.sh.
- Heyder, J., J. Gebhart, G. Rudolf, C. F. Schiller, and W. Stahlhofen. 1986. Deposition of particles in the human respiratory tract in the size range 0.005–15 μm. J. Aerosol Sci. 17 (5):811–25. doi:10.1016/0021-8502(86)90035-2.
- Hofmann, W., E. Pawlak, and R. Sturm. 2008. Semi-empirical stochastic model of aerosol bolus dispersion in the human lung. Inhal. Toxicol. 20 (12):1059–73. doi:10.1080/08958370802115081.
- ICRP. 1994. Human respiratory tract model for radiological protection. In ICRP Publication (Vol. 66). Ann. ICRP 24 (1–3), Ottawa, Ontario.
- Ingham, D. B. 1975. Diffusion of aerosols from a stream flowing through a cylindrical tube. J. Aerosol Sci. 6 (2):125–32. doi:10.1016/0021-8502(75)90005-1.
- Inthavong, K., L.-T. Choi, J. Tu, S. Ding, and F. Thien. 2010. Micron particle deposition in a tracheobronchial airway model under different breathing conditions. Med. Eng. Phys. 32 (10):1198–212. doi:10.1016/j.medengphy.2010.08.012.
- Kim, Y. H., Z. B. Tong, H. K. Chan, and R. Y. Yang. 2019. CFD modelling of air and particle flows in different airway models. J. Aerosol Sci. 134:14–28.
- Klonoff, D. C. 2014. Afrezza inhaled insulin: The fastest-acting FDA-approved insulin on the market has favorable properties. J. Diabetes Sci. Technol. 8 (6):1071–3. doi:10.1177/1932296814555820.
- Kolanjiyil, A. V., C. Kleinstreuer, and R. T. Sadikot. 2017. Computationally efficient analysis of particle transport and deposition in a human whole-lung-airway model. Part II: Dry powder inhaler application. Comput. Biol. Med. 84:247–53. doi:10.1016/j.compbiomed.2016.10.025.
- Koullapis, P. G., S. C. Kassinos, M. P. Bivolarova, and A. K. Melikov. 2016. Particle deposition in a realistic geometry of the human conducting airways: Effects of inlet velocity profile, inhalation flowrate and electrostatic charge. J. Biomech. 49 (11):2201–12. doi:10.1016/j.jbiomech.2015.11.029.
- Landahl, H. D. 1950. On the removal of air-borne droplets by the human respiratory tract: I. The lung. The Bulletin of Mathematical Biophysics 12 (1):43–56. doi:10.1007/BF02477345.
- Longest, P. W., and J. Xi. 2007. Computational investigation of particle inertia effects on submicron aerosol deposition in the respiratory tract. J. Aerosol Sci. 38 (1):111–30. doi:10.1016/j.jaerosci.2006.09.007.
- Lu, D., S. L. Lee, R. A. Lionberger, S. Choi, W. Adams, H. N. Caramenico, B. A. Chowdhury, D. P. Conner, R. Katial, S. Limb, et al. 2015. International guidelines for bioequivalence of locally acting orally inhaled drug products: Similarities and differences. AAPS J. 17 (3):546–57. doi:10.1208/s12248-015-9733-9.
- Mathews, P. G. 2005. Design of experiments with MINITAB (Vol. 446). Milwaukee, WI: ASQ Quality Press.
- Montesantos, S., I. Katz, J. Fleming, C. Majoral, M. Pichelin, C. Dubau, B. Piednoir, J. Conway, J. Texereau, and G. Caillibotte. 2013. Airway morphology from high resolution computed tomography in healthy subjects and patients with moderate persistent asthma. Anat. Rec. (Hoboken) 296 (6):852–66. doi:10.1002/ar.22695.
- Montesantos, S., I. Katz, M. Pichelin, and G. Caillibotte. 2016. The creation and statistical evaluation of a deterministic model of the human bronchial tree from HRCT images. PLoS One. 11 (12):18–21. doi:10.1371/journal.pone.0168026.
- Montgomery, D. C. 2017. Design and analysis of experiments. Hoboken, NJ: John Wiley & Sons.
- Newman, S. P. 2017. Drug delivery to the lungs: Challenges and opportunities. Ther. Deliv. 8 (8):647–61. doi:10.4155/tde-2017-0037.
- Newman, S. P., G. R. Pitcairn, P. H. Hirst, R. E. Bacon, E. O'Keefe, M. Reiners, and R. Hermann. 2000. Scintigraphic comparison of budesonide deposition from two dry powder inhalers. Eur. Respir. J. 16 (1):178–83. doi:10.1034/j.1399-3003.2000.16a29.x.
- Olsson, B., E. Bondesson, L. Borgström, S. Edsbäcker, S. Eirefelt, K. Ekelund, L. Gustavsson, and T. Hegelund-Myrbäck. 2011. Pulmonary drug metabolism, clearance, and absorption. Controlled pulmonary drug delivery, 21–50. New York: Springer. doi:10.1007/978-1-4419-9745-6.
- Ou, C., H. Jian, and Q. Deng. 2020. Particle deposition in human lung airways: Effects of airflow, particle size, and mechanisms. Aerosol Air Qual. Res. 20:2846–58. doi:10.4209/aaqr.2020.02.0067.
- Patton, J. S., C. S. Fishburn, and J. G. Weers. 2004. The lungs as a portal of entry for systemic drug delivery. Proc. Am. Thorac. Soc. 1 (4):338–44. doi:10.1513/pats.200409-049TA.
- Raabe, O. G., H. Yeh, G. M. Schum, and R. F. Phalen. 1976. Tracheobronchial geometry: Human, dog, rat, hamster – A compilation of selected data from the project respiratory tract deposition models. Report LF-53, Lovelace Foundation, Albuquerque, NM.
- Sakagami, M. 2020. In vitro, ex vivo and in vivo methods of lung absorption for inhaled drugs. Adv. Drug Deliv. Rev. 161:63–74. doi:10.1016/j.addr.2020.07.025.
- Usmani, O. S., M. F. Biddiscombe, and P. J. Barnes. 2005. Regional lung deposition and bronchodilator response as a function of β2-agonist particle size. Am. J. Respir. Crit. Care Med. 172 (12):1497–504. doi:10.1164/rccm.200410-1414OC.
- Yu, C. P. 1978. Exact analysis of aerosol deposition during steady breathing. Powder Technol. 21 (1):55–62. doi:10.1016/0032-5910(78)80107-7.