
 ?Mathematical formulae have been encoded as MathML and are displayed in this HTML version using MathJax in order to improve their display. Uncheck the box to turn MathJax off. This feature requires Javascript. Click on a formula to zoom.
Abstract
The Aerodyne aerosol mass spectrometer (AMS) is used extensively to measure the chemical composition of non-refractory submicron aerosol particles for laboratory and atmospheric field studies. Typical AMS calibration methods are mass-based, involving generating pure or mixtures of particles with a known size and number concentration. Here we present a new calibration method using a heated platinum/molybdenum catalyst-based conversion technique that provides an independent measurement of reactive nitrogen (Nr) and total organic carbon (Cy) traceable to gas-phase standards of nitric oxide (NO) and carbon dioxide (CO2), respectively. The calibration method was tested using dried particles composed of pure ammonium nitrate (AN), other ammonium salts, and nitrogen-containing organic species. The nitrate ionization efficiencies determined with the AMS single particle or Nr calibration methods matched within experimental uncertainties (±15%). By measuring the AMS lens transmission efficiency and incorporating light-scattering measurements of the AMS collection efficiency, the catalyst method independently showed that the AMS relative ionization efficiency (RIE) for ammonium was essentially the same among different ammonium containing compounds (±9%), regardless of the corresponding anion and stoichiometry, quantifying support of a major assumption inherent in AMS calibrations. The Nr and Cy measurements were used to calibrate the RIE for 4-nitrocatechol (1.1 ± 0.4), isosorbide mononitrate (1.2 ± 0.1) and triammonium citrate (2.1 ± 0.2), which were within the range of organic RIEs used in AMS quantitation. The combined catalyst system provided more accurate measurements of the elemental carbon-to-nitrogen ratios than the high-resolution AMS elemental analysis using the Improved-Ambient method plus the inorganic nitrogen.
Editor:
1. Introduction
The Aerodyne Aerosol Mass Spectrometer (AMS) and Aerosol Chemical Speciation Monitor (ACSM) instruments measure the real-time, non-refractory, chemical composition of aerosol particles and have been deployed by a multitude of institutions for ambient air measurements all over the world (Jayne et al. Citation2000; Drewnick et al. Citation2005; DeCarlo et al. Citation2006; Canagaratna et al. Citation2007; Ng et al. Citation2011; Fröhlich et al. Citation2013; Jimenez et al. Citation2016). Data from these projects have provided new insights into the composition, origin, and fate of atmospheric aerosol particles and their potential effects on climate and air quality.
Considerable research has gone into the calibration and validation of the AMS and ACSM techniques; however, uncertainties still remain, particularly with regard to measurement of particles with differing morphologies, phase, and volatility as well as the quantification of particulate organic compounds (Xu et al. Citation2018; Katz et al. Citation2021). Typical AMS and ACSM calibrations have relied on other well-calibrated aerosol instrumentation such as differential mobility analyzers with aerosol counting and optical sizing measurements to provide a known mass concentration of aerosol species to compare with the AMS or ACSM instrument response (Ng et al. Citation2011). A key fundamental issue even for the standard ammonium nitrate (AN) calibrations is that particles need to be in the appropriate size range to be transmitted through the AMS or ACSM aerodynamic focusing lens, requiring the ability to generate calibration particles which have a correct, known size and number concentration. If the size-classified particles are not monodispersed and are not properly measured as part of the mass distribution, this further complicates the calibration quantification.
The relative ionization efficiency (RIE) of other species is referenced to the ionization efficiency of nitrate from the standard AN calibration. The default RIE values for the standard AMS species (ammonium, nitrate, sulfate, chloride, and organics) have been determined experimentally (Canagaratna et al. Citation2007; Jimenez et al. Citation2016) and work well under typical ambient atmospheric conditions. The RIE of ammonium is determined from the AN calibration particles, by comparing the signal for ammonium to the signal for nitrate and a 1:1 stoichiometry between ammonium and nitrate ions. Calculations of RIE for sulfate and chloride have been done using ammonium sulfate and ammonium chloride particles, assuming complete charge balance between ammonium and the anions and that the RIE for ammonium in sulfate and chloride particles is the same as for ammonium in nitrate particles. However, this assumption has not been verified with independent measurements of ammonium. Recent efforts to model the ionization of molecules within the AMS have found that molecular weight and thermal decomposition mechanisms can impact the RIE of a species (Drewnick et al. Citation2015; Jimenez et al. Citation2016; Murphy Citation2016a; b). Additionally, indoor air studies (cooking emissions) and laboratory-based studies have found discrepancies in the RIE of organics (Xu et al. Citation2018; Chen et al. Citation2019; Katz et al. Citation2021), indicating the need for further investigation into the RIE for a variety of species.
In addition to the RIE, the collection efficiency (CE) also affects the fraction of particles in a given sample that the AMS detects. While the RIE is due to ionization within the source, the major factor contributing to CE (after accounting for lens transmission efficiency (TElens) (Liu et al. Citation1995)) is an artifact of bounce off of, and differences in, the thermal vaporizer. These effects have been arguably well studied (Huffman et al. Citation2005; Matthew, Middlebrook, and Onasch Citation2008; Middlebrook et al. Citation2012; Docherty et al. Citation2013), and many users apply a blanket 50% CE (Canagaratna et al. Citation2007) or use the composition-dependent parameterization in the standard AMS analysis software (Middlebrook et al. Citation2012) to account for the particle bounce issue in ambient atmospheric measurements. Light scattering measurements available on some AMS instruments can allow measurement of the CE for each species related to particle bounce, reducing this source of uncertainty (Cross et al. Citation2007; Cross et al. Citation2009; Liao et al. Citation2017).
Several studies have examined the response of the AMS to N-containing organic compounds. Aiken, DeCarlo, and Jimenez (Citation2007) describe the use of the AMS to get elemental composition of aerosol particles, particularly C:N ratios (or N/C as reported in Aiken et al.). A range of N-containing organic compounds were analyzed with this method. The measured and actual N/C were well correlated but the measured ratio underestimated the actual N/C by about 20%. Aiken et al. (Citation2008) expanded on their previous work by including fulvic acids and a wider range of amino acids, and found that the N/C ratios obtained by AMS were closer to the actual ratios (slope of 0.96) and the overall relative errors were about 22%.
New methods have been developed to measure aerosol nitrogen (N) and carbon (C) mass for direct calibration of particle instrumentation (e.g., particle into liquid samplers, PILS) for a variety of species pertinent to the atmosphere (Stockwell et al. Citation2018). Total carbon TC is defined as the sum of carbon dioxide (CO2), carbon monoxide (CO), methane (CH4), and all organic carbon in both the gas and aerosol phases. TC has an operational definition since it is measured by catalytic conversion of all carbon (CO, CH4 and organic carbon) to CO2, with subsequent detection by non-dispersive infrared spectrometry or cavity ring-down spectroscopy. Total organic carbon (Cy) is arrived at by subtracting CO2, CO and CH4 from a TC measurement, and is of interest in atmospheric chemistry because those are the carbon compounds that are most involved in oxidant and particle formation in the atmosphere (Heald et al. Citation2008; Heald and Kroll Citation2020). Measurements of Cy in ambient air are rare because of the difficulty in separating or subtracting CO2, CO, and CH4 analytically (Roberts et al. Citation1998; Maris et al. Citation2003; Yang and Fleming Citation2019; Hayden et al. Citation2022).
Total reactive nitrogen (Nr) measurements are, in practice, much easier than Cy measurements because good catalytic techniques exist to convert all N compounds except N2 and N2O, to nitric oxide (NO) (e.g., NH3, amines, nitriles, nitrates and particle phase inorganic and organic N-compounds) (Marx et al. Citation2012; Stockwell et al. Citation2018; Roberts et al. Citation2020). Moreover, sensitive and precise techniques for measuring low levels of NO are readily available. As a result, precise Nr measurements of particle streams at atmospherically relevant concentrations are possible (Stockwell et al. Citation2018). In practice, few measurements of Nr have been reported in ambient air (Benedict et al. Citation2013; Prenni et al. Citation2014; Benedict et al. Citation2017), and it is not considered a routine or standard measurement. Studies of the Nr content of wildfire emissions have been performed that have allowed a Nr budget to be assessed (Roberts et al. Citation2020; Juncosa Calahorrano et al. Citation2021; Lindaas et al. Citation2021). A precursor study (Stockwell et al. Citation2018) reported the use of Nr measurements to calibrate Nr in particles analyzed by instruments employing physical methods (particle number and size) and by Particle-into-Liquid Sampling (PiLS) with Electrospray Ionization Mass Spectrometry. Another study (Washenfelder et al. Citation2022) used preliminary results from this work for calibration of 4-nitrocatechol tracer ion signals at m/z 139 (C6H5NO3+) and m/z 155 (C6H5NO4+), demonstrating the applicability of using the gas-traceable catalyst system for calibrations without needing to separately measure the mass concentrations from external aerosol instruments.
The objective of this study was to utilize the Nr and Cy measurement techniques to provide a new, independent means to calibrate AMS instrumentation. We used a unit-mass-resolution AMS with a light-scattering module to measure the collection efficiency and a high-resolution AMS to distinguish elemental composition for direct comparisons with the catalyst-based conversion technique. This technique provides aerosol mass calibrations traceable to gas-phase standards, and clearly addresses some AMS calibration issues associated with generating particles of known composition, size, density, and shape. Here we present the results of experiments using aerosols composed of ammonium salts or molecules containing both carbon and nitrogen species. The organic RIE of those carbon-containing species was determined.
2. Methods
For the experimental setup (see Figure S1 in the online Supplemental Information (SI)), a peristaltic pump (Ismatec, model 7619-40, Chicago, IL) drew the compound solution (typically 10-15 mg solute/ml deionized water) to a lab-built atomizer block (similar to a TSI Incorp. Model 3076 Constant Output Atomizer, Shoreview, MN). Ultra-zero grade air carrier gas (Airgas, Radnor, PA) was sent to the atomizer block with a split to an adjustable dilution flow for concentration control. Aerosols were dried with a Nafion dryer (Perma Pure, model PD-50T-24MPS, Toms River, NJ), and then the charge distribution was neutralized with a Po-210 static eliminator (NRD Nuclecel, model P-2031, Grand Island, NY).
Dried and charge-neutralized aerosols were size-selected with a centrifugal particle mass analyzer (CPMA; Cambustion, Cambridge, UK). An additional stainless steel particle filter (Swagelok SS-4F-7, 7 micron) filled with approximately 3 grams of granular soda lime (CaHNaO2) was added to the pressure equilibration line in the CPMA to prevent a small amount of ambient CO2 from entering the system (see Section S1). For a couple of the experiments, a custom-built differential mobility analyzer (DMA) with a filtered, recirculating sheath flow was used to size select particles instead of the CPMA, and additional dilution air was added to the flow after the DMA.
A set of three denuders were placed in series in the sampling system to scrub gas-phase species from the aerosol stream. Two of these were multi-channel, etched glass, annular denuders (URG, model 2838, Chapel Hill, NC), coated with either sodium carbonate or citric acid to remove acidic and basic gases, respectively. The third denuder consisted of activated carbon strips and removed organic gas-phase species (Brechtel Manufacturing Inc., DE denuder package, Hayward, CA).
After the denuders, the aerosol stream was sampled by several instruments including the catalyst system, two AMS instruments, an ultrafine condensation particle counter (CPC; TSI Inc., model 3025 A, Shoreview, MN), and a slightly-modified ultra-high sensitivity aerosol spectrometer (UHSAS; Droplet Measurement Technologies, Boulder, CO; (Kupc et al. Citation2018)). The standard AMS lens transmission efficiency (TElens) (Liu et al. Citation1995) was applied to the UHSAS volume distributions to calculate the volume fraction sampled by the AMS compared to the UHSAS as a proxy for the catalyst. For most experiments, particles were sized such that the calculated volume transmitted by the AMS lens was close to 100%. If it was less than this, the catalyst measurements were reduced accordingly to compare with the AMS lens transmitted data.
The methods used for catalytic conversion of C and N are based on the work of Stockwell et al. (Citation2018), with some additions and refinements as discussed below. The high-temperature catalyst system consisted of a quartz tube (12.7 mm OD x 10.7 mm ID x 35 cm L) packed with 36 platinum (Pt) screens (Shimadzu, Part No. 630-00105). It was found that a high temperature (850 °C) was required to achieve complete conversion of CH4 to CO2 at the flow rates (up to 1.5 SLPM) used in the experiments. The catalyst was heated by an external coil of NiCr heating wire, with the temperature measured at the halfway point on the outside surface of the tube. The Pt screens were confined to an 8 cm long section by dimples in the quartz tube, in a section positioned so that the gas had been equilibrated to 850 °C. The sample stream exiting the Pt catalyst contains both NO and NO2, as catalysts of this kind are also known to partially oxidize NO to NO2 (Schwab et al. Citation2007). So, the Nr system was fitted with a molybdenum oxide (MoOx) catalyst to convert the NO2 back to NO. The MoOx catalyst consisted of a solid molybdenum tube (4.2 mm ID x 32 cm L) operated at 450 °C, to which an 8 SCCM flow of hydrogen (Airgas, Radnar, PA) was added to provide a stable molybdenum oxide surface. The NO exiting the MoOx catalyst was measured by NO-O3 chemiluminescence as described previously (Williams et al. Citation1998).
The Cy measurement was accomplished with a commercial 4-channel cavity ringdown spectrometer that measures CO2, CO, CH4, and H2O (Picarro, model G2401, Santa Clara, CA). Catalytic conversion of atmospherically relevant levels of organic aerosol particles under well-controlled conditions in a stream of zero air produces small amounts of CO2 in the carrier gas measured as Cy. Unfortunately, commercially available instruments for measuring CO2 are geared toward atmospherically relevant mixing ratios, e.g., CO2 > 400 ppmv, so Cy measurements on particle streams normally require high concentrations (100’s of μg/m3) relative to ambient particle concentrations (Stockwell et al. Citation2018).
A high-resolution time-of-flight aerosol mass spectrometer and a light scattering compact time-of-flight aerosol mass spectrometer (HR-ToF-AMS and LS-C-ToF-AMS; hereinafter referred to as HToF and CToF for short; Aerodyne Research Inc., Billerica, MA) were utilized in this study. Both AMS instruments have the same basic operating principles described previously (Jayne et al. Citation2000; Drewnick et al. Citation2005; Canagaratna et al. Citation2007). The light scattering module in the CToF detects particles as they transit a laser beam for measuring size and to calculate CE (Cross et al. Citation2007; Liao et al. Citation2017).
There were four ammonium compounds sampled in this study, including ammonium nitrate (Sigma-Aldrich, >99%, CAS 6484-52-2), ammonium sulfate (Sigma-Aldrich, >99%, CAS 7783-20-2), ammonium bisulfate (Sigma-Aldrich, >99%, CAS 7803-63-6), and triammonium citrate (Sigma-Aldrich, >97%, 3458-72-8). Additionally, we used two other compounds containing both carbon and nitrogen: 4-nitrocatechol (Sigma-Aldrich, >97%, CAS 3316-09-4) and isosorbide mononitrate (Alfa Aesar, >98%, CAS 16051-77-7). Calibration details for all the instruments are included in the SI (Sections S2-S5).
2.1. Calculating AMS mass concentrations, IEs and RIEs
The variables required to convert the ion rate of a sampled species (IS) in the AMS to mass concentration (CS) are shown in EquationEquation (1)(1)
(1) (Jimenez et al. Citation2003; Canagaratna et al. Citation2007), and include Avogadro’s number (NA, 6.022e23 molec/mol), the sample flow rate (Q, in cm3/s), the molecular weight of nitrate (MWNO3, in g/mol), the ionization efficiency of nitrate (IENO3, in ions/molecule, measured at NO+ and NO2+), the relative ionization efficiency of the species (RIES), and the collection efficiency of the species (CES). NA and MWNO3 are known quantities, while Q, IENO3, RIES, and CES need to be calibrated, measured or estimated.
(1)
(1)
IENO3, then, is the fundamental quantity for all species that needs to be determined in order to convert the AMS ion signal to mass concentration. The typical mass-based method for calculating IES for any species is:
(2)
(2)
where MWS is the molecular weight of the species, #/cc is the particle number concentration, dp is the particle diameter, ρp is the particle density, S is the Jayne shape factor, π/6 converts dp3 into volume, and 10−21 converts nm3 to cm3.
For this work, we do not include IENO3 determinations using the mass-based method from the size and particle counts as there were challenges with externally determining the size accurately (note dp is cubed in the denominator) and there were often times multiply-charged particles transmitted through the size selection instruments. We found that the sizes of ammonium nitrate particles measured by the AMS were different from the sizes selected by the CPMA. Also, the CPMA transmitted large numbers of small, uncharged particles which influenced the CPC counts and calculating the sampled mass. In most cases, this effect did not significantly influence the actual mass sampled.
Instead of the sizing and counting mass-based method for determining the mass sampled by the AMS, we used the Nr measurements to calculate the molecular flux rate:
(3)
(3)
where ppbin is the known input mixing ratio from the Nr measurement, (nN/molec) is the number of nitrogen atoms per molecule, Vm,S is the molecular volume of the species (Vm = 22.41 L/mol at Pstd = 1 atm and Tstd = 273.15K), and 10−12 converts from ppb and cm3 to liters. As mentioned above, the measured Nr mixing ratios were reduced by the calculated lens TE if it was significant. IES is then the slope of a linear fit of the total ion signals in Hz versus the Nr molecular flux rates. For ammonium nitrate, the number of moles of ammonium equals the number of moles of nitrate and hence nN/molec = 2.
Another way to determine IENO3 is by using the AMS single particle data from ammonium nitrate particles. In this case, the m/z 30 and m/z 46 ion signals from individual particles are divided by the number of molecules per particle:
(4)
(4)
(5)
(5)
The ions are calculated from the background subtracted single particle signals obtained with the brute force single particle (BFSP), light scattering single particle (LSSP) or event trigger single particle (ETSP) modes during data acquisition. Typically, the particle diameter dp from a particle sizing instrument is used to calculate the number of molecules per particle (EquationEquation (5)(5)
(5) ). When dva is substituted for dp (dp = dva/(ρp/ρ0*S), where ρ0 is unit density) the internal AMS measurements of dva can be used for EquationEquation (5)
(5)
(5) . IENO3 can then be determined from polydisperse AMS single particle data by plotting multiple IPP30 + 46 events versus the cube of their dva (in nm), resulting in IENO3 from the slope multiplied by a conversion factor of 0.48 (= MWAN*6/
/NA*1021*ρp2*S2/ρ03) (see SI in Franchin et al. Citation2018). The details of how this was accomplished with the AMS single particle data are shown in the SI.
The AMS mass concentration calculations can be rearranged and simplified as follows to determine the relative ionization efficiency for another species (RIES) relative to the nitrate ions (m/z 30 + m/z 46):
(6)
(6)
Here, the collection efficiency of the species (CES) needs to be known so that it is taken into account for the actual RIES. CES for all species were measured with the light-scattering CToF AMS as described in prior work (Cross et al. Citation2007; Liao et al. Citation2017) and in the SI. The equation above is then used to determine RIES from any nitrogen-containing particles by comparing the measured AMS ions with independent measurements of nitrogen using the Nr method. For the organic RIE calculations, the total AMS organic ions were determined using the default fragmentation table pattern values for H2O and CO relative to CO2 (Aiken et al. Citation2008).
The AMS internally-consistent equation for determining RIENH4 with ammonium nitrate (i.e., using only AMS derived values of ammonium and nitrate, and where both the CE and the ammonium/nitrate mole ratio are 1; see Section S2.3) is:
(7)
(7)
These internally-derived RIENH4 values from ammonium nitrate were then directly compared with values of RIENH4 determined from other ammonium-containing species using the Nr method with EquationEquation (6)(6)
(6) .
The total nitrogen measured by the AMS (NAMS) for any nitrogen-containing compound is calculated by summing the organic nitrogen (NOrg), the nitrate nitrogen (NNO3), and the ammonium nitrogen (NNH4):
(8)
(8)
The organic nitrogen content (N:C ratio) and the organic mass to organic carbon mass ratio (OM:OC) were determined using the default fragmentation patterns for organic species and the default suggested coefficients for the Improved-Ambient method in the Elemental Analysis package of the AMS analysis software (Aiken, DeCarlo, and Jimenez Citation2007; Aiken et al. Citation2008; Canagaratna et al. Citation2015). The RIEOrg and RIENH4 values obtained with the nitrogen catalyst were used for the organic and ammonium mass concentrations (COrg and CNH4), respectively.
The AMS carbon mixing ratio (CAMS) was determined by a modified version of EquationEquation (8)(8)
(8) , neglecting the N:C ratio from elemental analysis, with CNH4 and CNO3 equal to zero, and two different ways to determine the carbon from the organic portion. The first is by using the OM:OC from the elemental analysis and the other is where the OM:OC ratio is replaced with the molar ratio of carbon per molecule and MWC is replaced with the molecular weight of the species. The slope of a linear plot of carbon mixing ratio versus total nitrogen mixing ratio with an intercept forced through zero is the AMS total C:N ratio. The methods for these calculations are fully described in the SI (Section S2.5).
3. Results and discussion
3.1. Ionization efficiency for nitrate
Since the AMS response to nitrate (IENO3) is a fundamental quantity needed for AMS quantification, we first compared IENO3 values determined with the Nr-based and AMS single-particle methods with ammonium nitrate particles. The data from Experiment 11-AN (i.e., the 11th ammonium nitrate experiment) are shown in , where the AMS CToF ion signal from m/z 30 + m/z 46 (in Hz) is plotted versus the nitrate molecular sampling rate (in molecule Hz) determined from the Nr instrument. Individual data points are shown for the Nr data and IENO3 is determined from the slope of the linear regression line according to EquationEquations (2)(2)
(2) and Equation(3)
(3)
(3) . Additional lines are shown calculated from the AMS Brute-Force Single Particle (BFSP) and Light-Scattering Single Particle (LSSP) IENO3 determinations (see SI and Figure S3a), indicating that all three methods compare well (within ±5%) for this experiment.
Figure 1. The (a) three IE nitrate calibrations for the CToF AMS and (b) comparisons of IE nitrate from the AMS single particle methods with the Nr method for multiple experiments and AMS instruments.
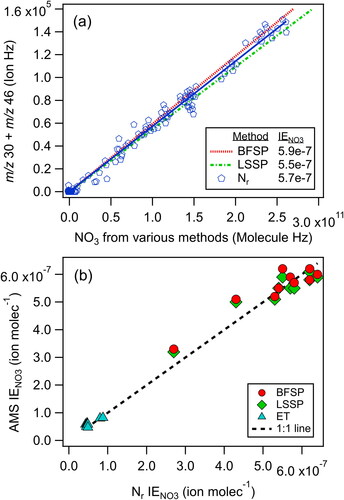
IENO3 measured for several AMS single particle experiments with one CToF and two different HToF instruments are shown with the corresponding IENO3 from the Nr method in and Tables S1 & S2. Note that the IENO3 values via the event trigger (ET) single particle data from the HToF instruments were measured/calculated for the longer pulser time period (40 us) associated with HR data, and are lower than the CToF which has a shorter pulser period (16 us). All of the IENO3 values were consistent (within 12%) between the Nr, BFSP, LSSP, and ET methods, which is similar to the 10% uncertainty typically cited for IE (e.g., Bahreini et al. Citation2009) and within our 15% uncertainty in IE standard calibrations including uncertainties in the AMS dva sizing. These two independent methods provide essentially the same results within experimental uncertainties, demonstrating the utility of the Nr method for measuring AMS mass concentrations of AN.
Table 1. Ammonium RIE values determined from ammonium nitrate with the internally-consistent calculation (EquationEquation (7)(7)
(7) ) and for other ammonium compounds using the external Nr measurements (EquationEquation (6)
(6)
(6) ).
Table 2. Sizes selected from the CPMA, calculated lens transmission (TElens), and collection efficiency (CE), used to determine the relative ionization efficiencies (RIEorg) for organic compounds containing nitrogen.
3.2. Ammonium RIE
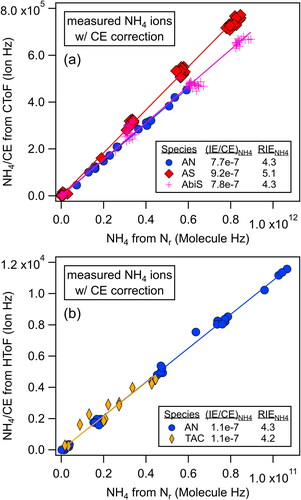
Plots of the ammonium signals from the AMS corrected for CE and the molecules of ammonium measured by the Nr instrument adjusted for the lens TE are shown in for different ammonium-containing particles. The results of these and additional experiments are shown in . For ammonium bisulfate (AbiS) and triammonium citrate (TAC), the RIENH4 values were within +/-5% of the values determined from AN particles either on the same day or within a few days. The RIENH4 values for ammonium sulfate (AS) were about 20% higher than the corresponding values from AN particles.
Figure 2. Scatter plots of the AMS NH4 ions/CE versus NH4 molecules from the Nr method for various ammonium compounds: (a) ammonium nitrate (AN, CE = 1), ammonium sulfate (AS, CE = 0.35), and ammonium bisulfate (AbiS, CE = 0.62) from the same day with the CToF, and (b) ammonium nitrate (AN, CE = 1) and triammonium citrate (TAC, CE = 0.6) from consecutive days with the HToF. RIENH4 is calculated with EquationEquation (6)(6)
(6) using the slopes of these lines (= (IE/CE)NH4) and the corresponding IENO3 using the Nr method from the AN part of the experiment.
The stability and variability in the ammonium content relative to the corresponding anions were observed during the course of a single day while sampling AN, AS, and AbiS particles consecutively (experiment 9-AN-AS-AbiS). The calculated nitrogen mixing ratios for the CToF AMS instrument and the Nr catalyst are shown in for this experiment using the RIENH4 values in . The RIENH4 value of 5.1 from the AS particles was used to calculate an RIESO4 of 1.0 from AS assuming complete charge balance (moles of ammonium = 2 x moles of sulfate). This RIESO4 was applied to the data from the AbiS particles using its RIENH4 value of 4.3. The NH4+-to-anion mole ratios (= moles of ammonium divided by moles of nitrate or sulfate) were calculated from the mass concentrations for all three species and are shown in .
Figure 3. Time series of (a) nitrogen (ppbv) as measured by the Nr and CToF instruments during experiment 9-AN-AS-AbiS along with (b) the NH4+-to-anion mole ratio using the RIENH4 values determined with the Nr method and an internally-consistent RIESO4 value from the AS particles. The time periods for ammonium nitrate, ammonium sulfate, and ammonium bisulfate sampling are marked below the time axis.
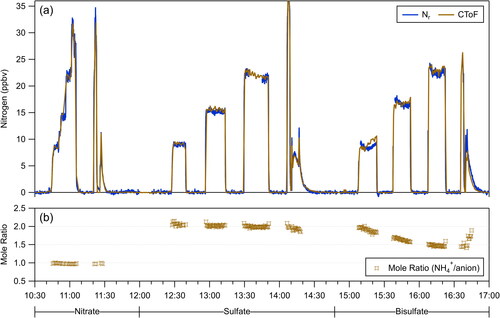
Because the RIE ratio definitions are based on charge balance of anions-to-cations for AN and AS particles, those particles have NH4+-to-anion mole ratios near their expected values of 1 and 2, respectively. Slight changes are observed while rinsing out the aerosol generator between solutions. In contrast, the AbiS particles have a varying NH4+-to-anion mole ratio. The most likely explanation for this ratio decreasing for AbiS particles is that there was residual ammonium in the system being taken up by the AbiS particles during the course of sampling.
Here, we demonstrated that the relative amount of the corresponding anion does not need to be known to determine RIENH4 for the various ammonium-containing particles (AS, AbiS, and TAC) with the catalyst method. Assuming the RIESO4 was transferable from AS to AbiS, the ammonium-to-sulfate mole ratio was higher than expected for AbiS (1) and variable up to 2 (expected for AS). There was not an independent corresponding catalyst total sulfur measurement to validate the transferability of RIESO4. Nevertheless, the AMS instrument showed variations in the ammonium-to-sulfate mole ratio for AbiS as the ammonium content varied during the experiment and during the rinse period.
The Nr measurements confirmed that the experimentally determined RIENH4 in AMS instruments is larger than predicted for electron impact ionization of gas phase ammonia (Murphy Citation2016a). While this provides more information on the processes occurring within the vaporization/ion source of AMS instruments, further research is needed to fully explain this observation. This is also the first time that a rapid, independent, external measurement of aerosol nitrogen has verified that the AMS sensitivity to ammonium is generally transferable to other ammonium salts regardless of the corresponding anion. This provides more confidence in the quantitation of ammonium in ambient and other measurements with AMS (and ACSM) instruments (Murphy Citation2016b).
3.3. RIE of organic compounds containing nitrogen
The three nitrogen containing organic compounds selected for this study were 4-nitrocatechol (4-NC, C6H5NO4, a nitro-organic), isosorbide mononitrate (IMN, C6H9NO6, an organic nitrate), and triammonium citrate (TAC, C6H17N3O7, a carboxylic acid ammonium salt). These compounds were selected to represent a range of N-functionalities in compounds that are water-soluble so that organic solvents could be avoided. The average unit mass resolution mass spectra for each of these compounds are shown in Figures S7–S9, indicating that all three species have nitrogen at the nitrate or ammonium m/zs.
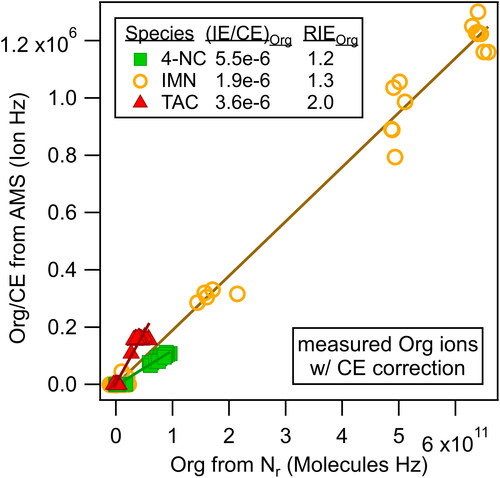
The total numbers of organic ions measured by the AMS plotted versus the number of molecules sampled with the Nr instrument are shown in for the three compounds. The RIEorg for each species were then calculated from the slopes of the linear fits (= (IE/CE)org) according to EquationEquation (6)(6)
(6) and are included in . Due to differences in molecular fragmentation upon thermal vaporization and electron impact ionization, the molecular weights of each species were adjusted to mainly the species that were likely measured as organic ion signals in their mass spectra (MWorg,S) (Figures S7–S9). The molecular weight of the primary carbon species in TAC (C6H5O7, MWorg,TAC = 189 g/mol) was used since nitrogen was measured as ammonium ions and TAC had no nitrogen in the measured organic ion signal as shown in Section 3.4.2. Expected fragmentation of IMN by the thermal vaporizer of the AMS may retain the C-O bond and IMN does not contain C-N bonds, leading to the reduction of its molecular weight by NO2 (C6H9O4, MWorg,IMN = 145 g/mol). For 4-NC, there was a combination of inorganic nitrate signal and nitrogen-containing organic ion signal (see Section 3.4.2 and Figure S7 that shows the parent ion at m/z 155), so we reduced the molecular weight by two oxygens (C6H5NO2, MWorg,4-NC = 123 g/mol) to roughly account for it.
Figure 4. Scatter plot of the organic ions/CE versus molecules from the Nr method to determine the organic relative ionization efficiencies of 4-nitrocatechol (4-NC), isosorbide mononitrate (IMN), and triammonium citrate (TAC).
The number of molecules sampled for 4-NC and IMN were directly measured with the Nr mixing ratio measurement according to EquationEquation (3)(3)
(3) . Using the direct measurement was possible because the ratio of carbon-to-nitrogen was preserved in the molecules (see Cy:Nr ratios in and Figures S10–S11) and these two species contain one atom of nitrogen per molecule. In contrast, the TAC was expected to have three nitrogen atoms per molecule and yet the measured Cy:Nr ratios were much greater than that ( and Figure S12). Hence, the measured Cy:Nr ratios were used to calculate RIEorg for TAC and it was assumed that the number of carbons per TAC molecule remained 6.
Table 3. Elemental C:N ratios from the catalyst system Cy:Nr and from the HToF AMS for organic compounds containing nitrogen.
All of the RIEorg values in are generally within the range of 1.6 ± 0.5 (2*sigma) expected for most organic species with average carbon oxidation states between −1 and 0.5 (Xu et al. Citation2018). The RIEorg values for 4-NC averaged 0.9 ± 0.3, yet the value for the 3-4NC experiment (0.61) was likely low due to the age of the microchannel plate detectors, which had a lower sensitivity for that experiment. The average of the other three RIEorg values for 4-NC was 1.0 ± 0.2. Only one experiment had the appropriate measurements to obtain RIEorg values for IMN, which were 1.31 and 1.11 for the CToF and HToF instruments, respectively. However, this molecule was quite sticky in the system and only unsized particles were used which leads to uncertainty in the actual lens transmission efficiency (TElens).
The RIEorg values for TAC (averaging for the sized particles 2.0 ± 0.2) are somewhat higher than the others. This is possibly due to the inability of the AMS to effectively measure all of the ions generated from the citrate portion of the molecule. Obtaining an RIE for the citrate moiety is inherently difficult for the AMS in air due to the high degree of fragmentation to m/z 44 and 28 from the three carboxylic acid groups, and the precise reason behind the higher RIEorg values for TAC is beyond the scope of this paper.
3.4. Elemental analysis of organic compounds containing nitrogen
3.4.1. Cy:Nr results
The elemental ratios from the catalyst system are shown in and Section S8. With 4-NC, the ratio of Cy carbon to Nr nitrogen atoms was 5.9 from three experiments, which is the value expected from the molecular formula (C6H5NO4) well within uncertainties (±5%). The average ratio of the carbon to nitrogen atoms for IMN was 6.1 from three experiments, essentially the same as the value expected from the molecular formula (C6H9NO6). Prior work by Stockwell et al. (Citation2018) also showed that the measured Cy/Nr ratios with this technique were the same as the molecular formulae for four other species: L-threonine (C4H9NO3), anthranilic acid (C7H7NO2), tryptophan (C11H12N2O2), and quinine (C20H24N2O2).
In contrast to these compounds, the Cy:Nr ratio was not 2:1 as expected for TAC (C6H17N3O7). In fact, this ratio was typically not stable and much higher, ranging from 5.3 to 8.5. For the sized particle experiments, the Nr measurement of nitrogen and the AMS measurements of ammonium independently agreed well for TAC (). Hence, the absolute amount of ammonium appeared to be measured correctly with both methods. Cy:Nr ratios greater than 2:1 indicate that the particles were losing ammonium relative to citrate, possibly due to volatilization of NH3 and collection by the denuder system.
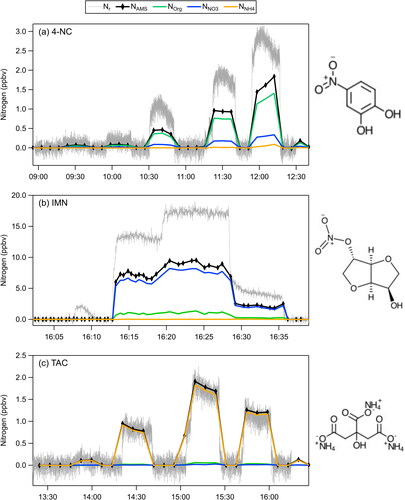
Figure 5. Time series plots showing Nr, NAMS, Norg, NNO3, and NNH4 for (a) 4-nitrocatechol (4-NC), (b) isosorbide mononitrate (IMN), and (c) triammonium citrate (TAC).
3.4.2. HToF C:N results
The time series of the various nitrogen components from the HToF data (Norg, NNO3, and NNH4) indicate which type of nitrogen is present in the calculated AMS total nitrogen (NAMS) for EquationEquation (8)(8)
(8) and are compared to the Nr measurements in . The speciation of nitrogen is different for the three compounds: mostly NNH4 for TAC, mostly NNO3 with some Norg for IMN, and mostly Norg and some NNO3 for 4-NC. These attributions are consistent with their molecular structures. TAC and IMN do not have nitrogen bonded directly to carbon. The prevalence of nitrate ions in the IMN nitrogen indicates that it fragmented primarily through the RO-NO2 bond scission (the weakest bond in the molecule (Roberts Citation1990)). The small amount of Norg in IMN appeared in C3H2NO+ and C3H7NO+ ions. In contrast, the Norg dominated NAMS for 4-NC where the nitrogen is in a nitro group bonded to carbon in the aromatic ring. The two largest peak intensities contributing to Norg in 4-NC were CHN+ followed by the parent ion, C6H5NO4+.
For the comparisons of the total nitrogen mixing ratios (the black and gray time series in ), only TAC had the same amounts of NAMS and Nr. In contrast, both IMN and 4-NC appeared to have about a factor of two lower NAMS than the Nr measurements. The IMN data were obtained without particle sizing and the discrepancy was likely due to large particles being sampled and converted by the catalyst that were not transmitted through the AMS lens (Figure S13b). The calculated TElens of 0.4 has a high uncertainty (+/-0.6) and some particles sampled by the Nr system might also not have been measured with the UHSAS.
Possible reasons for the factor of two difference between the two methods are less clear for 4-NC. Since this experiment was size selected (Figure S13a), we do not believe that lens transmission is causing the discrepancy. There is another size-selected experiment (not shown) where NAMS is also roughly a factor of two lower than Nr. Because most of the nitrogen was found in the CHN+ and C6H5NO4+ ions, we suspect that there might be issues with using the elemental analysis package, specifically related to the position of the carbon atom relative to nitrogen, and other parameters that go into the calculation of Norg in EquationEquation (8)(8)
(8) . The N:C ratios from the Improved-Ambient elemental analysis of the AMS organic part of the mass spectra are inherently biased low because some of the nitrogen fragments into N+, which cannot be easily distinguished from nitrogen due to air (Aiken, DeCarlo, and Jimenez Citation2007; Aiken et al. Citation2008; Canagaratna et al. Citation2015). Aiken et al. (Citation2008) report a small average bias (< 5%) and an uncertainty of 22% in the C:N ratio (or N/C as was reported), which is smaller than the factor of two observed here. The elemental analysis data processing also relies on the ability to detect isolated ions containing both carbon and nitrogen, which could be problematic for high m/z in the mass spectra. This could further lead to undercounting the amount of Norg with the HToF spectra.
In addition, NNO3 could have a potential bias toward lower nitrogen mixing ratios due to using a molecular weight of 62 g mol−1 in EquationEquation (8)(8)
(8) . This value might not be appropriate for molecules such as 4-NC which does not have a NO3 moiety or IMN which likely breaks at the RO-NO2 bond. Using a lower molecular weight (30 or 46 g mol−1) would increase the NNO3 mixing ratios by as much as a factor of two.
The carbon-to-nitrogen ratios (C:N) from the HToF data () were calculated using NAMS and the AMS carbon calculated using the explicit RIEorg (). The C:N ratio was 12 for each of the two 4-NC experiments, which is a factor of two higher than the actual molecule and Cy:Nr measured after the catalysts Equation(6)(6)
(6) . The C:N ratios for IMN (17 and 14) were slightly more than a factor of two higher than the actual molecule and measured by the Cy:Nr method Equation(6)
(6)
(6) . A factor of two lower NAMS with the explicit AMS carbon would account for these factor of two increases in the C:N ratios. The C:N ratios for TAC were much larger (8 and 13) than expected Equation(2)
(2)
(2) and spanned a larger range than for the other two molecules, likely due to the instability (i.e., volatilization of NH3) that was also observed with its Cy:Nr measurements. Consequently, C:N from the HToF and Cy:Nr from the catalysts (5.3-8.5) were both higher than expected for TAC (2).
4. Conclusions
Independent calibration methods were developed for the AMS based on Nr and Cy measurements. The calibration experiments described here clearly show the utility of quantification with the combined nitrogen and carbon catalyst system, especially in cases where the aerosol generation system did not preserve the ion ratios of ammonium salts relative to the original species. The catalyst system allowed the AMS to be calibrated by an independent means without needing to accurately characterize the aerosol mass entering the AMS using traditional aerosol instruments. Moreover, these catalytic methods are inherently tied to universal gas phase standards of high accuracy, NO and CO2.
Over the course of multiple experiments, IENO3 from the AMS single particle and Nr calibrations were within 12%, which is within the combined uncertainties of the instrumentation (15%). Furthermore, we show definitively that RIENH4 in the AMS is nearly universal since RIENH4 for AN, AbiS, and TAC are all within ±5% and the RIENH4 for AS is only slightly higher (20%). Altogether these RIENH4 values were within combined uncertainties of the measurements, providing more confidence in ambient AMS ammonium measurements with varying ion stoichiometries.
The RIEorg values determined here are generally within the range of 1.6 ± 0.5 expected for most organic species (Xu et al. Citation2018). Extension of the total carbon method to other organic compounds could help resolve uncertainties in RIEorg for a wider range of functionalities.
Finally, utilizing the elemental analysis data processing package, we calculated and compared C:N ratios between our different methods. We show that the C:N ratios for molecules that decompose in the AMS thermal vaporizer leave the carbon and nitrogen atoms in distinct ion fragments. When there are strong carbon-nitrogen or carbon-oxygen-nitrogen bonds, the default ion fragment apportionment within the elemental analysis struggles, which is an area for future work. In contrast, the independent catalyst method for measuring the C:N ratio of aerosols in this work was more robust and reliable for compounds measured here and in previous studies (Stockwell et al. Citation2018).
5. Implications
The catalytic conversion calibration technique described here is quite useful as an independent method for quantifying the AMS response to various species. Although it is an alternative to traditional AMS and ACSM mass-based calibration techniques that rely on sizing and counting particles, it is not necessarily simpler. First, care is needed in measuring the effective catalyst conversion efficiencies. Second, denuders must be used directly in front of the point where the sampling line is split for the two instruments in order to remove gas phase species (e.g., HNO3, NH3, organics) that would be detected by the Nr or Cy systems, and the denuder performance must be monitored. Third, as for traditional AMS and ACSM mass-based calibrations, the aerosol generation system must be able to provide aerosols to the AMS that are in the size range of the AMS lens transmission. Lastly, for the commercially available CO2 instrumentation, particle concentrations on the order of 100s of μg/m3 are needed. However, the catalytic technique benefits from not needing to accurately know the size of the particles which can introduce large uncertainties or the number distribution of those particles where a small number of large particles can affect the total mass calculated and measured. With either method, the collection efficiency needs to be determined for species other than ammonium nitrate.
For AMS instruments, the single-particle nitrate ionization efficiency calibration methods are reliable as long as there is sufficient single particle signal and the internal particle time-of-flight (pToF) sizing is well-calibrated. Here, the pToF sizing from the light scattering AMS is determined accurately due to the relatively-long pToF chamber (0.395 m), the timing of scattered light for polystyrene latex spheres (which is more accurate than timing of their mass spectrometer signals), and offset in timing for mass spectral detection of ammonium nitrate particles from the expected time to impact the vaporizer. The AMS single-particle methods are useful, less-complicated ways to measure the nitrate ionization efficiency with polydisperse ammonium nitrate particles when particle sizes are less well-known or if evaporation occurs prior to AMS sampling.
Supplemental Material
Download MS Word (6.6 MB)Acknowledgements
The authors thank Chuck Brock (for the use of the UHSAS), Adam Ahern and the staff at Aerodyne Research Inc. (for getting the LS module operational), Donna Sueper (for LS data processing support), and Pedro Camupuzano-Jost, Peter DeCarlo, and the AMS Users’ Community (for HToF data acquisition and calibration tips).
Disclosure statement
The authors report there are no competing interests to declare.
Additional information
Funding
References
- Aiken, A. C., P. F. DeCarlo, and J. L. Jimenez. 2007. Elemental analysis of organic species with electron impact high-resolution mass spectrometry. Anal. Chem. 79 (21):8350–8. doi:10.1021/ac071150w.
- Aiken, A. C., P. F. Decarlo, J. H. Kroll, D. R. Worsnop, J. A. Huffman, K. S. Docherty, I. M. Ulbrich, C. Mohr, J. R. Kimmel, D. Sueper, et al. 2008. O/C and OM/OC ratios of primary, secondary, and ambient organic aerosols with high-resolution time-of-flight aerosol mass spectrometry. Environ. Sci. Technol. 42 (12):4478–85. doi:10.1021/es703009q.
- Bahreini, R., B. Ervens, A. M. Middlebrook, C. Warneke, J. A. de Gouw, P. F. DeCarlo, J. L. Jimenez, C. A. Brock, J. A. Neuman, T. B. Ryerson, et al. 2009. Organic aerosol formation in urban and industrial plumes near Houston and Dallas, Texas. J. Geophys. Res. 114:D00F16. doi:10.1029/2008JD011493.
- Benedict, K. B., D. Day, F. M. Schwandner, S. M. Kreidenweis, B. Schichtel, W. C. Malm, and J. L. Collett. 2013. Observations of atmospheric reactive nitrogen species in Rocky Mountain National Park and across northern Colorado. Atmos. Environ. 64:66–76. doi:10.1016/j.atmosenv.2012.08.066.
- Benedict, K. B., A. J. Prenni, C. M. Carrico, A. P. Sullivan, B. A. Schichtel, and J. L. Collett. 2017. Enhanced concentrations of reactive nitrogen species in wildfire smoke. Atmos. Environ. 148:8–15. doi:10.1016/j.atmosenv.2016.10.030.
- Canagaratna, M. R., J. T. Jayne, J. L. Jimenez, J. D. Allan, M. R. Alfarra, Q. Zhang, T. B. Onasch, F. Drewnick, H. Coe, A. Middlebrook, et al. 2007. Chemical and microphysical characterization of ambient aerosols with the Aerodyne aerosol mass spectrometer. Mass Spectrom. Rev. 26 (2):185–222. doi:10.1002/mas.20115.
- Canagaratna, M. R., J. L. Jimenez, J. H. Kroll, Q. Chen, S. H. Kessler, P. Massoli, L. H. Ruiz, E. Fortner, L. R. Williams, K. R. Wilson, et al. 2015. Elemental ratio measurements of organic compounds using aerosol mass spectrometry: Characterization, improved calibration, and implications. Atmos. Chem. Phys. 15 (1):253–72. doi:10.5194/acp-15-253-2015.
- Chen, Y., L. Xu, T. Humphry, A. P. S. Hettiyadura, J. Ovadnevaite, S. Huang, L. Poulain, J. C. Schroder, P. Campuzano-Jost, J. L. Jimenez, et al. 2019. Response of the Aerodyne aerosol mass spectrometer to inorganic sulfates and organosulfur compounds: Applications in field and laboratory measurements. Environ. Sci. Technol. 53 (9):5176–86. doi:10.1021/acs.est.9b00884.
- Cross, E. S., T. B. Onasch, M. Canagaratna, J. T. Jayne, J. Kimmel, X.-Y. Yu, M. L. Alexander, D. R. Worsnop, and P. Davidovits. 2009. Single particle characterization using a light scattering module coupled to a time-of-flight aerosol mass spectrometer. Atmos. Chem. Phys. 9 (20):7769–93. doi:10.5194/acp-9-7769-2009.
- Cross, E. S., J. G. Slowik, P. Davidovits, J. D. Allan, D. R. Worsnop, J. T. Jayne, D. K. Lewis, M. Canagaratna, and T. B. Onasch. 2007. Laboratory and ambient particle density determinations using light scattering in conjunction with aerosol mass spectrometry. Aerosol Sci. Technol. 41 (4):343–59. doi:10.1080/02786820701199736.
- DeCarlo, P. F., J. R. Kimmel, A. Trimborn, M. J. Northway, J. T. Jayne, A. C. Aiken, M. Gonin, K. Fuhrer, T. Horvath, K. S. Docherty, et al. 2006. Field-deployable, high-resolution, time-of-flight aerosol mass spectrometer. Anal. Chem. 78 (24):8281–9. doi:10.1021/ac061249n.
- Docherty, K. S., M. Jaoui, E. Corse, J. L. Jimenez, J. H. Offenberg, M. Lewandowski, and T. E. Kleindienst. 2013. Collection efficiency of the aerosol mass spectrometer for chamber-generated secondary organic aerosols. Aerosol Sci. Technol. 47 (3):294–309. doi:10.1080/02786826.2012.752572.
- Drewnick, F., J.-M. Diesch, P. Faber, and S. Borrmann. 2015. Aerosol mass spectrometry: Particle-vaporizer interactions and their consequences for the measurements. Atmos. Meas. Tech. 8 (9):3811–30. doi:10.5194/amt-8-3811-2015.
- Drewnick, F., S. S. Hings, P. DeCarlo, J. T. Jayne, M. Gonin, K. Fuhrer, S. Weimer, J. L. Jimenez, K. L. Demerjian, S. Borrmann, et al. 2005. A new time-of-flight aerosol mass spectrometer (TOF-AMS) - Instrument description and first field deployment. Aerosol Sci. Technol. 39 (7):637–58. doi:10.1080/02786820500182040.
- Franchin, A., D. L. Fibiger, L. Goldberger, E. E. McDuffie, A. Moravek, C. C. Womack, E. T. Crosman, K. S. Docherty, W. P. Dube, S. W. Hoch, et al. 2018. Airborne and ground-based observations of ammonium nitrate dominated aerosols in a shallow boundary layer during intense winter pollution episodes in northern Utah. Atmos. Chem. Phys. 18:17259–76. doi:10.5194/acp-18-17259-2018.
- Fröhlich, R., M. J. Cubison, J. G. Slowik, N. Bukowiecki, A. S. H. Prévôt, U. Baltensperger, J. Schneider, J. R. Kimmel, M. Gonin, U. Rohner, et al. 2013. The ToF-ACSM: A portable aerosol chemical speciation monitor with TOFMS detection. Atmos. Meas. Tech. 6 (11):3225–41. doi:10.5194/amt-6-3225-2013.
- Hayden, K., S. M. Li, J. Liggio, M. Wheeler, J. Wentzell, A. Leithead, P. Brickell, R. Mittermeier, Z. Oldham, C. Mihele, et al. 2022. Reconciling the total carbon budget for boreal forest wildfire emissions using airborne observations. Atmos. Chem. Phys. 22:12493–523. doi:10.5194/acp-22-12493-2022.
- Heald, C. L., A. H. Goldstein, J. D. Allan, A. C. Aiken, E. Apel, E. L. Atlas, A. K. Baker, T. S. Bates, A. J. Beyersdorf, D. R. Blake, et al. 2008. Total observed organic carbon (TOOC) in the atmosphere: A synthesis of North American observations. Atmos. Chem. Phys. 8 (7):2007–25. doi:10.5194/acp-8-2007-2008.
- Heald, C. L., and J. H. Kroll. 2020. The fuel of atmospheric chemistry: Toward a complete description of reactive organic carbon. Sci. Adv. 6 (6):eaay8967. doi:10.1126/sciadv.aay8967.
- Huffman, J. A., J. T. Jayne, F. Drewnick, A. C. Aiken, T. Onasch, D. R. Worsnop, and J. L. Jimenez. 2005. Design, modeling, optimization, and experimental tests of a particle beam width probe for the Aerodyne aerosol mass spectrometer. Aerosol Sci. Technol. 39 (12):1143–63. doi:10.1080/02786820500423782.
- Jayne, J. T., D. C. Leard, X. Zhang, P. Davidovits, K. A. Smith, C. E. Kolb, and D. R. Worsnop. 2000. Development of an aerosol mass spectrometer for size and composition analysis of submicron particles. Aerosol Sci. Technol. 33 (1-2):49–70. doi:10.1080/027868200410840.
- Jimenez, J. L., J. T. Jayne, Q. Shi, C. E. Kolb, D. R. Worsnop, I. Yourshaw, J. H. Seinfeld, R. C. Flagan, X. Zhang, K. A. Smith, et al. 2003. Ambient aerosol sampling using the Aerodyne aerosol mass spectrometer. J. Geophys. Res. 108 (D7):8425. doi:10.1029/2001JD001213.
- Jimenez, J. L., M. R. Canagaratna, F. Drewnick, J. D. Allan, M. R. Alfarra, A. M. Middlebrook, J. G. Slowik, Q. Zhang, H. Coe, J. T. Jayne, et al. 2016. Comment on “The effects of molecular weight and thermal decomposition on the sensitivity of a thermal desorption aerosol mass spectrometer. Aerosol Sci. Technol. 50 (9):i–xv. doi:10.1080/02786826.2016.1205728.
- Juncosa Calahorrano, J. F., J. Lindaas, K. O'Dell, B. B. Palm, Q. Peng, F. Flocke, I. B. Pollack, L. A. Garofalo, D. K. Farmer, J. Pierce, et al. 2021. Daytime oxidized reactive nitrogen partitioning in western U.S. wildfire smoke plumes. J. Geophys. Res.: Atmos. 126 (4):e2020JD033484. doi:10.1029/2020JD033484.
- Katz, E. F., H. Guo, P. Campuzano-Jost, D. A. Day, W. L. Brown, E. Boedicker, M. Pothier, D. M. Lunderberg, S. Patel, K. Patel, et al. 2021. Quantification of cooking organic aerosol in the indoor environment using Aerodyne aerosol mass spectrometers. Aerosol Sci. Technol. 55 (10):1099–114. doi:10.1080/02786826.2021.1931013.
- Kupc, A., C. Williamson, N. L. Wagner, M. Richardson, and C. A. Brock. 2018. Modification, calibration, and performance of the ultra-high sensitivity aerosol spectrometer for particle size distribution and volatility measurements during the Atmospheric Tomography Mission (ATom) airborne campaign. Atmos. Meas. Tech. 11 (1):369–83. doi:10.5194/amt-11-369-2018.
- Liao, J., C. A. Brock, D. M. Murphy, D. T. Sueper, A. Welti, and A. M. Middlebrook. 2017. Single-particle measurements of bouncing particles and in situ collection efficiency from an airborne aerosol mass spectrometer (AMS) with light-scattering detection. Atmos. Meas. Tech. 10 (10):3801–20. doi:10.5194/amt-10-3801-2017.
- Lindaas, J., I. B. Pollack, L. A. Garofalo, M. A. Pothier, D. K. Farmer, S. M. Kreidenweis, T. L. Campos, F. Flocke, A. J. Weinheimer, D. D. Montzka, et al. 2021. Emissions of Reactive Nitrogen From Western U.S. Wildfires During Summer 2018. J. Geophys. Res.: Atmos. 126 (2):e2020JD032657. doi:10.1029/2020JD032657.
- Liu, P., P. J. Ziemann, D. B. Kittelson, and P. H. McMurry. 1995. Generating particle beams of controlled dimensions and divergence: I. Theory of particle motion in aerodynamic lenses and nozzle expansion. Aerosol Sci. Technol. 22 (3):293–313. doi:10.1080/02786829408959748.
- Maris, C., M. Y. Chung, R. Lueb, U. Krischke, R. Meller, M. J. Fox, and S. E. Paulson. 2003. Development of instrumentation for simultaneous analysis of total non-methane organic carbon and volatile organic compounds in ambient air. Atmos. Environ. 37:149–58. doi:10.1016/S1352-2310(03)00387-X.
- Marx, O., C. Brümmer, C. Ammann, V. Wolff, and A. Freibauer. 2012. TRANC - a novel fast-response converter to measure total reactive atmospheric nitrogen. Atmos. Meas. Tech. 5 (5):1045–57. doi:10.5194/amt-5-1045-2012.
- Matthew, B. M., A. M. Middlebrook, and T. B. Onasch. 2008. Collection efficiencies in an Aerodyne aerosol mass spectrometer as a function of particle phase for laboratory generated aerosols. Aerosol Sci. Technol. 42 (11):884–98. doi:10.1080/02786820802356797.
- Middlebrook, A. M., R. Bahreini, J. L. Jimenez, and M. R. Canagaratna. 2012. Evaluation of composition-dependent collection efficiencies for the Aerodyne aerosol mass spectrometer using field data. Aerosol Sci. Technol. 46 (3):258–71. doi:10.1080/02786826.2011.620041.
- Murphy, D. M. 2016a. The effects of molecular weight and thermal decomposition on the sensitivity of a thermal desorption aerosol mass spectrometer. Aerosol Sci. Technol. 50 (2):118–25. doi:10.1080/02786826.2015.1136403.
- Murphy, D. M. 2016b. Reply to “Comment on the effects of molecular weight and thermal decomposition on the sensitivity of a thermal desorption aerosol mass spectrometer” by Jimenez. Aerosol Sci. Technol. 50 (12):1277–83. doi:10.1080/02786826.2016.1254347.
- Ng, N. L., S. C. Herndon, A. Trimborn, M. R. Canagaratna, P. L. Croteau, T. B. Onasch, D. Sueper, D. R. Worsnop, Q. Zhang, Y. L. Sun, et al. 2011. An aerosol chemical speciation monitor (ACSM) for routine monitoring of the composition and mass concentrations of ambient aerosol. Aerosol Sci. Technol. 45 (7):780–94. doi:10.1080/02786826.2011.560211.
- Prenni, A. J., E. J. T. Levin, K. B. Benedict, A. P. Sullivan, M. I. Schurman, K. A. Gebhart, D. E. Day, C. M. Carrico, W. C. Malm, B. A. Schichtel, et al. 2014. Gas-phase reactive nitrogen near Grand Teton National Park: Impacts of transport, anthropogenic emissions, and biomass burning. Atmos. Environ. 89:749–56. doi:10.1016/j.atmosenv.2014.03.017.
- Roberts, J. M. 1990. The atmospheric chemistry of organic nitrates. Atmos. Environ. Part A 24 (2):243–87. doi:10.1016/0960-1686(90)90108-Y.
- Roberts, J. M., S. B. Bertman, T. Jobson, H. Niki, and R. Tanner. 1998. Measurement of total nonmethane organic carbon (Cy): Development and application at Chebogue Point, Nova Scotia, during the 1993 North Atlantic Regional Experiment campaign. J. Geophys. Res. 103 (D11):13581–92. doi:10.1029/97JD02240.
- Roberts, J. M., C. E. Stockwell, R. J. Yokelson, J. de Gouw, Y. Liu, V. Selimovic, A. R. Koss, K. Sekimoto, M. M. Coggon, B. Yuan, et al. 2020. The nitrogen budget of laboratory-simulated western US wildfires during the FIREX 2016 Fire Lab study. Atmos. Chem. Phys. 20 (14):8807–26. doi:10.5194/acp-20-8807-2020.
- Schwab, J. J., Y. Li, M.-S. Bae, K. L. Demerjian, J. Hou, X. Zhou, B. Jensen, and S. C. Pryor. 2007. A laboratory intercomparison of real-time gaseous ammonia measurement methods. Environ. Sci. Technol. 41 (24):8412–9. doi:10.1021/es070354r.
- Stockwell, C. E., A. Kupc, B. Witkowski, R. K. Talukdar, Y. Liu, V. Selimovic, K. J. Zarzana, K. Sekimoto, C. Warneke, R. A. Washenfelder, et al. 2018. Characterization of a catalyst-based conversion technique to measure total particulate nitrogen and organic carbon and comparison to a particle mass measurement instrument. Atmos. Meas. Tech. 11 (5):2749–68. doi:10.5194/amt-11-2749-2018.
- Washenfelder, R. A., L. Azzarello, K. Ball, S. S. Brown, Z. C. J. Decker, A. Franchin, C. D. Fredrickson, K. Hayden, C. D. Holmes, A. M. Middlebrook, et al. 2022. Complexity in the evolution, composition, and spectroscopy of brown carbon in aircraft measurements of wildfire plumes. Geophys. Res. Lett. 49 (9):e2022GL098951. doi:10.1029/2022GL098951.
- Williams, E. J., K. Baumann, J. M. Roberts, S. B. Bertman, R. B. Norton, F. C. Fehsenfeld, S. R. Springston, L. J. Nunnermacker, L. Newman, K. Olszyna, et al. 1998. Intercomparison of ground-based NOy measurement techniques. J. Geophys. Res. 103 (D17):22261–80. doi:10.1029/98JD00074.
- Xu, W., A. Lambe, P. Silva, W. Hu, T. Onasch, L. Williams, P. Croteau, X. Zhang, L. Renbaum-Wolff, E. Fortner, et al. 2018. Laboratory evaluation of species-dependent relative ionization efficiencies in the Aerodyne aerosol mass spectrometer. Aerosol Sci. Technol. 52 (6):626–41. doi:10.1080/02786826.2018.1439570.
- Yang, M., and Z. L. Fleming. 2019. Estimation of atmospheric total organic carbon (TOC) – paving the path towards carbon budget closure. Atmos. Chem. Phys. 19 (1):459–71. doi:10.5194/acp-19-459-2019.