
 ?Mathematical formulae have been encoded as MathML and are displayed in this HTML version using MathJax in order to improve their display. Uncheck the box to turn MathJax off. This feature requires Javascript. Click on a formula to zoom.
Abstract
The Fukushima Daiichi Nuclear Power Plant accident in Japan resulted in the emission of many radioactive cesium (Cs)-containing particles that have charges on the surface due to self-charging. Charged aerosol particles are efficiently deposited inside human airways, leading to adverse health effects. To evaluate these effects, we developed a technique for estimating the charge number (np) of radioactive particles by measuring the surface potentials (Vp) of individual radioactive particles using Kelvin probe force microscopy. The Vp values of the individual CsCl particles were highly correlated with the surface np, indicating that Vp is a measure of the charged aerosol state. To further examine the Vp–np relationship, a simplified capacitance model was developed to estimate the ratio of Vp to np per unit area of particles. Although the calculated Vp was proportional to the np, consistent with our experiment, the calculated ratio was higher than those determined experimentally. The magnitude of this ratio may depend on the conductivity, microphysical properties and chemical composition of the particles. Despite these uncertainties, the experimentally determined Vp–np relationship of the CsCl particles was used to estimate the np of the radioactive and non-radioactive particles from the measurement of the Vp of these particles. It was demonstrated that the np of the radioactive particles was much higher than that of the non-radioactive particles, suggesting that radioactive particles are efficiently charged by self-charging. These charged radioactive particles may strongly cause adverse human health effects owing to their efficient deposition in human airways.
Editor:
1. Introduction
The nuclear disaster following the Great East Japan Earthquake in March 2011 caused severe damage to Fukushima Daiichi Nuclear Power Plant Units 1-3, releasing ∼1016 Bq of radioactive cesium (e.g., Buesseler et al. Citation2017; Stohl et al. Citation2012), which reached as far as the metropolitan city of Tokyo (Kajino et al. Citation2021; Morino, Ohara, and Nishizawa Citation2011; Nakajima et al. Citation2017; Tsuruta et al. Citation2014). It is known that such radioactive cesium exhibits the chemical species CsI or CsOH (e.g., Zheng et al. Citation2015) and can be transported in sulfate aerosols in the atmosphere (Kaneyasu et al. Citation2012). On the other hand, silica-based solid glassy particles bearing high concentrations of radioactive cesium have been found in various materials in the atmosphere (e.g., Adachi et al. Citation2013; Furuki et al. Citation2017; Higaki et al. Citation2017; Ikehara et al. Citation2018; Imoto et al. Citation2017; Kogure et al. Citation2016; Satou et al. Citation2016; Yamaguchi et al. Citation2016, Citation2018). Those Cs-containing particles are widely transported and removed by dry and wet deposition (Kajino et al. Citation2021). Suetake et al. (Citation2019) estimated that 137Cs-rich particles with a radioactivity of ∼2 Bq and diameter of 2 µm, emitted from the Fukushima Daiichi Nuclear Power Plant, were deposited onto human respiratory tracts and could require >35 years for complete dissolution. It suggests that the particles remain in the alveoli for several decades due to their insolubility and chemical stability. Long-term exposure to radiative particles can cause several adverse health effects. Therefore, to evaluate the health effects of radiative particles, a quantitative understanding of the deposition of 137Cs-containing particles in human airways is required.
Generally, radionuclide-containing particles are charged by emitting their own charge from the particle surface (Clement, Clement, and Harrison Citation1995; Clement and Harrison Citation2000; Gensdarmes, Boulaud, and Renoux Citation2001; Greenfield Citation1956; Kim et al. Citation2014; Kim, Yiacoumi, and Tsouris Citation2015; Walker et al. Citation2010). This process is known as self-charging and refers to the charge accumulation caused by radioactive decay (i.e., α or β decay). The charge state on the surface of aerosol particles is an important parameter that controls their deposition in human airways (Cohen et al. Citation1998; Koullapis et al. Citation2016). Cohen et al. (Citation1998) experimentally showed that charged aerosols are more efficiently deposited compared to non-charged aerosols by using a human airway model. Furthermore, Koullapis et al. (Citation2016) used large eddy simulations of a realistic human airway geometry reconstructed from computed tomography scans to show that the deposition fraction of particles (0.1 − 2.5 μm) with 1,000 elementary charges is approximately 1.5–7.0 times higher than that of their non-charged counterparts. The degree of deposition of charged particles depends on their electrostatic interactions, which are strongly governed by the electric charges. The electric charges are proportional to the number of charges on the surface of particles. Therefore, an accurate estimate of the charges number of particles is essential for understanding the deposition process of charged particles in human airways.
The ambient radioactive particles are negatively and positively charged through mechanisms such as electron emission and ion diffusion through their decay pathways (Igarashi et al. Citation2019; Kim et al. Citation2014). Therefore, the estimation of the charge number of radioactive particles plays an important role in elucidating these behaviors on the surface of ambient aerosols.
Most previous studies made bulk measurements to investigate the charging state of radioactive particles using cascade impactors (Subramanian et al. Citation2012) and electrostatic separators (Raabe et al. Citation1978; Yeh et al. Citation1976). However, these measurements cannot understand the charge state on the surface of individual self-charged radioactive particles and evaluate the toxicity of the individual particles. Kelvin probe force microscopy (KPFM) can measure the surface potentials of several individual aerosol particles (e.g., gold or cesium particles). Kim et al. (Citation2014) estimated the surface charge density of activated gold and radioactive cesium and determined that gold particles were likely to be positively charged, while cesium particles were negatively charged. Kweon et al. (Citation2013) also investigated the relationship between the extent of gold radiation and the surface potential of a square piece of activated gold foil. However, techniques for estimating the charge number of individual aerosol particles using KPFM remain limited.
Herein, we proposed a methodology to estimate the aerosol charge number, based on an experimentally determined relationship between the charge number and surface potential of the stable isotope particles with known charges. We further compared to those of the theoretical model. Finally, we applied this method to the estimate of the charge numbers of radioactive and non-radioactive cesium chloride (CsCl)-containing particles.
2. Methods
2.1. Kelvin probe force microscopy
KPFM measures the surface potential of individual aerosol particles using scanning probe microscopy (SPM), as described previously (Böhmisch et al. Citation1997; Nonnenmacher, O’Boyle, and Wickramasinghe Citation1991). In brief, when the needle approaches the sample while vibrating, electrostatic forces are generated by the difference in surface potential between the sample and needle. This electrostatic force can be detected by changes in the vibration period. When a voltage was applied to the needle and the electrostatic force was canceled out, the potentials of the needle and sample align, and the voltage applied at that time was recorded as the sample surface potential. These measurements are especially useful for analyzing the surface charge of individual particles caused by radioactivity because of its high sensitivity to changes in surface potential or surface charge.
There are two main types of KPFM: amplitude modulation (AM-KPFM) and frequency modulation (FM-KPFM). These KPFM methodologies differ in the detection of mechanical oscillations caused by variations in the contact potential difference (CPD). In AM-KPFM, the applied DC voltage is controlled by lowering the amplitude of the oscillation caused by the AC voltage to zero. By contrast, in FM-KPFM, the DC voltage is controlled by changing the frequency shift at the AC voltage frequency to zero.
In this study, AM-KPFM was used herein to measure the topography and surface potential distribution using a Shimadzu SPM-9600 scanning probe microscope (Shimadzu Corporation, Japan). A PtIr5 cantilever probe (PointProbe EFM, Nano World) with a pyramidal shape and resonance frequency ranging from 60 to 90 kHz was used. The scan rate was 0.1–0.2 Hz at a height of 10 nm above the sample surface in a non-contact state, allowing for simultaneous surface topography and potential analysis. Topographic and surface potential images were obtained over a 10 × 10 µm2 area with 256 × 256 pixels. The analysis was conducted at a room temperature of approximately 26 °C and relative air humidity of approximately 60% on average.
2.2. Surface potential measurement of particles with known charge number
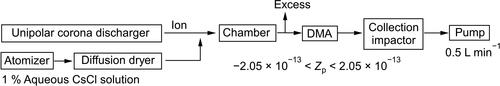
We used non-radioactive CsCl particles to investigate the relationship between their charge number and surface potential. The CsCl particles were generated from a water solution of CsCl with a 1 wt% concentration, using an atomizer (3079-US, Thomas), and then dried by passing through a self-made diffusion dryer filled with silica gel (QA3-5B, Fujigel), shown in . The dried particles were thoroughly mixed in the chamber with ions generated by a unipolar corona discharger (GC25, Greentechno) and subsequently introduced into the Differential Mobility Analyzer (DMA-5180, SHIBATA). The upper limit of classifiable particle size by the DMA was approximately 0.7 µm, and the number of the larger particles generated by the atomizer was limited. Thus, in this experiment, we focused on the electrical mobilities with 0.4 μm particles and five different charge numbers (−60, −30, −10, +30, and +60) to apply the voltage of DMA. The values of the electric mobility Zp correspond to −2.05 × 10⁻¹³ m2/V・S, −1.03 × 10⁻¹³ m2/V・S, −3.42 × 10⁻¹⁴ m2/V・S, 1.03 × 10⁻¹³ m2/V・S, and 2.05 × 10⁻¹³ m2/V・S, respectively. Immediately after the extraction from DMA, we collected the particles within the 0.3 − 0.5 µm diameter range on the glass substrate (D263T, Schott), installed at second stage of a two-stage impactor with 50% cutoff diameters of 0.5 µm and 0.3 µm at a flow rate of 0.5 liter per minute.
Figure 1. Schematic diagram of the experimental setup for collecting cesium chloride (CsCl) particles with the value of the electric mobility (Zp) ranging from −2.05 × 10⁻¹³ m2/V・S to +2.05 × 10⁻¹³ m2/V・S.
After collection, the cross-section, circular equivalent diameter, and surface potential of the individual particles on the glass substrate were measured from the image analysis of KPFM. To investigate the morphology of the individual CsCl particles, their morphologies were observed on the same area as the KPFM measurement from the image analysis of field-emission scanning electron microscope equipped with an energy dispersive X-ray system (SEM-EDX, INSPECT-F50, FEI, Japan) after the glass substrate was coated with osmium in a vacuum chamber (HPC-20, Vacuum Device, Japan). The energy spectrums of the particles and the substrate around the particles were obtained by the EDX analysis.
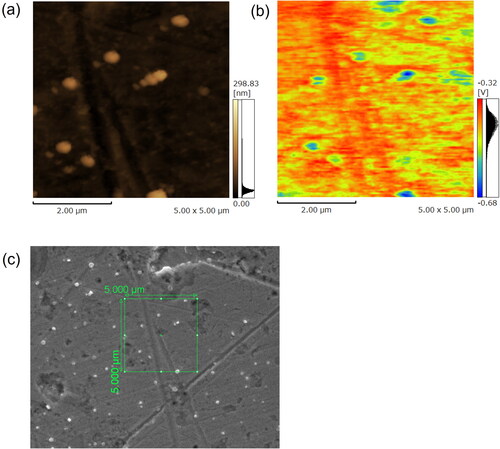
Examples of topography, surface potential, and electron micrograph maps of CsCl particles are shown in . Further examples of topography and surface potential maps are shown in Figure S1 in the Supplementary Information. The SEM analysis showed that the majority of the CsCl particles appeared to be spherical (), although some CsCl particles were aggregated (Figure S2c). We confirmed the chemical composition of CsCl particles on the substrate by EDX analysis (not shown). These surface potential maps give clear images of the CsCl particles. Although the surface potential of the glass substrate was negatively charged overall, the distributions of surface potential and height of the CsCl particles and glass substrate around the particles were uniform ( and S1). The variability (1σ/average) of the surface potential of the glass substrate around the particles was within 10% on average, which is consistent with previous results (Okuda, Gunji, and Lenggoro Citation2015). In this analysis, we defined the surface potential of the particle as the difference between the average surface potential of the particle and the average surface potential of the glass substrate around the particle.
Figure 2. Examples of (a) topography and (b) surface potential maps of CsCl particles with an electric mobility of −2.05 × 10⁻¹³ m2/V・S as analyzed by KPFM, and (c) electron micrograph as analyzed by SEM. The green lined rectangle in (c) corresponds to the maps of (a) and (b).
2.3. Generation of radioactive particles
CsCl particles are also one of the radioactive particles such as Cs-134 and Cs-137 containing particles (Hao et al. Citation2018). To estimate the charge number of the radioactive 134Cs particles, we artificially generated insoluble particles containing radioactive 134Cs in the Kyoto University Research Reactor. Briefly, CsCl (035-01952, Fujifilm Wako Pure Chemical) was neutron-irradiated to produce 134Cs-containing CsCl (54 MBq/g) compounds. Subsequently, 0.16 g of diatomaceous earth (045-00875, Fujifilm Wako Pure Chemical) consisting mainly of SiO2, 0.04 g radioactive CsCl, and 1 mL pure water were mixed and transferred to a crucible. By mixing diatomaceous earth, we generated insoluble particles containing the radioactive CsCl compound. The main component of diatomaceous earth is SiO2, which is the same as the main component of radioactive cesium particles generated by the accident at the Fukushima Daiichi Nuclear Power Plant (Satou et al. Citation2016). The crucible was then heated to 60 °C for approximately 20 h to evaporate the pure water used to dissolve CsCl. After heating, the crucible and quartz glass plate used for particle collection (Labo-CG, Labo-Meister) were placed in a sealed container and irradiated with a continuous-wave fiber laser with a 300 W output, 1080 nm wavelength, and time resolution of 1 s to generate fumes. We collected the particles that adhered to the quartz glass substrate. To minimize the effect of charge build-up on the glass substrate, the samples were analyzed with AM-KPFM immediately after collection. A similar procedure was also performed for non-radioactive CsCl particles.
Examples of topography and surface potential maps for the radioactive 134Cs-containing and non-radioactive CsCl particles as analyzed by KPFM are shown in Figure S3. These surface potential maps show clear images of the radioactive 134Cs-containing and non-radioactive CsCl particles, and the uniform distributions of surface potential and height of the glass substrate around the particles. The variability (1σ/average) of the surface potential of the glass substrate around the particles was within 10% on average.
2.4. Capacitor model
Electrical potential induced by the charge of the particle is calculated by a parallel plate capacitor model (Knorr and Vinzelberg Citation2012; Xu et al. Citation2017). In the capacitor model, the tip and sample in KPFM are considered as a pole plate of a capacitor, and the air in the space between the tip and sample is considered as a dielectric between the pole plates. Thus, in this model, the surface potential measured by KPFM is considered as the potential difference between the pole plates.
3. Relationship between charge number and surface potential of the CsCl particles
3.1. Experimental results
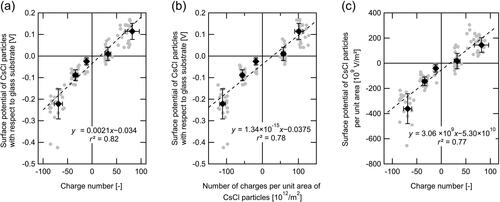
The relationship between the charge number (nCsCl) and surface potential of the CsCl particles (VCsCl) within the 0.3–0.5 μm diameter range on a glass substrate was experimentally investigated. It was demonstrated that VCsCl increased with nCsCl (), while VCsCl and nCsCl were highly correlated with each other (r2 = 0.82). The variability (1σ/average ratio) of VCsCl for each nCsCl value was approximately 30% on average. The VCsCl was well correlated with nCsCl per unit area of CsCl particles (r2 = 0.78) and the value of the slope of the line, fitted by the least squares method, was 1.34 × 10⁻¹⁵ V m2 (). The VCsCl per unit area of CsCl particles correlated well with nCsCl (r2 = 0.77) ().
Figure 3. Scatterplots of the charge on the particles vs. surface-potential metrics for CsCl particles; (a) surface potential and charge number, (b) surface potential and surface charge density, and (c) surface potential per unit area and charge number. Filled black circles and error bars indicate averages and 1σ of the dataset for selected charge numbers (i.e., −60, −30, −10, +30, and +60). The dashed line indicates the least squares fitted regressions.
3.2 A Simplified capacitor model
Previous studies showed that the potential difference between a tip and a sample is represented by combining the work function and the elementary charge quantity (Knorr and Vinzelberg Citation2012; Xu et al. Citation2017). However, this calculation is not suitable for the conditions of our experiment because the potential difference in our experiment is controlled by several parameters (e.g., the relative permittivity of the glass substrate and particle diameter). To theoretically interpret the experimental results, we used the estimable parameters in our experiment to develop an original capacitor model ().
Figure 4. (a) Image of the surface potential measurement for aerosols on the glass substrate and (b) schematic diagram of a simplified capacitor model of the tip-particle-substrate in plane geometry.
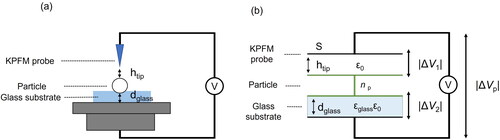
Our model calculates the potential differences between the KPFM probe tip and the surface of the charged particles and that between the surface of the charged particle and glass substrate (). For simplicity, in the theoretical calculation, we assumed that the CsCl particles were non-aggregated, spherical, and exhibited a uniformly distributed surface charge and that the surface did not interact with the charge of aerosols inside and around the host particle. We refer to the space between the KPFM tip and particle surface as “capacitor 1” and that between the top and bottom edges of the glass substrate as “capacitor 2”. The space in capacitor 1 is filled with air, with permittivity equivalent to the dielectric constant for vacuum (ε0 = 8.85 × 10⁻¹² CV−1 m−1; The Chemical Society of Japan Citation2014). The space in capacitor 2 is filled with the glass substrate, with permittivity calculated as the product of the ε0 and the relative permittivity of glass εglass (). According to the product information of Schott North America, Inc. the value of εglass is 6.7.
The potential difference in each capacitor, denoted as |ΔV1| and |ΔV2|, is expressed in EquationEquations (1)(1)
(1) and Equation(2)
(2)
(2) , respectively.
(1)
(1)
(2)
(2)
where |E1| and |E2| are the magnitudes of the corresponding electric fields inside the capacitors, htip is the distance in capacitor 1 (1.0 × 10⁻⁸ m), e is the elementary electric charge (1.6 × 10⁻¹⁹ C), np is the charge number on the particle surface, Dp is the particle diameter, and dglass is the distance in capacitor 2 (1.5 × 10⁻⁴ m). Thus, the dglass indicates the glass substrate thickness.
The surface potential of the charged particles (Vp) reflects the difference between the potential at the KPFM probe tip and that at the lower edge of the glass substrate. Considering that the potential of the particle surface is higher than those of the KPFM probe tip and the bottom of the glass substrate, Vp can be expressed as in EquationEquation (3)(3)
(3) :
(3)
(3)
The surface potential of a sample measured by the KPFM is affected not only by the charge state of the sample but also by the difference between the Fermi level of the sample and substrate (Ep-glass) (Nonnenmacher, O’Boyle, and Wickramasinghe Citation1991). Considering the Fermi level, the calculated Vp can be as in EquationEquation (4)(4)
(4) .
(4)
(4)
This equation indicates that Vp is significantly controlled by np per unit surface area of the particle, whereas it is independent of the microphysical properties (e.g., shape and density) and chemical composition of aerosol particles. The calculated slope was 2.02 × 10⁻¹³ V m2, significantly larger than the experimental slope value of 1.34 × 10⁻¹⁵ V m2 (). The reasons for this discrepancy are discussed in the next section.
3.3. Differences between experiment and theoretical slopes
In the theoretical model, we assumed the non-aggregated and spherical particle. However, in fact, patchy regions were observed on the particles with several morphology in the surface potential results (Figure S2c), similar to the results reported by Kim et al. (Citation2014) and Okuda, Gunji, and Lenggoro (Citation2015). In general, non-spherical particles, such as aggregated particles have a shape factor (>1). As such, the mass equivalent diameter and circular equivalent diameter of the non-spherical particle should be larger than that of the spherical particle with the same aerodynamic diameter (Hinds Citation1999). The assumption of the particle shape may be one of the causes of overestimation of Vp values in our model.
We also assumed that the charges were uniformly distributed on the surface of a particle in the model. However, the surface potential distribution of some CsCl particles was not completely uniform ( and S2b). In addition, the patch-charge areas on a dielectric particle can increase or decrease the local polarization of the particle surface. Polarization is also an important factor that is affected by the relative permittivity of the chemical composition of the material, which was not accounted for in our theoretical model. To further interpret the differences between the experimental and calculation results, theoretical models must reflect some parameters such as a polarization and particle morphology.
Note that there are somewhat uncertainties in the AM-KPFM measurement. KPFM is a highly surface-sensitive measuring device, where abrupt changes in topographic height can interfere with accurate measurements. To compensate for the contribution of capacitance gradients to the surface potential, KPFM requires the tip-sample distance to remain constant during the measurement. The capacitance gradient term can change with sudden changes in topographic height during the KPFM measurement. These capacitance gradient differences can contribute to electrical force disparities between the tip and sample. Consequently, the measured potential surface value does not always represent the contact potential between the tip and sample. The KPFM results may also depend on environmental conditions, including humidity, temperature, and the chemical composition of the atmosphere.
The precision of AM-KPFM could also contribute to the uncertainty of the current measurements. Nevertheless, AM-KPFM is suitable for quick measurements because of its fast operation. The literature (Ma et al. Citation2013; Axt et al. Citation2018; Garrett and Munday Citation2016) has reported that AM-KPFM exhibits a lower potential contrast and a larger shift in CPD compared to FM-KPFM, owing to the spatial averaging effect between the tip and cantilever (i.e., stray capacitance effect). When probing a sample, AM-KPFM registers the electrostatic force from the sample directly under the tip as well as stray electrostatic forces between the cantilever and surrounding sample (in our case, the glass substrate), which may impact the AM-KPFM measurement. Axt et al. (Citation2018) used an array of micron-scale interdigitated electrodes on a glass substrate with a defined potential difference applied between neighboring electrodes to study the stray effect of the different types of KFPM. They discovered that the degree of deviation in the CPD value measured by AM-KPFM increased with the increasing potential difference between two neighboring electrodes. In , the particle charge number with a larger integer created a larger potential difference between the particle and surrounding glass substrate, resulting in a larger CPD data spread, which might affect the slope value.
Although there are disagreements between the experimental and theoretical results, we have shown that the Vp is proportional to the np.
4. Estimate of charge number of artificially generated radioactive particles and non-radioactive particles
To estimate the np of arbitrary radioactive particles, we measured the Vp values of artificially generated radioactive and non-radioactive particles on quartz glass using KPFM. These particles are normally generated as poly-dispersed particles through laser vaporization (Section 2.3). However, due to the lower detection in the KPFM for particles with circular equivalent diameter smaller than 150 nm and the small number of particles with larger diameters, we selected the diameter ranges of 156–447 nm for radioactive particles (n = 8) and 242–743 nm for non-radioactive particles (n = 8). The Vp values decreased with the diameter and surface area of particles (Figures S4a and S4d), thus suggesting that the amount of Cs compound per particle increases with the particle diameter and surface area. Note that large variabilities were observed in the Vp for each diameter and surface area of the particle, which may be due to the different and variable amounts of Cs incorporated per particle when the particles are generated. To minimize the effect on the size dependence of the surface area, in this analysis, the Vp values were normalized by the surface area of individual particles.
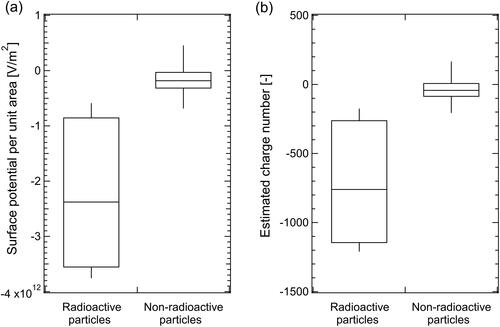
The measured Vp per unit area was much lower for radioactive particles than for non-radioactive particles (). The median (25 percentile, 75 percentile) values of Vp per unit area for radioactive and non-radioactive particles were −2.4 × 10¹² (−3.2 × 10¹², −1.1 × 10¹²) V m−2 and −1.8 × 10¹¹ (−2.6 × 10¹¹, −5.1 × 10¹⁰) V m−2, respectively. The results indicated that radioactive particles were more negatively charged than non-radioactive particles, owing to activation, because radioactive cesium produced electrons by β and γ decay. The generated negative ions adhered to the surrounding particles, causing their surface charges to become negatively biased and the potential to be low; similar behavior was reported by Gensdarmes, Boulaud, and Renoux (Citation2001) and Kim et al. (Citation2014).
Figure 5. (a) Surface potential per unit area of radioactive and non-radioactive particles measured by KPFM and (b) their charge numbers estimated using the relationship between the surface potential per unit area and charge number for CsCl particles ().
To estimate the np of the radioactive particles, the experimentally determined relationship between nCsCl and VCsCl per unit area () and Vp per unit area of the radioactive particles were combined ( and Figures S4b and S4e). Thus, the Vp values per unit area were normalized to the VCsCl values per unit area for the particles collected on the cover glass because the Vp values depend on the work function and Fermi level between the KPFM tip and surface glass.
The radioactive particles exhibited more negative charges than the non-radioactive particles ( and Figures S4c and S4f). The median (25 percentile, 75 percentile) value of the estimated np for radioactive and non-radioactive particles was −760 (−1034, −347) and −42 (−67, 0.50), respectively. Kim et al. (Citation2014) used surface potential images to estimate that the absolute value of maximum charge density of a radioactive 137Cs-containing particle is approximately 0.30 µC cm−2. To verify the order of magnitude of our estimates, we used the charge density to estimate the charge number of the radioactive 134Cs-containing particles within the diameter range (156–447 nm). The charge number was derived by the following equation.
(5)
(5)
where np is a charge number of particle, Dp is a particle diameter, σ is a surface charge density of the particle (= −0.3 µC cm−2), and e is elementary electric charge (= 1.60 × 10⁻¹⁹ C). In this case, the median (25 percentile, 75 percentile) value of the radioactive 134Cs-containing particle was −2800 (−3000, −1600). This estimate indicated that radioactive particles were highly negatively charged, which was consistent with our results. As the absolute values of the estimated np can be affected by the microphysical properties of particles (e.g., polarization and aggregation), the estimated np values may have large uncertainties. Despite this, the estimated value suggests that radioactive particles are more likely to be deposited in the lungs than non-radioactive particles.
The estimate of the np of the radioactive particles is important to understand the spatial distribution of the radioactivity of the particles. Using the np estimated from the Vp–np relationship, we investigated the relationship between the estimated np and radioactivity of the artificially generated 134Cs-containing particles. The radioactivity is proportional to the particle volume and specific radioactivity (Kim et al. Citation2014). Assuming that the specific radioactivity of the 134Cs particles is 930 Bq µm−3 (Clement and Harrison Citation1992), we estimated that radioactivity ranges from 0.44 to 10.4 Bq within the diameter range of 156–447 nm. The median (25 percentile, 75 percentile) value of the radioactivity was 1.24 (0.54, 1.46) Bq. Theoretically, the radioactivity of the 134Cs particles is expected to be proportional to the np of the particles (Kim et al. Citation2014). However, the estimated radioactivity was largely variable for the estimated np (Figure S5), partly owing to the difference in the amount of Cs incorporated per particle. Although large variabilities were observed in the radioactivity, the relationship between the np and radioactivity should play an important role in understanding the behavior of the charged particles in the atmosphere.
Our technique indicates that the estimation of the np may be applicable for real radioactive particles that have unknown Vp–np relationships (). We summarized how to estimate the np of the real radioactive particles with following procedure:
We collected ambient aerosol particles on a glass substrate using an impactor, and then measured their surface potential and chemical composition using KPFM and SEM/EDX, respectively.
We used standard samples of radioactive particles to experimentally determine a calibration line between their surface potential (Vp) and charge number (np) for each radioactive particle (see Section 2.2).
By combining the calibration lines for standard samples with surface potential maps and electron micrographs of ambient radioactive particles, we estimated the charge number of the real radioactive particles in air. However, the KPFM-SEM/EDX technique cannot identify radioactive isotopes, such as 134Cs and 137Cs. Therefore, in this estimate, we assumed that the Vp–np relationship of the radioactive isotopes was similar to that of the other radioactive isotopes for the same element.
5. Conclusion
We developed a technique for estimating the surface charge number of particles based on KPFM to improve the understanding of the charge state of 137Cs-bearing particles emitted from the Fukushima Daiichi Nuclear Power Plant accident. First, CsCl particles with known charge numbers were classified by DMA and collected on the impactor; subsequently, their surface potentials were measured using KPFM. In addition, the morphology and chemical compositions of the CsCl particles were analyzed with an electron micrograph by SEM-EDX. The measured surface potential (VCsCl) was proportional to the charge number of the particles (nCsCl) with strong correlation (r2 = 0.82). We then used a capacitor model to interpret linearity. The ratio of the particle surface potential (Vp) to the charge number (np) was much higher than the measured VCsCl/nCsCl ratio. The slope values may depend on the polarization rate of the particle material and shape of the particle surface (e.g., aggregation).
This measurement technique was applied to estimate the np of radioactive 134Cs-containing CsCl particles using the relationship between nCsCl per unit area and VCsCl as well as measured Vp values for the radioactive 134Cs-containing particles. The radioactive 134Cs-containing CsCl particles exhibited a larger np than the non-radioactive CsCl particles, indicating that radioactive particles could be efficiently deposited on respiratory organ surfaces. Note that the values of estimated np and calculated radioactivity for the radioactive particles had large variabilities, partly due to the different and variable amounts of Cs incorporated per particle when the radioactive particles are generated. Despite this, our measurement technique may be useful for investigating np values of arbitrary radiative particles.
| Nomenclature | ||
| dglass | = | thickness of glass substrate [m] |
| εglass | = | relative permittivity of the glass substrate [−] |
| htip | = | distance between tip and sample [m] |
| ε0 | = | vacuum permittivity [CV−1m−1] |
| e | = | elementary electric charge [C] |
| Ep-glass | = | difference in Fermi level between glass substrate and particles [eV] |
| Dp | = | particle diameter [m] |
| np | = | charge number of particle [−] |
| Vp | = | surface potential of the charged particles |
Supplemental Material
Download MS Word (979.5 KB)Acknowledgments
We thank Associate Professor T. Shimizu of the Department of Physics and Information Engineering at Keio University for her advice regarding the theoretical model of Kelvin probe force microscopy (KPFM). The surface potential of the aerosol particles was measured using a scanning probe microscope (SPM-9600) at the central laboratory of Keio University. We also thank M. Matsuda, M. Azami, and K. Kitamura of Shimadzu Corporation for their assistance with KPFM measurements.
Data availability statement
The data that support the findings of this study are openly available at https://keio.box.com/s/9cdkot0j99ryhpy5fuv8hcpl3u5w5pka.
Additional information
Funding
References
- Adachi, K., M. Kajino, Y. Zaizen, and Y. Igarashi. 2013. Emission of spherical cesium-bearing particles from an early stage of the Fukushima nuclear accident. Sci. Rep. 3 (1):255. doi:10.1038/srep02554.
- Axt, A., M. I. Hermes, W. V. Bergmann, N. Tausendpfund, and S. A. L. Weber. 2018. Know your full potential: Quantitative Kelvin probe force microscopy on nanoscale electrical devices. Beilstein J. Nanotechnol. 9 (1):1809–19. doi:10.3762/bjnano.9.172.
- Böhmisch, M., F. Burmeister, A. Rettenberger, J. Zimmermann, J. Boneberg, and P. Leiderer. 1997. Atomic force microscope based kelvin probe measurements: Application to an electrochemical reaction. J. Phys. Chem. B 101 (49):10162–5. doi:10.1021/jp9728767.
- Buesseler, K., M. Dai, M. Aoyama, C. Benitez-Nelson, S. Charmasson, K. Higley, V. Maderich, P. Masqué, J. P. Morris, D. Oughton, et al. 2017. Fukushima Daiichi-derived radionuclides in the ocean: Transport, fate, and impacts. Ann. Rev. Mar. Sci. 9:173–203. doi:10.1146/annurev-marine-010816-060733.
- Clement, C. F., and R. G. Harrison. 1992. The charging of radioactive aerosols. J. Aerosol Sci. 23 (5):481–504. doi:10.1016/0021-8502(92)90019-R.
- Clement, C. F., and R. G. Harrison. 2000. Enhanced localized charging of radioactive aerosols. J. Aerosol Sci. 31 (3):363–78. doi:10.1016/S0021-8502(99)00064-6.
- Clement, C. F., R. A. Clement, and R. G. Harrison. 1995. Charge distributions and coagulation of radioactive aerosols. J. Aerosol Sci. 26 (8):1207–25. doi:10.1016/0021-8502(95)00525-0.
- Cohen, B. S., J. Q. Xiong, C. Fang, and W. Li. 1998. Deposition of charged particles on lung airways. Health Phys. 74 (5):554–60. doi:10.1097/00004032-199805000-00002.
- Furuki, G., J. Imoto, A. Ochiai, S. Yamasaki, K. Nanba, T. Ohnuki, B. Grambow, R. C. Ewing, and S. Utsunomiya. 2017. Caesium-rich micro-particles: A window into the meltdown events at the Fukushima Daiichi nuclear power plant. Sci. Rep. 7:42731. doi:10.1038/srep42731.
- Garrett, L. J., and N. J. Munday. 2016. Fast, high-resolution surface potential measurements in air with heterodyne Kelvin probe force microscopy. Nanotechnology 27 (24):245705. doi:10.1088/0957-4484/27/24/245705.
- Gensdarmes, F., D. Boulaud, and A. Renoux. 2001. Electrical charging of radioactive aerosols-comparison of the clement-harrison models with new experiments. J. Aerosol Sci. 32 (12):1437–58. doi:10.1016/S0021-8502(01)00065-9.
- Greenfield, M. S. 1956. Ionization of radioactive particles in the free air. J. Geophys. Res. 61 (1):27–33. doi:10.1029/JZ061i001p00027.
- Hao, M. W., S. Baker, E. Lincoln, S. Hudson, D. S. Lee, and P. Lemieux. 2018. Cesium emissions from laboratory fires. J. Air Waste Manag. Assoc. 68 (11):1211–23. doi:10.1080/10962247.2018.1493001.
- Higaki, S., Y. Kurihara, H. Yoshida, Y. Takahashi, and N. Shinohara. 2017. Discovery of non-spherical heterogeneous radiocesium-bearing particles not derived from Unit 1 of the Fukushima Dai-ichi Nuclear Power Plant, in residences five years after the accident. J. Environ. Radioact. 177:65–70. doi:10.1016/j.jenvrad.2017.06.006.
- Hinds, W. C. 1999. Aerosol technology; properties, behavior, and measurement of airborne particles. 2nd ed. New York: John Wiley & Sons.
- Igarashi, Y., T. Kogure, Y. Kurihara, H. Miura, T. Okumura, Y. Satou, Y. Takahashi, and N. Yamaguchi. 2019. A review of Cs-bearing microparticles in the environment emitted by the Fukushima Dai-ichi Nuclear Power Plant accident. J. Environ. Radioact. 205–206:101–18. doi:10.1016/j.jenvrad.2019.04.011.
- Ikehara, R., M. Suetake, T. Komiya, G. Furuki, A. Ochiai, S. Yamasaki, R. W. Bower, T. W. G. Law, T. Ohnuki, B. Grambow, et al. 2018. Novel method of quantifying radioactive Cesium-Rich Microparticles (CsMPs) in the environment from the Fukushima Daiichi Nuclear Power Plant. Environ. Sci. Technol. 52 (11):6390–8. doi:10.1021/acs.est.7b06693.
- Imoto, J., A. Ochiai, G. Furuki, M. Suetake, R. Ikehara, K. Horie, M. Takehara, S. Yamasaki, K. Nanba, T. Ohnuki, et al. 2017. Isotopic signature and nano-texture of cesium-rich microparticles: Release of uranium and fission products from the Fukushima Daiichi Nuclear Power Plant. Sci. Rep. 7 (1):5409. doi:10.1038/s41598-017-05910-z.
- Kajino, M., K. Adachi, Y. Igarashi, Y. Satou, M. Sawada, T. Thomas Sekiyama, Y. Zaizen, A. Saya, H. Tsuruta, and Y. Moriguchi. 2021. Deposition and dispersion of radio‐cesium released due to the Fukushima Nuclear Accident: 2. Sensitivity to aerosol Microphysical Properties of Cs‐Bearing Microparticles (CsMPs). J. Geophys. Res. Atmos. 126 (1):e2020JD033460. doi:10.1029/2020JD033460.
- Kaneyasu, N., H. Ohashi, F. Suzuki, T. Okuda, and F. Ikemori. 2012. Sulfate aerosol as a potential transport medium of radiocesium from the Fukushima nuclear accident. Environ. Sci. Technol. 46 (11):5720–6. doi:10.1021/es204667h.
- Kim, Y.-H., S. Yiacoumi, and C. Tsouris. 2015. Surface charge accumulation of particles containing radionuclides in open air. J. Environ. Radioact. 143:91–9. doi:10.1016/j.jenvrad.2015.02.017.
- Kim, Y.-H., S. Yiacoumi, I. Lee, J. McFarlane, and C. Tsouris. 2014. Influence of radioactivity on surface charging and aggregation kinetics of particles in the atmosphere. Environ. Sci. Technol. 48 (1):182–9. doi:10.1021/es4047439.
- Knorr, N., and S. Vinzelberg. 2012. Charge writing and detection by EFM and KPFM scanning probe techniques. Microsc. Anal. 26 (5):7–12.
- Kogure, T., N. Yamaguchi, H. Segawa, H. Mukai, S. Motai, K. Akiyama-Hasegawa, M. Mitome, T. Hara, and T. Yaita. 2016. Constituent elements and their distribution in the radioactive Cs-bearing silicate glass microparticles released from Fukushima nuclear plant. Microscopy (Oxf.) 65 (5):451–9. doi:10.1093/jmicro/dfw030.
- Koullapis, P., S. Kassinos, M. Bivolarova, and A. Melikov. 2016. Particle deposition in a realistic geometry of the human conducting airways: Effects of inlet velocity profile, inhalation flowrate and electrostatic charge. J. Biomech. 49 (11):2201–12. doi:10.1016/j.jbiomech.2015.11.029.
- Kweon, H., S. Yiacoumi, I. Lee, J. McFarlane, and C. Tsouris. 2013. Influence of surface potential on the adhesive force of radioactive gold surfaces. Langmuir 29 (38):11876–83. doi:10.1021/la4008476.
- Ma, Z.-M., L. Kou, Y. Naitoh, Y.-J. Li, and Y. Sugawara. 2013. The stray capacitance effect in Kelvin probe force microscopy using FM, AM and heterodyne AM modes. Nanotechnology 24 (22):225701. doi:10.1088/0957-4484/24/22/225701.
- Morino, Y., T. Ohara, and M. Nishizawa. 2011. Atmospheric behavior, deposition, and budget of radioactive materials from the Fukushima Daiichi nuclear power plant in March 2011. Geophys. Res. Lett. 38 (7):n/a–/a. doi:10.1029/2011GL048689.
- Nakajima, T., S. Misawa, Y. Morino, H. Tsuruta, D. Goto, J. Uchida, T. Takemura, T. Ohara, Y. Oura, M. Ebihara, et al. 2017. Model depiction of the atmospheric flows of radioactive cesium emitted from the Fukushima Daiichi Nuclear Power Station accident. Prog. in Earth and Planet. Sci. 4 (1):1–18. doi:10.1186/s40645-017-0117-x.
- Nonnenmacher, M., P. M. O’Boyle, and K. H. Wickramasinghe. 1991. Kelvin probe force microscopy. Appl. Phys. Lett. 58 (25):2921–3. doi:10.1063/1.105227.
- Okuda, T., Y. Gunji, and I. W. Lenggoro. 2015. Measurement of the electrostatic charging state of individual particles in ambient aerosol using kelvin probe force microscopy. Earozoru Kenkyu 30 (3):190–7. doi:10.11203/jar30.190.(in Japanese).
- Raabe, O. G., G. J. Newton, C. J. Wilkinson, S. V. Teague, and R. C. Smith. 1978. Plutonium aerosol characterization inside safety enclosures at a demonstration mixed-oxide fuel fabrication facility. Health Phys. 35 (5):649–61. doi:10.1097/00004032-197811000-00006.
- Satou, Y., K. Sueki, K. Sasa, K. Adachi, and Y. Igarashi. 2016. First successful isolation of radioactive particles from soil near the Fukushima Daiichi Nuclear Power Plant. Anthropocene 14:71–6. doi:10.1097/00004032-199101000-00001.
- Stohl, A., P. Seibert, G. Wotawa, D. Arnold, J. F. Burkhart, S. Eckhardt, C. Tapia, A. Vargas, and T. J. Yasunari. 2012. Xenon-133 and caesium-137 releases into the atmosphere from the Fukushima Dai-ichi nuclear power plant: Determination of the source term, atmospheric dispersion, and deposition. Atmos. Chem. Phys. 12 (5):2313–43. doi:10.5194/acp-12-2313-2012.
- Subramanian, V., A. Kumar, R. Baskaran, J. Misra, and B. Venkatraman. 2012. An experimental study on the charging of non-radioactive aerosols with and without the presence of gamma radiation. J. Aerosol Sci. 52:98–108. doi:10.1016/j.jaerosci.2012.05.004.
- Suetake, M., Y. Nakano, G. Furuki, R. Ikehara, T. Komiya, E. Kurihara, K. Morooka, S. Yamasaki, T. Ohnuki, K. Horie, et al. 2019. Dissolution of radioactive, cesium-rich microparticles released from the Fukushima Daiichi Nuclear Power Plant in simulated lung fluid, pure-water, and seawater. Chemosphere 233:633–44. doi:10.1016/j.chemosphere.2019.05.248.
- The Chemical Society of Japan. 2014. Kagakubinran ouyoukagakuhen [Handbook of chemistry: Applied chemistry]. Chiyoda-ku: Maruzen Publishing.
- Tsuruta, H., Y. Oura, M. Ebihara, T. Ohara, and T. Nakajima. 2014. First retrieval of hourly atmospheric radionuclides just after the Fukushima accident by analyzing filter-tapes of operational air pollution monitoring stations. Sci. Rep. 4:6717. doi:10.1038/srep06717.
- Walker, E. M., J. McFarlane, C. D. Glasgow, E. Chung, P. Taboada-Serrano, S. Yiacoumi, and C. Tsouris. 2010. Influence of radioactivity on surface interaction forces. J. Colloid Interface Sci. 350 (2):595–8. doi:10.1016/j.jcis.2010.06.042.
- Xu, J., Y. Wu, W. Li, and J. Xu. 2017. Surface potential modeling and reconstruction in Kelvin probe force microscopy. Nanotechnology 28 (36):365705. doi:10.1088/1361-6528/aa7cbc.
- Yamaguchi, N., M. Mitome, K. Akiyama-Hasegawa, M. Asano, K. Adachi, and T. Kogure. 2016. Internal structure of cesium-bearing radioactive microparticles released from Fukushima nuclear power plant. Sci. Rep. 6:20548. doi:10.1038/srep20548.
- Yamaguchi, N., T. Kogure, H. Mukai, K. Akiyama-Hasegawa, M. Mitome, T. Hara, and H. Fujiwara. 2018. Structures of radioactive Cs-bearing microparticles in nonspherical forms collected in Fukushima. Geochem. J. 52 (2):123–36. doi:10.2343/geochemj.2.0483.
- Yeh, H., J. G. Newton, O. Raabe, and D. Boor. 1976. Self-charging of 198Au-labeled monodisperse gold aerosols studied with a miniature electrical mobility spectrometer. J. Aerosol Sci. 7 (3):245–53. doi:10.1016/0021-8502(76)90039-2.
- Zheng, X., H. Itoh, H. Tamaki, and Y. Maruyama. 2015. Source term uncertainty analysis: Probabilistic approaches and applications to a BWR severe accident. Mech. Eng. J. 2 (5):15–00032. doi:10.1299/mej.15-00032.