
 ?Mathematical formulae have been encoded as MathML and are displayed in this HTML version using MathJax in order to improve their display. Uncheck the box to turn MathJax off. This feature requires Javascript. Click on a formula to zoom.
Abstract
Organic aerosol (OA) mass concentrations measured by the Aerodyne Aerosol Mass Spectrometer (AMS) and Aerosol Chemical Species Monitor (ACSM) depend on particle relative ionization efficiency (RIEOA). Here, a series of laboratory experiments were conducted to investigate how RIEOA differs for different classes of OA and between AMS and ACSM instruments. For OA surrogates with high oxidation state (), the measured RIEOA is 1.60 ± 0.56 for all instruments. However, for OA surrogates with lower
the absolute magnitude and the variability of the measured RIEOA increases. The increase in RIEOA is different between the AMS and ACSMs due to differences in m/z-dependent ion transmission/detection efficiencies in the mass spectrometers. A new metric is introduced to explore RIEOA—the fractional contribution of ions at less than or equal to m/z 50 (fΣm/z50). When fΣm/z50 is high (>64%, similar to ambient OA), the average RIEOA is 1.23 ± 0.62. This supports the use of a default RIEOA of 1.4 for typical ambient conditions, where secondary OA dominates the OA budget. When fΣm/z50 is less than 64%, the RIEOA increases as higher m/z ions contribute more to the total signal. These observations reflect the fact that the observed RIEOA is a combination of multiple processes. The fΣm/z50 may be used as a metric to determine if primary-like OA is contributing significantly to total OA. Overall, the results indicate that changes in RIEOA are most important for studies measuring primary-like OA, and the magnitude of the changes will depend on the instrument being used to measure the OA.
Editor:
1. Introduction
Atmospheric particles, or aerosol, play important roles in the earth system, impacting human health, climate, and air quality (Cohen et al. Citation2017; Monks et al. Citation2009; Myhre et al. Citation2013). An important component of aerosol is organic aerosol, or OA (Chen et al. Citation2022; Jimenez et al. Citation2009; Zhang et al. Citation2007). The exact chemical structure and physicochemical properties of OA vary depending on source and whether it was primarily emitted or produced by secondary processes such as gas-phase photochemistry or condensed-phase aqueous chemistry (Hallquist et al. Citation2009; Moise, Flores, and Rudich Citation2015; Rudich, Donahue, and Mentel Citation2007). Thus, measurements to determine the OA sources and chemical transformations are important to improve our understanding of aerosol.
The Aerodyne Aerosol Mass Spectrometer (AMS; Canagaratna et al. Citation2007) and Aerosol Chemical Speciation Monitor (ACSM; Fröhlich et al. Citation2013; Ng et al. Citation2011b) are two widely used instruments to measure the non-refractory chemical composition and mass concentration of aerosol. Both use the same technique to sample non-refractory aerosol and a detailed description, along with their working principles, can be found elsewhere (Canagaratna et al. Citation2007; Fröhlich et al. Citation2013; Ng et al. Citation2011b). However, there are some key differences between the AMS and ACSM. The main differences between the AMS and ACSM include differences in how air background is subtracted (use of particle time-of-flight with AMS and use of particle filter with ACSM as there is no particle time-of-flight in ACSM), detector, and simplified electronics which reduces the overall complexity of the ACSM compared to the AMS (Fröhlich et al. Citation2013; Ng et al. Citation2011b). However, the general technique for sampling aerosol is similar with the AMS and ACSM. Briefly, ambient aerosol is sampled through an aerodynamic lens (Liu et al. Citation1995a, Citation1995b) and focused into a narrow beam. Then, the aerosol is evaporated using a heated surface (∼600 °C to vaporize non-refractory aerosol) and ionized by 70 eV electrons (Canagaratna et al. Citation2007; Jimenez et al. Citation2003; Jayne et al. Citation2000). The ions are then extracted into a mass spectrometer to be measured. The aerosol mass concentration of any given species, Cs (μg m−3), can be obtained from the measured mass spectrum signal using the following equation:
(1)
(1)
Here, MWNO3 is the molecular weight of species nitrate as nitrate (g mol−1) is used as the main calibrant for AMS and ACSM (Jayne et al. Citation2000), Q is the volumetric flow rate (cm3 s−1), NA is Avogadro’s number (molecules mol−1), Is,i is the ion rate of each ion, i, for species, s (ions s−1), 1012 is for unit conversion (g to μg and cm−3 to m−3), IENO3 is the nitrate-dependent ionization efficiency (ion molec−1), RIEs is the species-dependent relative ionization efficiency (unitless), and CEs is the collection efficiency, a unitless factor that accounts decreased focusing efficiency due to non-spherical shape, the shape factor of the aerosol (ES), the transmission of the aerosol through the lens (EL), and the bounce of the aerosol on the vaporizer (EB) (Huffman et al. Citation2005; Middlebrook et al. Citation2012).
The IE used for conversion to mass concentration is based on using ammonium nitrate particles, as it is a well-characterized and well-behaved aerosol (Jayne et al. Citation2000). To convert from ammonium nitrate equivalent mass concentration to the species specific mass concentration, a relative ionization efficiency for each species (RIEs) is used and defined as the ratio of the IE for each species, s, to that of nitrate (Alfrarra Citation2004; Canagaratna et al. Citation2007; Jimenez et al. Citation2003). For inorganic species, including ammonium, sulfate, and chloride, their individual RIE can be calibrated with lab-generated aerosol with no matrix effects (Nault et al. Citation2018; Xu et al. Citation2017). However, because OA found in the atmosphere is composed of 100s–1000s of different compounds with different physicochemical properties (Hallquist et al. Citation2009; Moise, Flores, and Rudich Citation2015; Rudich, Donahue, and Mentel Citation2007), a calibration for the OA RIE (RIEOA) from a single OA standard is not possible. Instead, several standards would be necessary to explore the potential range of values for RIEOA.
There are many processes controlling RIEOA (Jimenez et al. Citation2003, Citation2016; Murphy Citation2016). In addition to the ionization process itself, the measured value of RIE accounts for multiple processes leading up to detection of the OA ions. Thermal decomposition of oxidized OA via dehydration and decarboxylation prior to ionization of the gases is one well known process (Canagaratna et al. Citation2015; Moldoveanu Citation2018):
(R1)
(R1)
(R2)
(R2)
This leads to detection of CO2, H2O, CO, and R′. Carbon-Carbon (C-C) bond cleavage to form methyl or ethyl radical compounds plus an unsaturated hydrocarbon may also occur at these temperatures (Rice Citation1931, Citation1933; Rice, Johnston, and Evering Citation1932). For example, the following products from thermal decomposition of n-butane have been observed and calculated (Rice Citation1931, Citation1933):
(R3)
(R3)
(R4)
(R4)
(R5)
(R5)
(R6)
(R6)
(R7)
(R7)
(R8)
(R8)
(R9)
(R9)
Here, R can be CH3, CH3CH2, or H. For larger saturated hydrocarbons, including branched hydrocarbons, even more products were observed (Rice Citation1933). Note, though possible for the vaporization conditions of the AMS and ACSM, the thermal decomposition of saturated hydrocarbons (R3–R9) has not been investigated for the AMS and ACSM. After thermal decomposition, the molecules undergo ionization. As the ionization cross section is approximately proportional to the molecule’s molecular weight (Jimenez et al. Citation2003), the ionization efficiency will depend on the molecular weight of the thermally decomposed OA. Further, the ionization cross section is also related to the oxidation state ( = H/C − 2 × O/C; Kroll et al. Citation2011) of the thermally decomposed OA, with more reduced molecules having larger electron ionization cross sections than more oxidized molecules (Jimenez et al. Citation2003). However, as shown in Xu et al. (Citation2018), there is not a clear trend in the RIEOA with
It has been hypothesized that the molecular weight of the thermally decomposed OA compounds will dictate how long the molecule will remain in the ionization region and thus affect RIEOA (Murphy Citation2016). However, ambient observations of OA have shown minimal impact for high molecular weight OA impacting the quantification of total OA mass concentration (Jimenez et al. Citation2016). Finally, after ionization, other processes that may impact RIE include ion transmission and detection (Canagaratna et al. Citation2007; Jimenez et al. Citation2003). As demonstrated here, the complexity of processes that lead up to detection of OA species makes a priori predictions of RIEOA difficult. Thus, direct measurements provide the best method to determine RIEOA. Laboratory measurements of commercially available oxidized OA surrogates indicate an average RIEOA of 1.4 (Canagaratna et al. Citation2007; Jimenez et al. Citation2003, Citation2016; Xu et al. Citation2018). This RIEOA leads to generally good agreement between the AMS or ACSM and other measurements sampling ambient aerosol (e.g., DeCarlo et al. Citation2008; Hayes et al. Citation2013; Nault et al. Citation2018).
Recent observations of directly emitted OA, or primary OA (POA), have indicated higher RIEOA than the default value of 1.4 (Katz et al. Citation2021; Reyes-Villegas et al. Citation2018). Xu et al. (Citation2018) investigated OA surrogates that ranged in molecular weight and and found that RIEOA remained relatively constant for
representative of secondary OA (SOA) at 1.6 ± 0.5 and increased with decreasing
This is in line with the studies that found higher RIEOA was needed for POA (Katz et al. Citation2021; Reyes-Villegas et al. Citation2018). However, Xu et al. (Citation2018) observed high variability in RIEOA versus
reducing the ability to provide guidance in what RIEOA to use with observations collected by AMS and ACSM. Further, Xu et al. (Citation2018) only investigated RIEOA with an AMS and did not determine if what was observed on the AMS is applicable to the ACSM, and what role the other processes that can impact IE and/or RIE may have. Field measurements, e.g., Katz et al. (Citation2021), suggest that RIEOA for POA may be quite different between the two types of instruments.
This study expands upon the work from Xu et al. (Citation2018) to investigate RIEOA measurements for both AMS and ACSM instruments and to provide guidance on how to calibrate or estimate RIEOA. An important aspect of this study is the investigation of the ion transmission efficiency for different versions of AMS and ACSM that use different mass spectrometers, and how this impacts the measured RIEOA. We propose a simplified method to calibrate RIEOA that reduces the need for equipment used in Xu et al. (Citation2018) while maintaining high reproducibility. We also investigate a new metric for estimating RIEOA self-consistently for all AMS and ACSM systems when calibration is not possible.
2. Methods
2.1. Instrumentation
In this study, seven instrument versions with different mass spectrometers were investigated. These included the Aerodyne Quadrupole Aerosol Mass Spectrometer (Q-AMS; Jayne et al. Citation2000), the Aerodyne Compact Time-of-Flight AMS (CTOF-AMS; Drewnick et al. Citation2005), the Aerodyne High Resolution Time-of-Flight AMS (HTOF-AMS; DeCarlo et al. Citation2006), the Aerodyne Long Time-of-Flight AMS (LTOF-AMS), the Aerodyne Quadrupole Aerosol Chemical Speciation Monitor (Q-ACSM; Ng et al. Citation2011b), the Aerodyne Time-of-Flight ACSM (TOF-ACSM; Fröhlich et al. Citation2013), and the Aerodyne TOF-ACSM with eXtended resolution (TOF-ACSM-X). For all instruments, the ionization cage is nearly identical thus should not impact the interpretation of the RIEOA and ion transmission. Also, the standard vaporizer was used for all instruments (Joo et al. Citation2021). The temperature for the AMS vaporizer was verified using sodium nitrate, as discussed in Williams (Citation2010). All were used to measure ion transmission, and the Q-AMS, Q-ACSM, and TOF-ACSM were used to measure RIEOA of single component OA surrogates and OA surrogates mixed with ammonium nitrate. All instruments were equipped with the standard vaporizer and PM1 lens (Joo et al. Citation2021). A differential mobility analyzer (DMA, TSI 3080, Shoreview, MN, USA), DMA column (TSI 3081), (ultrafine) condensation particle counter (CPC TSI 3775 and UCPC TSI 3776), centrifugal particle mass analyzer (Cambustion CPMA; Olfert and Collings Citation2005), and an atomizer (TSI 3076) were used for the calibrations.
Besides, the measurements conducted in this study, measurements of RIEOA from other instruments from different years (Xu et al. Citation2018) and groups (Katz et al. Citation2021; Slowik et al. Citation2004) are also included. Comparisons of measurements in this study with those from prior studies highlight minimal role in potential slight differences in vaporizer temperature and instrument tuning in the measured RIEOA.
2.2. OA surrogates
A list of OA surrogates used for calibrations is given in . The surrogates were used without further purification, as they were ≥90% purity. All compounds except, anthracene and palmitic acid, are from Sigma-Aldrich; anthracene and palmitic acid are from Fluka. The solvents used for the solutions were either deionized water or acetonitrile (HPLC Plus, ≥99.9%, Sigma-Aldrich). Acetonitrile was selected as the organic solvent as it consistently showed minimal signal (<0.1 µg m−3 OA) when atomized compared to other solvents. No corrections were made for the OA standards as there was minimal change in the mass spectra for standards atomized in water versus atomized in acetonitrile (Figure S1). Ammonium nitrate was used for IE calibrations and as an internal standard. Similar to recommendations for ammonium nitrate calibrations, for the atomizer used (TSI 3076), the solutions used here were at 0.01 M or less, or less than 1000 particles cm−3 at 300 nm. This ensures that there were minimal doubly-charged particles, which impacts the comparison in the mass calculated from the CPC and mass observed by the AMS. An example particle time-of-flight measurement for two of the solutions is shown in Figure S2 to show minimal doubly-charged particles.
Table 1. List of organic standards used to measure species-dependent RIE. For RIEAMS, the values are from standards in acetonitrile. RIEAMS from other solvents and/or mixtures can be found in Table S1.
Some of the solutions used here were mixtures of OA and ammonium nitrate. This provided a means to eliminate the need to measure CE, reducing the complexity of the experiment. Similar to the pure compounds, the total concentration of the solution should be 0.01 M or less, or less than 1000 particles cm−3 at 300 nm, for TSI 3076 atomizer. Approximately equal molar amount of OA standard and ammonium nitrate were dissolved in either water or acetonitrile, depending on OA standard’s ability to dissolve in water. Note, only non-acidic compounds could be mixed with ammonium nitrate, as discussed in Xu et al. (Citation2018).
2.3. Laboratory measurement of OA RIE
The procedure for the RIE calibration has been discussed in prior studies (e.g., Xu et al. Citation2018). The general premise is that a known concentration of the calibrant (Min) is introduced into the AMS or ACSM. The known concentration can either be derived from a CPC, using known mobility diameter from a DMA and density from the calibrant, or by mass selection with a CPMA (Olfert and Collings Citation2005; Xu et al. Citation2018). For simplicity and reproducibility for most laboratory environments, only the CPC and DMA were used for these measurements. Furthermore, as discussed in SI (Section S1 and Figure S3), the use of the CPMA to quantify volatile aerosol mass can lead to uncertainty. The CPMA was only used to determine whether the mixture of ammonium nitrate with OA surrogates were internally or externally mixed. To derive Min (µg m−3), the following equation was used:
(2)
(2)
where dm is the mobility diameter from the DMA (nm), 10−7 is the conversion factor from nm to cm, ρ is the density of the OA standard (g cm−3), N is the particle concentration (cm−3), and 1012 is the conversion factor between g to µg and cm−3 to m−3. Min is then used as to determine the RIE for OA standard as follows:
(3)
(3)
where all other variables are the same as EquationEquation (1)
(1)
(1) . RIENO3 is 1.1 for AMS and 1.05 for ACSM (Canagaratna et al. Citation2007; Middlebrook, Bahreini, and Jimenez Citation2007). Here, we assume that the particles are spherical and that the particle density is equal to the material density.
In EquationEquation (3)(3)
(3) , it is not possible to separate RIES from CES without additional information. We measured CE directly, using the Q-AMS in particle time-of-flight operation mode. The single particles can be directly counted using a “single particle” detection mode. In this mode, the number of single particle events for which AMS ion signal exceeded a threshold signal were counted and ratioed to the number of particles observed by the CPC. This ratio corresponds to a direct measure of the collection efficiency due to the particle bounce:
(4)
(4)
Here, NPToF and NCPC are the particle number concentrations observed from the AMS and CPC, respectively. Compounds found to have CE ∼1 for the Q-AMS were used as single components on other instruments that cannot measure single particles (ACSMs).
Some OA surrogates (non-acidic ones; Xu et al. Citation2018) were mixed with ammonium nitrate to reduce particle bounce, as particles with high ammonium nitrate content have an EB ∼ 1. Ammonium nitrate also provides an internal standard to directly determine the RIEOA. Using the CPMA, it was confirmed that ammonium nitrate was internally mixed with most of the OA surrogates (Figure S4). These mixtures were used on ACSMs to minimize uncertainty in CE. To determine the RIES for the OA standard in mixture, first, the ammonium nitrate mass concentration measured on the AMS/ACSM is converted to the particle concentration (cm−3) using EquationEquation (2)(2)
(2) and the known density (1.72 g cm−3) and ammonium nitrate correction factor (0.8) (Jayne et al. Citation2000). Then, the ammonium nitrate particle concentration is subtracted from the total CPC particle concentration to derive the OA standard particle concentration. Finally, EquationEquations (2)
(2)
(2) and Equation(3)
(3)
(3) are used with the OA standard particle concentration to derive the RIES for the OA standard, with CES = 1.
2.4. Ion transmission measurements
To measure the dependency of ion transmission on m/z, an effusive source of naphthalene was introduced into the detection chamber, similar to the Q-ACSM (Ng et al. Citation2011b). The naphthalene was contained in a stainless-steel bulb with a 1–2 µm pin hole leak. The naphthalene source was located in the ionization chamber for all instruments. The naphthalene spectra were obtained on all the instruments with the inlet closed, ensuring that no external aerosol was influencing the signals at the naphthalene ion fragments. The instruments were operated with inlet closed for at least 24 h prior to sampling naphthalene to ensure OA background had been reduced.
The spectra were analyzed by normalizing the signal at each m/z to the signal at m/z 51. Then, the normalized signal was compared to the normalized NIST spectra for naphthalene (Wallace Citation2022). Finally, any signal that was equal to less than 1% of the parent ion (m/z 128) from the NIST spectra was removed, and groups of closely spaced ions within 5 amu were averaged together (Ng et al. Citation2011b).
3. Investigating the processes governing RIEOA
3.1. RIEOA versus oxidation state
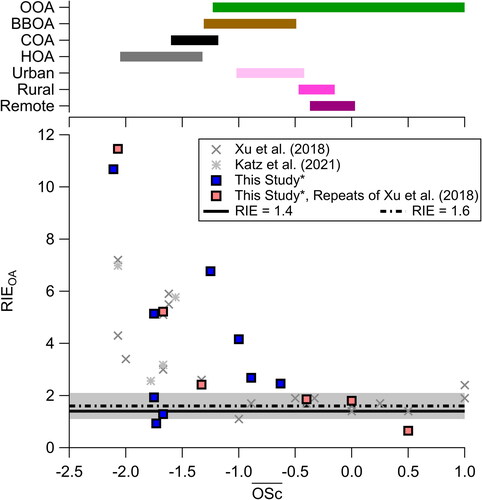
The analysis from Xu et al. (Citation2018) was replicated and expanded with a range of laboratory-generated OA standards ( and ). This included examining standards in different solvents (water versus acetonitrile), mixtures (pure versus with ammonium nitrate), instruments, and lower compounds. As in Xu et al. (Citation2018), for compounds with
similar to more oxidized organic aerosol (OOA) and more background-like OA (rural and remote), the RIEOA shows less variability (mean and one standard deviation is 1.60 ± 0.56 and median is 1.73). However, as
decreases to values less than −0.75, similar to more urban-like OOA and hydrocarbon-like primary OA (cooking OA and hydrocarbon-like OA, COA and HOA, respectively), there is large variability with RIEOA versus
This strongly suggests that though
explains some of the variability in RIEOA, there are numerous other processes impacting RIEOA. Even for the same compound, there are large differences in measured RIEOA, indicating the difficulty and potentially higher uncertainty associated with measuring the RIEOA for the most reduced OA. Further, measurements of the
of ambient aerosol require high-resolution mass spectrometers, which the Q-ACSM, TOF-ACSM, and older AMS measurements (e.g., Q-AMS and CTOF-AMS) lack. Thus, the use of other metrics is desirable to determine the RIEOA.
Figure 1. (Top) Range of oxidation state () reported in Canagaratna et al. (Citation2015) for oxidized organic aerosol (OOA), biomass burning organic aerosol (BBOA), cooking organic aerosol (COA), and hydrocarbon-like organic aerosol (HOA) and in Chen et al. (Citation2015) for locations labeled as urban and urban downwind (urban), rural, and remote. (Bottom) Measured RIEOA from this study for compounds in acetonitrile, from Xu et al. (Citation2018), and from Katz et al. (Citation2021), along with OA RIE = 1.4 and 1.6 ± 0.5 from Xu et al. (Citation2018). Compounds measured in this study that are repeated RIEOA from Xu et al. (Citation2018) are highlighted in red. For all measurements, see Figure S5. The data from this study is from Q-AMS.
3.2. RIEOA comparison between different methods and instruments
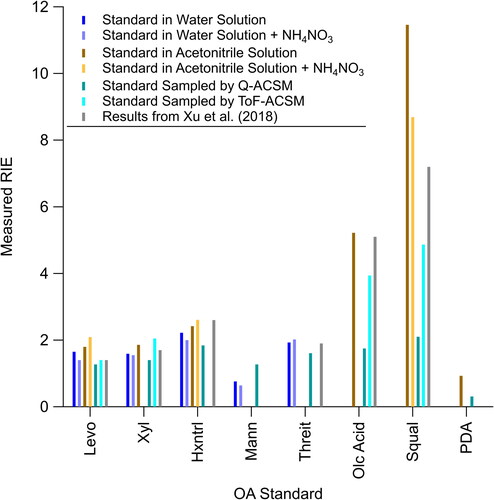
Xu et al. (Citation2018) showed that measurements of internally mixed ammonium nitrate/OA particles were useful for accurately determining the RIEOA of non-acidic OA standards. In these measurements, mixtures were used to explore simpler methods of measuring RIEOA that do not require the use of a CPMA. Ammonium nitrate is used as an internal standard and the measured OA loading is compared to the ratio of OA/NO3 expected from the calibration solution. This method eliminates the need for the CPMA as the mass does not need to be known a priori to measure the RIEOA. Moreover, internal mixing with ammonium nitrate leads to the aerosol having minimal bounce, reducing the uncertainty in CE and need to measure CE. compares the RIEOA for the five SOA-like standards—levoglucosan, xylitol, 1,2,6-hexanetriol, mannitol, and threitol—both pure and mixed with ammonium nitrate. The generally low variability (2–13%, ) observed between these measurements confirms the utility of using internally mixed non-acidic ammonium nitrate/OA particles for these measurements.
Figure 2. Comparison of measured RIE, from Q-AMS, for OA standards levoglucosan (Levo), xylitol (Xyl), 1,2,6-hexanetriol (Hxntrl), mannitol (Mann), threitol (Threit), oleic acid (Olc Acid), squalane (Squal), and pentadecanoic acid (PDA) in different solutions (water vs acetonitrile), mixtures (with or without ammonium nitrate, NH4NO3), with the Q-ACSM or ToF-ACSM, and against results from Xu et al. (Citation2018).
To further investigate the utility of this method, a mass scan with a CPMA at a constant DMA diameter was used to evaluate whether the aerosol particles generated from the mixed OA/ammonium nitrate solution were internally mixed or not. Four different OA standards mixed with ammonium nitrate were measured by CPC and LTOF-AMS. As shown in Figure S4, for SOA-like standards (mannitol and 1,2,6-hexanetriol), the scans show that the OA and ammonium nitrate are internally mixed. This provides further evidence that ammonium nitrate can be mixed with SOA-like, non-acidic, OA standards to measure their RIE without a CPMA. However, for POA-like standards (tetradecane and anthracene), the results are less clear as tetradecane is internally mixed, but anthracene is not internally mixed. Thus, the use of internally mixed particles containing ammonium nitrate does not reduce uncertainties in the measurements of RIEOA for reduced OA. The scans with POA-like standards and ammonium nitrate may partially be impacted by partial evaporation of either component that may occur in the CPMA due to their volatility (e.g., Huffman et al. Citation2009) (see Section S1 and Figure S3).
The effects of different solvents were also investigated since water does not dissolve many OA standards. Using a high purity solvent, e.g., acetonitrile, that fully dissolves different OA standards reduces the need for complex systems, such as custom-built evaporation-condensation generators (Sinclair and La Mer Citation1949; Xu et al. Citation2018). High purity acetonitrile was used as the solvent for standards that are immiscible in water. shows that there was minimal variability across the pure compounds dissolved in water versus compounds dissolved in acetonitrile (8–10% variability). This indicates that there were minimal differences in the interactions between the very polar water and somewhat polar acetonitrile as solvents. Thus, it is expected that there would be similarly minimal interactions with the POA-like OA standards with acetonitrile. Furthermore, shows that there was minimal variability between OA standards mixed with ammonium nitrate, no matter solvent (9–15% variability). This provides more evidence that there was minimal solvent interaction with the OA standard. Taken together, these observations indicate that internal mixtures with ammonium nitrate and different solvents (acetonitrile or H2O) can be used as alternative and simple methods for accurately measuring RIEOA across a wide range of SOA-like standards.
Comparisons of the RIEOA measured using the Q-AMS versus the Q-ACSM and TOF-ACSM show two different trends that depend on OA composition ( and ). First, for the SOA-like standards (levoglucosan, xylitol, 1,2,6-hexantriol, mannitol, and threitol), the three instruments (Q-AMS, Q-ACSM, and TOF-ACSM) agreed within 25%. However, for POA-like standards, such as oleic acid, squalane, and pentadecanoic acid, the Q-ACSM and TOF-ACSM show large differences in RIEOA when compared with the AMS. The largest differences in RIEOA between both versions ACSM and Q-AMS instruments occur for low which is generally associated with measurements of direct and/or fresh emissions of primary particles, and not background OA (e.g., urban background, rural, and remote), where the OA has higher
3.3. Differences in ion transmission across AMSs and ACSMs impacts RIEOA
The mass spectra of POA-like standards generally have a larger fraction of the total signal at higher m/z than those of SOA-like standards. Thus, how sensitive the instruments are to the higher m/z may play an important role in the RIEOA. This can be explicitly seen in EquationEquation (3)(3)
(3) , as lower sum of total ions would lead to lower RIEs. Since the largest differences between AMS and ACSM RIEOA occur with OA standards that have higher fractional total ion signals at higher m/z, the ion transmission, Tm/z, was investigated across instruments. The Tm/z has been measured for the Q-ACSM (Ng et al. Citation2011b); however, it has not been for other ACSMs and AMSs. As discussed in Jimenez et al. (Citation2003), Tm/z affects RIEOA, which makes a priori calculations of RIEOA difficult. However, Tm/z was not considered once the HTOF was introduced, as discussed in DeCarlo et al. (Citation2006).
In , the ion transmission of naphthalene fragments is shown for the Q-ACSM, TOF-ACSM, TOF-ACSM-X, CTOF-AMS/m-AMS, HTOF-AMS, and LTOF-AMS. For this analysis, a linear fit is currently assumed for Tm/z and that the ion transmission goes to 0 at the x-intercept for each individual instrument, as shown in . As there is no data for m/z > 128 (parent ion of naphthalene), it cannot be ruled out that the Tm/z is non-linear. Further, there is plenty of evidence from previous publications that non-zero intensities for ions greater than the x-intercept for the HTOF- and LTOF-AMS have been observed (e.g., Dzepina et al. Citation2007; Malmborg et al. Citation2017; Ulbrich et al. Citation2022a). Thus, the results presented for the remainder should be considered upper limits in Tm/z corrections. The m/z value at which the transmission starts decreasing is lowest for the Q-ACSM (starts at ∼ m/z 51) and highest for the HTOF- and LTOF-AMSs (starts at ∼ m/z 80). Further, how steeply the ion transmission decays show similar values for the ACSMs and CTOF-AMS but a slower decay for the HTOF- and LTOF-AMSs.
Figure 3. Comparison of effective ion transmission (Tm/z) measured on CTOF-AMS, HTOF-AMS, LTOF-AMS, Q-ACSM, TOF-ACSM, and TOF-ACSM-X. The measurements are naphthalene ion fragments measured in each instruments and ratioed to the NIST naphthalene ion fragments reported by Wallace (Citation2022). Each m/z was normalized to the signal at m/z 51 and clusters of ions were averaged. Lines shown are the fit through the points. Note, only signals greater than 1% of the parent ion signal are shown (Ng et al. Citation2011b).
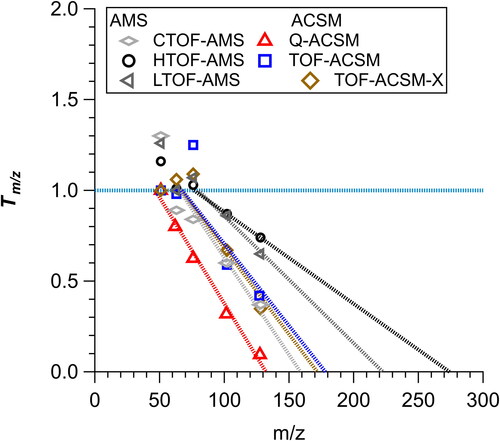
One potential complication interpreting the observed differences in ion transmissions measured across the different instrument versions is the ion extractor and the ion detector. The ion extractor, which is ∼46 mm long, is used in Tofwerk TOFs and is used to transfer the ions from the ionization region into the TOF (Drewnick et al. Citation2005). The ions are guided and made into a parallel beam into the extractor. The ions drift through the extractor at ∼50 eV before the ions are orthogonally extracted into the TOF by a pulsed voltage. Both the TOF-ACSM-X and HTOF-AMS have similar ion extractor and TOF technology; however, the detector is different (multi-channel plate, MCP, for AMS and ETP MagneTOF detector for TOF-ACSM-X). The different ion detectors used in the range of mass spectrometers in this study can exhibit different mass dependent ion detection efficiencies. The apparent lower ion transmission may be associated with the ETP MagneTOF detector detecting high m/z ions less efficiently than the MCP. This, however, does not explain the differences between the CTOF- and HTOF-AMS, as both use MCPs. Though the ion extractor is similar between the CTOF- and HTOF-AMS, the size of the drift tube is different and will affect ion transmission. Thus, a combination of factors that are associated with the TOF and detector impact the apparent Tm/z and complicate the ability to predict RIEOA. The following discussion about Tm/z results should be interpreted as an effective ion transmission, which convolves all potential processes leading to ion detection efficiency.
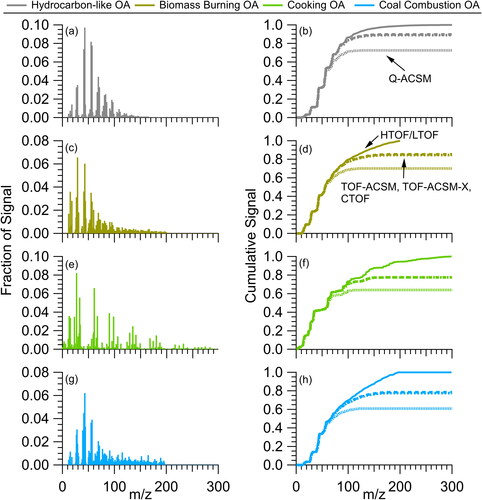
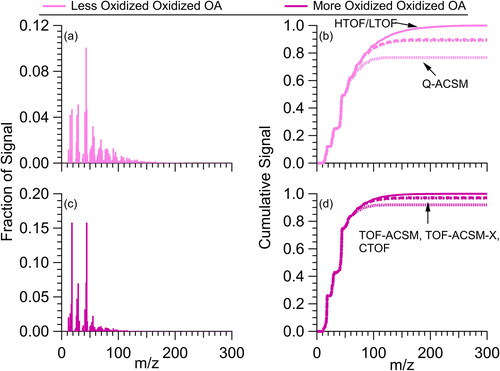
The effect of differences in Tm/z on measured mass is explored with example POA spectra found in the AMS database (Ulbrich et al. Citation2009, Citation2022a, Citation2022b). POA mass spectra generally have more ions at higher m/z () than SOA mass spectra () due to the presence of molecular species that have not yet been photochemically processed (Donahue et al. Citation2012; Jimenez et al. Citation2009) and reduced by thermal decomposition (Canagaratna et al. Citation2015). The cumulative distributions of observed ions, using the Tm/z shown in , show that 60–70% of the total ion signal are observed in the Q-ACSM while 80–90% of the ions are observed in the TOF-ACSM, TOF-ACSM-X, and CTOF-AMS (). Since the Q-ACSM Tm/z is routinely measured with an internal naphthalene standard, reported Q-ACSM mass concentrations typically include a correction for Tm/z (Ng et al. Citation2011b). Thus, for cases where most of the ion signal is < m/z 150, this correction results in Q-ACSM mass concentration are nearly identical to the AMS. For POA dominated cases, however, Q-ACSM mass concentrations are systematically lower than AMS because unmeasured Q-ACSM ion signal above m/z 150 (due to near-zero ion transmission) cannot be corrected for with Tm/z.
Figure 4. Example mass spectra of (a) HOA, (c) BBOA, (c) COA, and (g) CCOA from PMF analysis of ambient data. Spectra taken from the AMS Database (Ulbrich et al. Citation2022b, Citation2022a). The different lines in (b), (d), (f), and (h) represent the cumulative ions observed for Q-ACSM (short-dashed), TOF-ACSM, TOF-ACSM-X, and CTOF-AMS (long-dashed), and HTOF- and LTOF-AMS (solid line). Note, this is an extreme example as ambient aerosol is rarely composed mostly of POA. Further, this is calculated without Q-ACSM Tm/z accounted for, which leads to lower total signal observed. Final processed observations from the Q-ACSM will have total cumulative signal similar to the HTOF and LTOF AMS with Tm/z included.
This is further explored in Figure S6. The mass spectra of oleic acid from the Q-AMS and Q-ACSM are compared, as well as the uncorrected and corrected Tm/z for the Q-ACSM is shown. There is less ion signal in the uncorrected than the corrected (e.g., uncorrected has 6% less ion signal without including Tm/z). However, both uncorrected and corrected Tm/z do not fully account for all the ion signal of oleic acid. The uncorrected signal of oleic acid from the Q-ACSM is 73% of the signal observed on the Q-AMS, and the Tm/z corrected signal from the Q-ACMS is 78% of the signal observed on the Q-AMS. Thus, the RIEOA of oleic acid measured on the Q-ACSM is lower than measured on the Q-AMS Yet, the difference in oleic acid RIEOA is larger between the Q-AMS and Q-ACSM than the 22% difference in Tm/z (), indicating other unknown processes are impacting RIEOA for POA-like OA surrogates measured on the Q-ACSM.
For the SOA, all instruments generally observe a larger fraction of the total ions (>75%, ). Note, the number of ions differs between fresher SOA (less oxidized, oxidized OA, LO-OOA) and more aged SOA (more oxidized, oxidized OA, MO-OOA). A combination of factors could be influencing the larger number of high m/z ions in the LO-OOA spectrum, including the fact that the data is from the average of 15 urban studies (Ng et al. Citation2011a) in which LO-OOA may not be fully separated from POA in the positive matrix factorization (PMF), and/or the fact that the extent of aging for the LO-OOA may be different between campaigns.
Figure 5. Example mass spectra of (a) LO-OOA and (c) MO-OOA from PMF analysis of ambient datasets. Spectra taken from the AMS Database (Ulbrich et al. Citation2022b). Similar to , for (b) and (d), the different lines represent the cumulative ions observed for Q-ACSM (short-dashed), TOF-ACSM, TOF-ACSM-X, and CTOF-AMS (long-dashed), and HTOF- and LTOF-AMS (solid line). Note, this is calculated without Q-ACSM Tm/z accounted for, which leads to lower total signal observed. Final processed observations from the Q-ACSM will have total cumulative signal similar to the HTOF and LTOF AMS with Tm/z included.
For studies that occur in sites away from direct emissions (e.g., urban background sites, rural sites, and remote sites), the differences in ion transmission are expected to have minimal impact on the mass measured between different instrument versions, leading to good agreement between AMS and ACSM results (Crenn et al. Citation2015; Fröhlich et al. Citation2015). However, for studies investigating point sources (e.g., indoor emissions; Katz et al. Citation2021) or less aged SOA, differences in the apparent Tm/z and how it impacts RIEOA may need to be accounted for in comparisons between different AMS and ACSM instruments.
4. Improved Constraints on RIEOA
4.1. Evaluation of laboratory measurements
Because a priori knowledge and/or measurements for molecular weight and are not feasible for the AMSs and ACSMs, another way to constrain RIEOA would be of value. Further, as discussed above,
does not appear to fully explain the measured RIEOA. Since, as discussed above, RIEOA can differ between AMS and ACSM instruments due to Tm/z dependence, we investigated the use of the fractional contributions of ions at high m/z’s compared to total ions observed to parameterize RIEOA. RIEOA as a function of the fractional contribution of ions less than m/z 50, hereafter called fΣm/z50, is shown in . We use m/z 50 because ion transmission is near 100% for all instruments (). Further, as shown in Figure S7, when parameterizing RIEOA as a function of the fractional contribution of ions, a cutoff of m/z 50 provides the best fit (maximum in R2 and a minimum in chi squared) to observations.
Figure 6. (Top) Fraction of observed ions at m/z 50 (fΣm/z50) or less to total observed ions for the PMF factors in and . (Middle) fΣm/z50 for typical urban and rural/remote observations (Ulbrich et al. Citation2022a). (Bottom) Measured RIE of OA (RIEOA) from this study for different instruments versus fΣm/z50. The fit for the observations with fΣm/z50 < 0.64, does not include PAHs and the saturated hydrocarbons, and is only for the AMS. The shaded area is the 95% confidence interval to the fit. Data from Katz et al. (Citation2021) is included to show that the derived fit explains the measured RIE observed in that study while the lower RIEOA from Slowik et al. (Citation2004) is due to the PAHs in the lubricating oil. The slope for the fit is –14.46, intercept is 10.55, and R2 is 0.53.
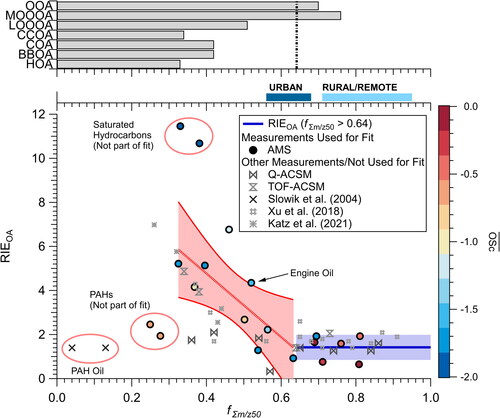
For the AMS data, there were two sets of populations. For standards with fΣm/z50 ≥ 64%, the mean (median) RIEOA was 1.23 ± 0.62 (1.18). The standards sampled with the ACSMs for these compounds fall within the spread in the RIEOA measured with the AMS, in agreement with . As the standards studied here have similar functionalities to SOA, it is expected that they will undergo thermal decomposition to CO2, H2O, CO, and/or smaller molecules (R1–R2). This thermal decomposition prior to electron ionization appears to lead to the RIEOA of 1.23 ± 0.62 for high fΣm/z50 standards.
For OA standards measured on the Q-AMS with fΣm/z50 < 64%, there was an increasing trend between RIEOA and fΣm/z50 upwards. The trend indicates that for each 1% decrease in fΣm/z50, the RIEOA increases by ∼0.07 (absolute value). Compounds in this region generally have long-chain saturated hydrocarbon backbones with lower thermal decomposition than the standards more similar to SOA. However, as discussed above, some thermal decomposition may occur for saturated hydrocarbon backbones (Rice Citation1931, Citation1933; Rice, Johnston, and Evering Citation1932) during thermal decomposition of attached oxygenated functional groups (R1–R2). Measured RIEOA across different AMS instruments and for most standards fall within or very near the 95% interval of the fit, with important exceptions of PAHs and saturated hydrocarbons. Q-ACSM measurements also fall outside this range as discussed below.
PAHs are generally resistant to fragmentation after electron ionization due to the stabilizing effects of the delocalized π-electrons (Dzepina et al. Citation2007; McLafferty and Tureček Citation2021); thus, it is not surprising that the PAHs show the lowest fΣm/z50 values. Also, unlike non-aromatic hydrocarbon that may undergo thermal decomposition at ∼600 °C, PAHs undergo thermal decomposition at much higher temperatures (>1000 °C) (e.g., Tsai et al. Citation2002). Similar to other studies (Dzepina et al. Citation2007; Jimenez et al. Citation2016; Slowik et al. Citation2004), a low RIEOA was observed for the PAH standards, similar to the low RIEOA for lubricating oil with PAHs. PAHs generally have lower cross sections than compounds of similar carbon number (Bose and Westmoreland Citation2020; Harrison et al. Citation1966), potentially suggesting a lower RIEOA compared to other compounds. However, unlike other compounds, the cross sections for PAHs can vary widely for the same number of carbon atoms or same number of fused rings (Bose and Westmoreland Citation2020), again indicating that predicting the RIEOA for these species is challenging. Furthermore, minimal fragmentation for the high molecular weight PAHs may lead to lower overall observation due to the Tm/z being <100% at the m/z of the parent compounds (). Thus, the combination of these processes is thought to lead to the deviation of RIEOA versus fΣm/z50. However, PAHs are generally a small fraction of the total OA signal (less than 1%) (e.g., Dzepina et al. Citation2007); so, this deviation from the observed trend of RIEOA versus fΣm/z50 will not impact interpretation of most ambient measurements. Finally, this deviation is also observed for aromatic-containing standards, as the one point from Xu et al. (Citation2018) well below the uncertainty in the trend of RIEOA versus fΣm/z50 is phthalic acid. The contribution of pure aromatic backbone SOA compounds to ambient OA is not as well established, to date; thus, the impact of aromatic containing SOA compounds to RIEOA is unknown.
Lubricating oil was also investigated in this study because it may be another potentially important contribution to HOA (e.g., Worton et al. Citation2014). For non-PAH containing lubricating oil, RIEOA versus fΣm/z50 follows the same trend in RIEOA (point labeled Engine Oil in ). Slowik et al. (Citation2004) and Jimenez et al. (Citation2016) reported lubricating oil to have an RIEOA ∼1.4, but the lubricating oil studied in Slowik et al. (Citation2004) was composed of PAHs, which generally has lower RIEOA (). Thus, while different from the non-PAH lubricating oil measurements, the RIEOA reported in Slowik et al. (Citation2004) is consistent with the PAH standard results reported here and do not follow the trend of RIEOA versus fΣm/z50.
Saturated hydrocarbons RIEOA show the largest differences between studies and measurements (). This may reflect a combination of processes, including how the standards were atomized (including partial evaporation with CPMA), the amount of thermal decomposition prior to ionization (R3–R9), and Tm/z. RIEOA is highly variable for these standards. Since the volatility of saturated hydrocarbons is high (e.g., Lu, Zhao, and Robinson Citation2018), the contribution of saturated hydrocarbons to the HOA PMF factor is expected to be low. As prior studies have indicated that HOA and other POA contains oxygen and other functional groups, and the compounds measured in this study that fall within the trend in also have oxygen functional groups, the deviation from the saturated hydrocarbons will have minimal influence on the interpretation of ambient measurements.
Similar to the AMS, the ACSMs measured the RIEOA for standards similar to SOA of ∼1.4 (e.g., fΣm/z50 > 0.64). However, for fΣm/z50 < 0.64, two different populations occur for the Q-ACSM and TOF-ACSM; Q-ACSM RIEOA remains constant between 1 and 2 while the TOF-ACSM shows a slower increase in RIEOA versus decreasing fΣm/z50. As has been discussed throughout, the higher m/z ions appear to be contributing to the higher RIEOA. However, as discussed in Section 3.3 and shown in , the ACSMs have lower Tm/z than the AMS. Note, the Q-ACSM corrects for the fraction of ions not observed above m/z 50 with the measured Tm/z (Ng et al. Citation2011b) and thus leads to similar total ions as observed with the AMS for cases where all ion signal is observed at m/z < 150. As shown in , for many types of POA, 4–13% of the ions are found at m/z > 150. Since the transmission efficiency for the Q-ACSM is near zero for these higher m/z ions, these ions are not measured and thus not easily corrected for (). However, as the Tm/z correction should only lead to a smaller difference than observed, other unknown processes are likely also impacting the differences between the observed RIEOA measured on the Q-ACSM and AMS. This could lead to the relatively constant RIEOA for the Q-ACSM at low fΣm/z50. Since the TOF-ACSM detects a higher fraction of ions with m/z > 150 (), the trend between the RIEOA versus fΣm/z50 is more apparent. The TOF-ACSM RIEOA is generally lower than that of the AMS due to the lower transmission efficiency of the TOF-ACSM compared to the AMS ( and ).
4.2. Comparison of the Improved Constraints on RIEOA with external dataset
Consistency between these measurements and an external dataset from Katz et al. (Citation2021) further verifies the relationship between RIEOA and fΣm/z50, as shown in . As Katz et al. (Citation2021) measured the RIEOA on a different AMS instrument and a separate technique, this provides confidence in the relationship to better constrain the RIEOA. Using the fΣm/z50 observed by Katz et al. (Citation2021) for the HOMEChem COA observations (34%), the derived relationship shown in would suggest an RIEOA of 5.63 ± 1.17. This agrees with the average RIEOA during HOMEChem of 5.57 ± 3.71 at the 95% confidence interval. Also, using the fΣm/z50 for HOA and COA, the predicted RIEOA for the ambient measurements from Philadelphia (Avery, Waring, and DeCarlo Citation2019), reanalyzed in Katz et al. (Citation2021), would be between 4.44 ± 1.17 and 5.49 ± 1.70, which is in agreement with the RIEOA calculated for the data set of 4.16.
Similar to the trends observed in the analysis of OA standards with Q-ACSM and TOF-ACSM (e.g., ), Katz et al. (Citation2021) observed differences in RIEOA agreement between the Q- and TOF-ACSMs and HTOF-AMS. The ACSMs were about a factor 2 lower than the HTOF-AMS and SMPSs. This is a similar factor difference for the measured oleic acid RIEOA observed between the AMS and Q-ACSM (). Due to Tm/z corrections, though, it is expected that the Q-ACSM would only be lower than the factor of 2 observed. At this point, it is not apparent what is leading to the higher difference between the Q-ACSM and HTOF-AMS. Therefore, caution is recommended when measuring direct reduced OA sources with the Q-ACSM.
4.3. Atmospheric implications for fΣm/z50 for the AMS and ACSM
also shows the range of fΣm/z50 observed for bulk OA measurements from urban and rural/remote (Ulbrich et al. Citation2009, Citation2022a, Citation2022b) sites. Various urban studies show fΣm/z50 ranges from 0.56 to 0.68. The fΣm/z50 for urban sites is higher than pure POA and between LO-OOA and MO-OOA because urban sites are typically dominated by SOA (Jimenez et al. Citation2009). Though some urban sites fall below fΣm/z50 < 64%, the uncertainty in the fit of RIEOA versus fΣm/z50 is still consistent with the use of an RIEOA of 1.4 for bulk OA. Away from urban regions, except for biomass burning events, the contribution of POA is minimal (Jimenez et al. Citation2009), leading to the rural and remote mass spectra being dominated by ions less than m/z 50 (). Thus, the results in indicate that the RIEOA of 1.4 is applicable for urban background measurements that are not strongly impacted by fresh/local emissions.
The fΣm/z50 for different POA factors fall in the same region where RIEOA increases for the OA standards. As POA factors contribute a small fraction of the bulk OA in urban environments (Jimenez et al. Citation2009), their contribution is minor for RIEOA. However, when conducting source apportionment with PMF and/or directly sampling source aerosol, higher RIEOA will be necessary (Katz et al. Citation2021; Reyes-Villegas et al. Citation2018). This indicates primary-like OA reported with PMF may be an upper-estimate due to the higher RIEOA; however, due to the potential competing effects stated before (particle lens transmission, internal versus external mixing), there may be offsetting effects that may reduce the overall amount the primary-OA is over-estimated. As shown in Jimenez et al. (Citation2016), within the stated uncertainty of the AMS and Sunset OC instrument, there was minimal systematic difference between the two instruments even at high primary OA fractional contribution to total OA in an urban environment. An important caveat for implementing the observed trend in RIEOA versus fΣm/z50 at this time, though, for ambient data, is that the trend was derived with lab-generated OA standards. This means that there are no competing effects with particle lens transmission and/or internally versus externally mixed aerosol. The aerosol was size-selected to ensure 100% transmission, which may not be possible for primary aerosol in ambient conditions (Zhang et al. Citation2005a, Citation2005b). Also, the EB was well characterized either with counting of single particles on the Q-AMS or mixtures of ammonium nitrate and OA surrogates. Fresh POA generally is not well-mixed with rest of the non-refractory aerosol, resulting in not well characterized EB (Canagaratna et al. Citation2004; Zhang et al. Citation2005a, Citation2005b). As shown in EquationEquation (1)(1)
(1) , OA mass concentration is a function of the product CE and RIEOA. POA CE and RIEOA may have off-setting effects on mass concentration. Thus, the parameterization shown in may result in incorrect RIEOA as this parameterization does not take EL and EB into account. However, fΣm/z50 will provide a metric to determine if a higher RIEOA will be needed for the OA. If the observed fΣm/z50 is < 0.64, this indicates that the OA with RIEOA = 1.4 would be an upper limit of the OA mass concentration.
5. Conclusions
As organic aerosol, OA, is an important fraction of particulate matter, accurate quantification of its mass concentration is important. Here, the organic aerosol relative ionization efficiency, RIEOA, was measured on the Aerodyne Aerosol Mass Spectrometer (AMS) and Aerosol Chemical Speciation Monitor (ACSM) (involving a total of 7 different mass spectrometers) to further evaluate what controls the RIEOA and how the different instruments respond to OA standards. Although the OA oxidation state explains some of the differences in measured RIEOA for different standards, there is also large variability in the RIEOA for a given OA oxidation state. In this study, a new metric was developed to investigate RIEOA for the AMS and ACSM, and the results from this study are summarized below.
The RIEOA for different OA surrogates were measured on the Q-AMS, Q-ACSM, and TOF-ACSM. It was found that for SOA-like standards, the RIEOA agreed across the three instruments; however, for POA-like standards, there were differences in the measured RIEOA with the Q-AMS having higher RIEOA than the TOF-ACSM (intermediate) and Q-ACSM (lowest).
Further, there were minimal differences in the measured RIEOA when different solvents were used (water versus acetonitrile) and in comparing pure OA-standard to a mixture of an OA-standard with ammonium nitrate. The use of ammonium nitrate alleviates the need to measure the collection efficiency and to directly measure the RIEOA.
Some of the differences in the RIEOA can be partially explained due to differences in the dependency of the ion transmission on m/z (Tm/z). This dependency is most important for the ACSMs measuring fresh POA emissions.
The fractional contribution of the total ion signal for ions less than m/z 50, which is denoted fΣm/z50, provides a more robust method to predict how RIEOA varies across OA standards.
The metric fΣm/z50 indicates that for bulk urban aerosol away from fresh, direct POA emissions, rural OA, and remote OA, the RIEOA is 1.23 ± 0.62, in agreement with the value of 1.4. This metric can be used to either determine if bulk OA or OA factors from positive matrix factorization may need a higher RIEOA and may be over-estimated.
The metric and measured RIEOA found in this study is applicable to prior measurements using different AMSs, providing overall confidence in this metric’s sensitivity to the tuning and vaporizer temperature.
The metric also assists in explaining the differences in RIEOA observed between polycyclic aromatic hydrocarbons and other POA-like OA.
Finally, the metric shows how the ACSMs measured RIEOA behaves differently than the AMS measured RIEOA.
However, it is important to keep the caveat in mind that there may be competing factors impacting the quantification of POA aerosol, including particle lens transmission and/or internally versus externally mixed aerosol.
At this time, it is still encouraged to report POA mass concentration from PMF and source apportionment studies with RIEOA = 1.4 as an upper-limit, the fΣm/z50 for the PMF or direct OA measurement, and the potentially lower limit of the OA mass concentration with the caveat about particle lens transmission and mixing state of OA.
As the newly proposed behavior of RIEOA versus fΣm/z50 has only been investigated for laboratory standards and a subset of published observations, further evaluation of this trend needs to be conducted on ambient measurements before it can be widely used to correct AMS and ACSM measurements.
Supplemental Material
Download MS Word (6.9 MB)Acknowledgement
We acknowledge Wen Xu for use of data in this analysis and discussions with the AMS and ACSM Users’.
Data availability statement
Mass spectra for and are available at https://cires1.colorado.edu/jimenez-group/AMSsd/ and https://cires1.colorado.edu/jimenez-group/HRAMSsd/. The rest of data is available upon request.
Additional information
Funding
References
- Alfrarra, M. 2004. Insights into atmospheric organic aerosols using an aerosol mass spectrometer. PhD diss. Manchester Institute of Science and Technology.
- Avery, A. M., M. S. Waring, and P. F. DeCarlo. 2019. Seasonal variation in aerosol composition and concentration upon transport from outdoor to indoor environment. Environ. Sci. Process. Impacts. 21 (3):528–47. doi:10.1039/C8EM00471D.
- Bose, A., and P. R. Westmoreland. 2020. Predicting total electron-ionization cross sections and GC-MS calibration factors using machine learning. J. Phys. Chem. A 124 (50):10600–15. doi:10.1021/acs.jpca.0c06308.
- Canagaratna, M. R., J. T. Jayne, D. A. Ghertner, S. Herndon, Q. Shi, J. L. Jimenez, P. J. Silva, P. Williams, T. Lanni, F. Drewnick, et al. 2004. Chase studies of particulate emissions from in-use New York City vehicles. Aerosol. Sci. Technol. 38 (6):555–73. doi:10.1080/02786820490465504.
- Canagaratna, M. R., J. T. Jayne, J. L. Jimenez, J. D. Allan, M. R. Alfarra, Q. Zhang, T. B. Onasch, F. Drewnick, H. Coe, A. M. Middlebrook, et al. 2007. Chemical and microphysical characterization of ambient aerosols with the aerodyne aerosol mass spectrometer. Mass Spectrom. Rev. 26 (2):185–222. doi:10.1002/mas.20115.
- Canagaratna, M. R., J. L. Jimenez, J. H. Kroll, Q. Chen, S. H. Kessler, P. Massoli, L. Hildebrandt Ruiz, E. Fortner, L. R. Williams, K. R. Wilson, et al. 2015. Elemental ratio measurements of organic compounds using aerosol mass spectrometry: Characterization, improved calibration, and implications. Atmos. Chem. Phys. 15 (1):253–72. doi:10.5194/acp-15-253-2015.
- Chen, G., F. Canonaco, A. Tobler, W. Aas, A. Alastuey, J. Allan, S. Atabakhsh, M. Aurela, U. Baltensperger, A. Bougiatioti, et al. 2022. European aerosol phenomenology—8: Harmonised source apportionment of organic aerosol using 22 Year-long ACSM/AMS datasets. Environ. Int. 166:107325. doi:10.1016/j.envint.2022.107325.
- Chen, Q., C. L. Heald, J. L. Jimenez, M. R. Canagaratna, L. He, X.-F. Huang, P. Campuzano-Jost, B. B. Palm, L. Poulain, M. Kuwata, et al. 2015. Elemental composition of organic aerosol: The gap between ambient and laboratory measurements. Geophys. Res. Lett. 42 (10):4182–9. doi:10.1002/2015GL063693.
- Cohen, A. J., M. Brauer, R. Burnett, H. R. Anderson, J. Frostad, K. Estep, K. Balakrishnan, B. Brunekreef, L. Dandona, R. Dandona, et al. 2017. Estimates and 25-year trends of the global burden of disease attributable to ambient air pollution: An analysis of data from the Global Burden of Diseases Study 2015. Lancet 389 (10082):1907–18. doi:10.1016/S0140-6736(17)30505-6.
- Crenn, V., J. Sciare, P. L. Croteau, S. Verlhac, R. Fröhlich, C. A. Belis, W. Aas, M. Äijälä, A. Alastuey, B. Artiñano, et al. 2015. ACTRIS ACSM intercomparison—Part 1: Reproducibility of concentration and fragment results from 13 individual Quadrupole Aerosol Chemical Speciation Monitors (Q-ACSM) and consistency with co-located instruments. Atmos. Meas. Tech. 8 (12):5063–87. doi:10.5194/amt-8-5063-2015.
- DeCarlo, P. F., E. J. Dunlea, J. R. Kimmel, A. C. Aiken, D. Sueper, J. Crounse, P. O. Wennberg, L. Emmons, Y. Shinozuka, A. Clarke, et al. 2008. Fast airborne aerosol size and chemistry measurements above Mexico City and Central Mexico during the MILAGRO campaign. Atmos. Chem. Phys. 8 (14):4027–48. doi:10.5194/acp-8-4027-2008.
- DeCarlo, P. F., J. R. Kimmel, A. Trimborn, M. J. Northway, J. T. Jayne, A. C. Aiken, M. Gonin, K. Fuhrer, T. Horvath, K. S. Docherty, et al. 2006. Field-deployable, high-resolution, time-of-flight aerosol mass spectrometer. Anal. Chem. 78 (24):8281–9. doi:10.1021/ac061249n.
- Donahue, N. M., J. H. Kroll, S. N. Pandis, and A. L. Robinson. 2012. A two-dimensional volatility basis set-Part 2: Diagnostics of organic-aerosol evolution. Atmos. Chem. Phys. 12 (2):615–34. doi:10.5194/acp-12-615-2012.
- Drewnick, F., S. S. Hings, P. DeCarlo, J. T. Jayne, M. Gonin, K. Fuhrer, S. Weimer, J. L. Jimenez, K. L. Demerjian, S. Borrmann, et al. 2005. A New Time-of-Flight Aerosol Mass Spectrometer (TOF-AMS)—Instrument Description and First Field Deployment. Aerosol Sci. Technol 39 (7):637–58. doi:10.1080/02786820500182040.
- Dzepina, K., J. Arey, L. C. Marr, D. R. Worsnop, D. Salcedo, Q. Zhang, T. B. Onasch, L. T. Molina, M. J. Molina, and J. L. Jimenez. 2007. Detection of particle-phase polycyclic aromatic hydrocarbons in Mexico City using an aerosol mass spectrometer. Int. J. Mass Spectrom 263 (2–3):152–70. doi:10.1016/j.ijms.2007.01.010.
- Fröhlich, R., V. Crenn, A. Setyan, C. A. Belis, F. Canonaco, O. Favez, V. Riffault, J. G. Slowik, W. Aas, M. Aijälä, et al. 2015. ACTRIS ACSM intercomparison—Part 2: Intercomparison of ME-2 organic source apportionment results from 15 individual, co-located aerosol mass spectrometers. Atmos. Meas. Tech. 8 (6):2555–76. doi:10.5194/amt-8-2555-2015.
- Fröhlich, R., M. J. Cubison, J. G. Slowik, N. Bukowiecki, A. S. H. Prévôt, U. Baltensperger, J. Schneider, J. R. Kimmel, M. Gonin, U. Rohner, et al. 2013. The ToF-ACSM: A portable aerosol chemical speciation monitor with TOFMS detection. Atmos. Meas. Tech. 6 (11):3225–41. doi:10.5194/amt-6-3225-2013.
- Hallquist, M., J. C. Wenger, U. Baltensperger, Y. Rudich, D. Simpson, M. Claeys, J. Dommen, N. M. Donahue, C. George, A. H. Goldstein, et al. 2009. The formation, properties and impact of secondary organic aerosol: Current and emerging issues. Atmos. Chem. Phys. 9 (14):5155–236. doi:10.5194/acp-9-5155-2009.
- Harrison, A. G., E. G. Jones, S. K. Gupta, and G. P. Nagy. 1966. Total Cross sections for ionization by electron impact. Can. J. Chem. 44 (16):1967–73. doi:10.1139/v66-293.
- Hayes, P. L., A. M. Ortega, M. J. Cubison, K. D. Froyd, Y. Zhao, S. S. Cliff, W. W. Hu, D. W. Toohey, J. H. Flynn, B. L. Lefer, et al. 2013. Organic aerosol composition and sources in Pasadena, California, during the 2010 CalNex campaign. J. Geophys. Res. Atmos. 118 (16):9233–57. doi:10.1002/jgrd.50530.
- Huffman, J. A., K. S. Docherty, A. C. Aiken, M. J. Cubison, I. M. Ulbrich, P. F. DeCarlo, D. Sueper, J. T. Jayne, D. R. Worsnop, P. J. Ziemann, et al. 2009. Chemically-resolved aerosol volatility measurements from two megacity field studies. Atmos. Chem. Phys. 9 (18):7161–82. doi:10.5194/acp-9-7161-2009.
- Huffman, J. A., J. T. Jayne, F. Drewnick, A. C. Aiken, T. Onasch, D. R. Worsnop, and J. L. Jimenez. 2005. Design, modeling, optimization, and experimental tests of a particle beam width probe for the Aerodyne aerosol mass spectrometer. Aerosol Sci. Technol 39 (12):1143–63. doi:10.1080/02786820500423782.
- Jayne, J. T., D. C. Leard, X. F. Zhang, P. Davidovits, K. A. Smith, C. E. Kolb, and D. R. Worsnop. 2000. Development of an aerosol mass spectrometer for size and composition analysis of submicron particles. Aerosol Sci. Technol. 33 (1–2):49–70. doi:10.1080/027868200410840.
- Jimenez, J. L., M. R. Canagaratna, N. M. Donahue, A. S. H. Prévôt, Q. Zhang, J. H. Kroll, P. F. DeCarlo, J. D. Allan, H. Coe, N. L. Ng, et al. 2009. Evolution of organic aerosols in the atmosphere. Science 326 (5959):1525–9. doi:10.1126/science.1180353.
- Jimenez, J. L., M. R. Canagaratna, F. Drewnick, J. D. Allan, M. R. Alfarra, A. M. Middlebrook, J. G. Slowik, Q. Zhang, H. Coe, J. T. Jayne, et al. 2016. Comment on “The effects of molecular weight and thermal decomposition on the sensitivity of a thermal desorption aerosol mass spectrometer. Aerosol Sci. Technol. 50 (9):i–xv. ” doi:10.1080/02786826.2016.1205728.
- Jimenez, J. L., J. T. Jayne, Q. Shi, C. E. Kolb, D. R. Worsnop, I. Yourshaw, J. H. Seinfeld, R. C. Flagan, X. Zhang, K. A. Smith, et al. 2003. Ambient aerosol sampling using the aerodyne aerosol mass spectrometer. J. Geophys. Res. 108 (D7):8425. doi:10.1029/2001JD001213.
- Joo, T., Y. Chen, W. Xu, P. Croteau, M. R. Canagaratna, D. Gao, H. Guo, G. Saavedra, S. S. Kim, Y. Sun, et al. 2021. Evaluation of a new aerosol chemical speciation monitor (ACSM) system at an urban site in Atlanta, GA: The use of capture vaporizer and PM2.5 inlet. ACS Earth Space Chem. 5 (10):2565–76. doi:10.1021/acsearthspacechem.1c00173.
- Katz, E. F., H. Guo, P. Campuzano-Jost, D. A. Day, W. L. Brown, E. Boedicker, M. Pothier, D. M. Lunderberg, S. Patel, K. Patel, et al. 2021. Quantification of cooking organic aerosol in the indoor environment using Aerodyne aerosol mass spectrometers. Aerosol Sci. Technol. 55 (10):1099–114. doi:10.1080/02786826.2021.1931013.
- Kroll, J. H., N. M. Donahue, J. L. Jimenez, S. H. Kessler, M. R. Canagaratna, K. R. Wilson, K. E. Altieri, L. R. Mazzoleni, A. S. Wozniak, H. Bluhm, et al. 2011. Carbon oxidation state as a metric for describing the chemistry of atmospheric organic aerosol. Nat. Chem. 3 (2):133–9. doi:10.1038/nchem.948.
- Liu, P., P. J. Ziemann, D. B. Kittelson, and P. H. McMurry. 1995a. Generating particle beams of controlled dimensions and divergence: II. Experimental evaluation of particle motion in aerodynamic lenses and nozzle expansions. Aerosol Sci. Technol. 22 (3):314–24. doi:10.1080/02786829408959749.
- Liu, P., P. J. Ziemann, D. B. Kittelson, and P. H. McMurry. 1995b. Generating particle beams of controlled dimensions and divergence: I. Theory of particle motion in aerodynamic lenses and nozzle expansions. Aerosol Sci. Technol. 22 (3):293–313. doi:10.1080/02786829408959748.
- Lu, Q., Y. Zhao, and A. L. Robinson. 2018. Comprehensive organic emission profiles for gasoline, diesel, and gas-turbine engines including intermediate and semi-volatile organic compound emissions. Atmos. Chem. Phys. 18 (23):17637–54. doi:10.5194/acp-18-17637-2018.
- Malmborg, V. B., A. C. Eriksson, M. Shen, P. Nilsson, Y. Gallo, B. Waldheim, J. Martinsson, Ö. Andersson, and J. Pagels. 2017. Evolution of in-cylinder diesel engine soot and emission characteristics investigated with online aerosol mass spectrometry. Environ. Sci. Technol. 51 (3):1876–85. doi:10.1021/acs.est.6b03391.
- McLafferty, F. W., and F. Tureček. 2021. Interpretation of Mass Spectra, 4th ed. New York: University Science Books.
- Middlebrook, A. M., R. Bahreini, and J. L. Jimenez. 2007. Reinvestigating nitrate relative ionization efficiency. Paper presented at the 8th AMS Users’ Meeting 2007, Reno, NV, USA, September 30.
- Middlebrook, A. M., R. Bahreini, J. L. Jimenez, and M. R. Canagaratna. 2012. Evaluation of composition-dependent collection efficiencies for the aerodyne aerosol mass spectrometer using field data. Aerosol Sci. Technol. 46 (3):258–71. doi:10.1080/02786826.2011.620041.
- Moise, T., J. M. Flores, and Y. Rudich. 2015. Optical properties of secondary organic aerosols and their changes by chemical processes. Chem. Rev. 115 (10):4400–39. doi:10.1021/cr5005259.
- Moldoveanu, S. 2018. Pyrolysis of organic molecules: Applications to health and environmental issues, 2nd ed. Elsevier Science. https://www.sciencedirect.com/book/9780444640000/pyrolysis-of-organic-molecules.
- Monks, P. S., C. Granier, S. Fuzzi, A. Stohl, M. L. Williams, H. Akimoto, M. Amann, A. Baklanov, U. Baltensperger, I. Bey, et al. 2009. Atmospheric composition change—global and regional air quality. Atmos. Environ. 43 (33):5268–350. doi:10.1016/j.atmosenv.2009.08.021.
- Murphy, D. M. 2016. The effects of molecular weight and thermal decomposition on the sensitivity of a thermal desorption aerosol mass spectrometer. Aerosol Sci. Technol. 50 (2):118–25. doi:10.1080/02786826.2015.1136403.
- Myhre, G., D. Shindell, F.-M. Bréon, W. Collins, J. Fuglestvedt, J. Huang, D. Koch, J.-F. Lamarque, D. Lee, B. Mendoza, et al. 2013. Anthropogenic and natural radiative forcing. In Climate Change 2013: The Physical Science Basis. Contribution of Working Group I to the Fifth Assessment Report of the Intergovernmental Panel on Climate Change, T.F. Stocker, D. Qin, G.-K. Plattner, M. Tignor, S.K. Allen, J. Boschung, A. Nauels, Y. Xia, V. Bex, P.M. Midgley, Eds, Cambridge, United Kingdom and New York, NY, USA: Cambridge University Press, 659.
- Nault, B. A., P. Campuzano-Jost, D. A. Day, J. C. Schroder, B. Anderson, A. J. Beyersdorf, D. R. Blake, W. H. Brune, Y. Choi, C. A. Corr, et al. 2018. Secondary organic aerosol production from local emissions dominates the organic aerosol budget over Seoul, South Korea, during KORUS-AQ. Atmos. Chem. Phys. 18 (24):17769–800. doi:10.5194/acp-18-17769-2018.
- Ng, N. L., M. R. Canagaratna, J. L. Jimenez, Q. Zhang, I. M. Ulbrich, and D. R. Worsnop. 2011a. Real-time methods for estimating organic component mass concentrations from aerosol mass spectrometer data. Environ. Sci. Technol. 45 (3):910–6. doi:10.1021/es102951k.
- Ng, N. L., S. C. Herndon, A. Trimborn, M. R. Canagaratna, P. L. Croteau, T. B. Onasch, D. Sueper, D. R. Worsnop, Q. Zhang, Y. L. Sun, et al. 2011b. An Aerosol Chemical Speciation Monitor (ACSM) for routine monitoring of the composition and mass concentrations of ambient aerosol. Aerosol Sci. Technol. 45 (7):780–94. doi:10.1080/02786826.2011.560211.
- Olfert, J. S., and N. Collings. 2005. New method for particle mass classification—The Couette centrifugal particle mass analyzer. Aerosol Sci. 36 (11):1338–52. doi:10.1016/j.jaerosci.2005.03.006.
- Reyes-Villegas, E., T. Bannan, M. Le Breton, A. Mehra, M. Priestley, C. Percival, H. Coe, and J. D. Allan. 2018. Online chemical characterization of food-cooking organic aerosols: Implications for source apportionment. Environ. Sci. Technol. 52 (9):5308–18. doi:10.1021/acs.est.7b06278.
- Rice, F. O. 1933. The thermal decomposition of organic compounds from the standpoint of free radicals. III. The calculation of the products formed from paraffin hydrocarbons. J. Am. Chem. Soc. 55 (7):3035–40. doi:10.1021/ja01334a075.
- Rice, F. O. 1931. From the standpoint of free radicals. I. J. Am. Chem. Soc. 53 (5):1959–72. doi:10.1021/ja01356a053.
- Rice, F. O., W. R. Johnston, and B. L. Evering. 1932. The thermal decomposition of organic compounds from the standpoint of free radicals. II. Experimental evidence of the decomposition of organic compouds into free radicals. J. Am. Chem. Soc. 54 (9):3529–43. doi:10.1021/ja01348a007.
- Rudich, Y., N. M. Donahue, and T. F. Mentel. 2007. Aging of organic aerosol: Bridging the gap between laboratory and field studies. Annu. Rev. Phys. Chem. 58:321–52. doi:10.1146/annurev.physchem.58.032806.104607.
- Sinclair, D., and V. K. La Mer. 1949. Light scattering as a measure of particle size in aerosols. The production of monodisperse aerosols. Chem. Rev. 44 (2):245–67. doi:10.1021/cr60138a001.
- Slowik, J. G., K. Stainken, P. Davidovits, L. R. Williams, J. T. Jayne, C. E. Kolb, D. R. Worsnop, Y. Rudich, P. F. DeCarlo, and J. L. Jimenez. 2004. Particle morphology and density characterization by combined mobility and aerodynamic diameter measurements. Part 2: Application to combustion-generated soot aerosols as a function of fuel equivalence ratio. Aerosol Sci. Technol. 38 (12):1206–22. doi:10.1080/027868290903916.
- Tsai, P. J., H. Y. Shieh, W. J. Lee, and S. O. Lai. 2002. Characterization of PAHs in the atmosphere of carbon black manufacturing workplaces. J. Hazard. Mater. 91 (1–3):25–42. doi:10.1016/S0304-3894(01)00384-3.
- Ulbrich, I. M., M. R. Canagaratna, Q. Zhang, D. R. Worsnop, and J. L. Jimenez. 2009. Interpretation of organic components from positive matrix factorization of aerosol mass spectrometric data. Atmos. Chem. Phys. 9 (9):2891–918. doi:10.5194/acp-9-2891-2009.
- Ulbrich, I. M., A. V. Handschy, M. Lechner, and J. L. Jimenez. 2022a. High-resolution AMS spectral database. Available at http://cires.colorado.edu/jimenez-group/HRAMSsd/ (Accessed 17 August 2022).
- Ulbrich, I. M., A. V. Handschy, M. Lechner, and J. L. Jimenez. 2022b. AMS spectral database. Available at https://cires1.colorado.edu/jimenez-group/AMSsd/ (Accessed 17 August 2022).
- Wallace, W. E. 2022. Mass spectra. In NIST Chemistry WebBook, NIST Standard Reference Database Number 69, P.J. Linstrom, W.G. Mallard, Eds. Gaithersburg MD: National Institute of Standards and Technology, 20899.
- Williams, L. 2010. What is my vaporizer temperature? Vaporizer temperature power curve for several systems. Paper presented at the 11th AMS Users’ Meeting 2010, Hyytiala, Finland, September 5.
- Worton, D. R., G. Isaacman, D. R. Gentner, T. R. Dallmann, A. W. H. Chan, C. Ruehl, T. W. Kirchstetter, K. R. Wilson, R. A. Harley, and A. H. Goldstein. 2014. Lubricating oil dominates primary organic aerosol emissions from motor vehicles. Environ. Sci. Technol. 48 (7):3698–706. doi:10.1021/es405375j.
- Xu, W., P. Croteau, L. Williams, M. Canagaratna, T. Onasch, E. Cross, X. Zhang, W. Robinson, D. Worsnop, and J. Jayne. 2017. Laboratory characterization of an aerosol chemical speciation monitor with PM2.5 measurement capability. Aerosol Sci. Technol. 51 (1):69–83. doi:10.1080/02786826.2016.1241859.
- Xu, W., A. Lambe, P. Silva, W. Hu, T. Onasch, L. Williams, P. Croteau, X. Zhang, L. Renbaum-Wolff, E. Fortner, et al. 2018. Laboratory evaluation of species-dependent relative ionization efficiencies in the Aerodyne aerosol mass spectrometer. Aerosol Sci. Technol. 52 (6):626–41. doi:10.1080/02786826.2018.1439570.
- Zhang, Q., M. R. Alfarra, D. R. Worsnop, D. James, H. Coe, M. R. Canagaratna, and J. L. Jimenez. 2005a. Deconvolution and quantification of hydrocarbon-like and oxygenated organic aerosols based on aerosol mass spectrometry deconvolution and quantification of hydrocarbon-like and oxygenated organic aerosols based on aerosol mass spectrometry. Environ. Sci. Technol. 39 (13):4938–52. doi:10.1021/es048568l.
- Zhang, Q., J. L. Jimenez, M. R. Canagaratna, J. D. Allan, H. Coe, I. Ulbrich, M. R. Alfarra, A. Takami, A. M. Middlebrook, Y. L. Sun, et al. 2007. Ubiquity and dominance of oxygenated species in organic aerosols in anthropogenically-influenced Northern hemisphere midlatitudes. Geophys. Res. Lett. 34 (13):n/a–/a. doi:10.1029/2007GL029979.
- Zhang, Q., D. R. Worsnop, M. R. Canagaratna, and J. L. Jimenez. 2005b. Hydrocarbon-like and oxygenated organic aerosols in Pittsburgh: Insights into sources and processes of organic aerosols. Atmos. Chem. Phys. 5 (12):3289–311. doi:10.5194/acp-5-3289-2005.