
Abstract
Aerosol particles emitted from aircraft were measured in the vicinity of Kobe Airport (UKB), an offshore airport in Japan, in the spring (May) and fall (October–November) of 2021. The observation site was located at a distance of ∼290 and ∼110 m from the centerline of the runway and the taxiway, respectively. There were no significant non-aviation emission sources of aerosol particles around the site. This location enabled the unique identification of aircraft exhaust plumes transported from the runway and taxiway from specific aircraft under real-world operating conditions. Total and nonvolatile particle number concentrations in aircraft exhaust plumes were measured using condensation particle counters (CPCs) coupled with an evaporation tube heated at 350 °C. Most of the aircraft identified at UKB were Boeing 737–800 and Embraer 170–200 series equipped with CFM56-7B and CF34-8 engine variants, respectively. The particle number emission indices (EIs) attributed to the CFM56-7B engines were compared with those reported by previous studies (the total and nonvolatile particles for takeoff) and those archived in the International Civil Aviation Organization (ICAO) Aircraft Engine Emissions Databank (the nonvolatile particles for takeoff and idle). The median total and nonvolatile particle number EIs for takeoff showed good agreement (within a factor of 2) with those from the previous studies and ICAO Databank, whereas the nonvolatile particle number EIs for taxiing were much higher (more than an order of magnitude) than those estimated from the ICAO Databank. Possible factors affecting the similarity and difference in the particle number EIs are discussed.
EDITOR:
1. Introduction
The impacts of aircraft emissions on climate and human health have been recognized as an important issue (Masiol and Harrison Citation2014; Stacey Citation2019; ICAO Citation2022). Although civil aviation traffic in 2020 and 2021 was largely suppressed due to the novel coronavirus disease 2019 (COVID-19) pandemic, the global passenger market started gradually recovering in 2022 and is predicted to return to the 2019 levels in 2023–2027, depending on the global passenger forecast scenarios (ICAO Citation2022). Therefore, the environmental impacts of aircraft emissions will continue to be an important issue in the next decades.
The physical and chemical properties of ultrafine particles (UFPs; diameters of <100 nm) emitted from turbofan engines, which are widely used for commercial jet aircraft, are the key to understanding the environmental impacts of civil aviation. Particle number and mass emission indices (EIs) vary significantly with the engine type and operation mode. In the International Civil Aviation Organization (ICAO) Aircraft Engine Emissions Databank, the particle number and mass EIs for emission certification are categorized by the operation mode corresponding to the standard landing and takeoff (LTO) cycle, in which the engine thrust settings for takeoff, climb, approach, and idle are 100%, 85%, 30%, and 7%, respectively. The standard LTO cycle is an approximation of aircraft operations under 3000 feet for emission certification, and may not be representative of aircraft operations at airports. Nevertheless, a comparison of the particle number and mass EIs archived in the ICAO Databank with those inferred from ambient measurements would be important when using the archived EIs as input parameters for generating aviation emission inventories.
UFPs emitted from turbofan engines consist of nonvolatile (mainly soot) particles originating from combustion and volatile (mainly sulfur and organics) particles formed by nucleation and condensation during the expansion of plumes. Jonsdottir et al. (Citation2019) reported that nonvolatile particles emitted during ground-idle operations may be more toxic than those emitted during high-thrust conditions and can induce oxidative stress in bronchial cells. The characterization of UFPs with respect to the particle volatility and operation mode is therefore important in terms of air quality around airports.
Taxiing is a major part of ground operations, and the engine thrust setting for taxiing is assumed to be 7% for emission certification. The thrust levels during taxiing at actual airports may range from 4% to 9%, depending on various factors including the number of accelerations, decelerations, and turns (e.g., Nikoleris, Gupta, and Kistler Citation2011). The thrust levels may also depend on the aircraft type and engine design. For some types of turbofan engines, the nonvolatile particle number EIs at lower thrust settings (<10%) exhibited much larger variations than those at higher thrust settings (>80%) (Onasch et al. Citation2009; Timko et al. Citation2010; Lobo et al. Citation2015a; Durdina et al. Citation2017). The results from these previous studies suggest the need for investigating particle number EIs under real-world operating conditions, especially for taxiing.
Ambient sampling of aircraft exhaust plumes near runways can provide useful information for estimating particle number and mass EIs in realistic situations (Herndon et al. Citation2005, Citation2008; Lobo, Hagen, and Whitefield Citation2012, Lobo et al. Citation2015b; Mazaheri, Johnson, and Morawska Citation2009; Moore et al. Citation2017a; Takegawa et al. Citation2021). The type of plumes sampled at each measurement site may be limited to specific operation modes, depending on the location of the observation site. Furthermore, unique identification of the plumes might be somewhat ambiguous if there is a long distance from the emission sources to the observation site or a high frequency of aircraft passage. Only a limited number of studies have reported the total and nonvolatile particle number EIs from in-use commercial aircraft for different operation modes (Lobo, Hagen, and Whitefield Citation2012, Lobo et al. Citation2015b). Although the data reported by Lobo et al. provided useful insight into the emission characteristics, their measurements were conducted in 2004 and 2005. Considering the advances in jet engine technologies, updated observations for newer aircraft are desired.
Field observations of aerosol particles were conducted at an observation site located near the runway and taxiway of Kobe Airport (UKB), an offshore domestic airport in Japan, in the spring (May) and fall (October–November) of 2021. There were no significant non-aviation emission sources of aerosol particles around the site. This location enabled the unique identification of aircraft exhaust plumes from specific aircraft. The purpose of this study was to estimate the total and nonvolatile particle number EIs corresponding to takeoff and taxiing for selected aircraft under real-world operating conditions.
2. Methods
2.1. Ambient sampling
The measurement instruments used in the present study were the same as those used for the field measurements at Narita International Airport (NRT) in previous studies (Takegawa et al. Citation2021, Citation2023). An ultrafine condensation particle counter with a nominal particle diameter at which the detection efficiency becomes 50% (d50) of 2.5 nm (UCPC; Model 3776, TSI, Inc., Shoreview, MN, USA) and a condensation particle counter with d50 = 10 nm (CPC; Model 3771, TSI) were used for measuring the particle number concentrations (Takegawa and Sakurai Citation2011; Takegawa, Iida, and Sakurai Citation2017) and a carbon dioxide (CO2) monitor (Model LI-840, Li-Cor Biosciences, Lincoln, NE, USA) was used for measuring the mixing ratio of CO2. The UCPC and CPC data are referred to as N2.5 and N10, respectively. The sample flow for the UCPC and CPC was passed through an evaporation tube for heated sampling (350 °C) or through a bypass tube for unheated sampling via a three-way valve. The aerosol particles sampled by the UCPC and CPC at the unheated and 350 °C-heated modes are referred to as the total and nonvolatile particles, respectively. The three-way valve was basically fixed at either the unheated or heated position when sampling an aircraft exhaust plume. Exceptionally, the three-way valve was switched from the heated to unheated mode during the sampling of a specific plume. This exceptional operation was performed to measure both the total and nonvolatile particles for the same plume event.
Takegawa et al. (Citation2021, Citation2023) investigated the performance of the evaporation tube heated at 350 °C and found that it can efficiently remove 15-nm and 30-nm particles generated from pure tetracontane (n-C40H82), which is used as a reference material for evaluating volatile particle removers for certification of jet engines (Aerospace Recommended Practice 6320 issued by the Society of Automotive Engineers (SAE-ARP6320); SAE Citation2018). The evaporation tube can also efficiently remove 50-nm particles generated by nebulizing unused jet engine lubrication oil (Mobil Jet Oil II), which was shown to be the major source of the UFPs sampled at NRT (Fushimi et al. Citation2019). The particle number fraction remaining for the 30-nm tetracontane and 50-nm lubrication oil particles was <0.1% for both particles at 350 °C when using the CPC for measuring particle number concentrations downstream of the evaporation tube.
Furthermore, Takegawa et al. (Citation2021, Citation2023) investigated the penetration and detection efficiency of the nonvolatile particles through the evaporation tube and confirmed that it exceeded the minimum penetration efficiency of nonvolatile particles specified by the SAE-ARP6320 protocol. Potential artifacts due to the nucleation of gaseous compounds vaporized from particles in the evaporation tube were estimated to be negligible for the NRT dataset (Takegawa et al. Citation2021). The artifacts were likely negligible for the UKB datasets because the particle number concentration levels observed at UKB were generally lower than or comparable to those at NRT.
Ambient air was drawn into the container through a stainless-steel tube (ID: 10.7 mm; length: 2.8 m) and was split into a bypass flow connected to a piston pump and sample flows for aerosol and CO2 measurements. The total flow rate through the main tube (sum of the bypass and sample flows) was ∼22 L min−1. The aerosol sample flow was diluted using particle-free air regulated by a mass flow controller (2.0 L min−1 at 293 K) to extend the concentration range measured by the UCPC and CPC. The dilution factor (∼5) was determined from the sample flow rates of the UCPC and CPC and the dilution flow rate. Meteorological parameters (air temperature, relative humidity, wind speed, and wind direction) were measured at the observation site. Furthermore, a telephoto lens camera and video camera were used to monitor the aircraft passage and record the registration numbers of the individual aircraft. The integration times of the UCPC, CPC, and CO2 were 1 s and those of the meteorological parameters were 1 min.
shows the approximate layout of UKB and a photograph of the observation site. The observation site was located at a distance of ∼290 and ∼110 m from the centerline of the runway and the taxiway, respectively. The instruments were deployed in the container of a truck. The height of the sampling point was ∼3.3 m from the ground level. The electrical power (AC 100 V) was supplied from a hybrid vehicle (Prius, Toyota Motor Corp., Japan), which was placed at the opposite side of the runway and taxiway. The engine of the vehicle was turned off for most of the time during the measurements. Furthermore, the location of the vehicle was downwind of the truck when air parcels were transported from the runway. Therefore, the effects of vehicle emissions on the measurements were likely negligible.
Figure 1. Approximate layout of Kobe Airport (UKB) (bottom) and a photograph of the observation site viewed from the north (top). The observation site was located at a distance of ∼290 and ∼110 m from the centerline of the runway and the taxiway, respectively. The instruments were deployed in the container of a truck. The electrical power (AC 100 V) was supplied from a hybrid vehicle. The drawing of the layout was based on information provided by the Kobe City government and Google Earth Pro (last accessed: May 29, 2022).
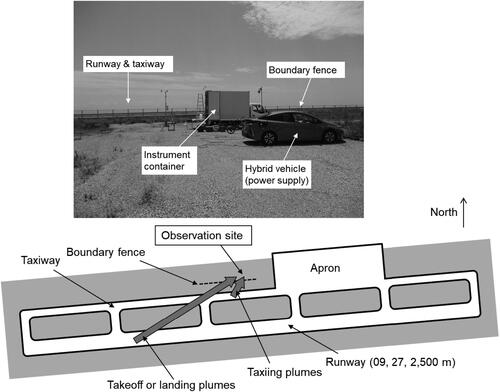
also illustrates some sampling patterns of the takeoff/landing and taxiing plumes at the observation site. For the west-to-east takeoff pattern, an aircraft first taxied in front of the observation site from the left to right-hand side and subsequently took off. Under southerly or southwesterly conditions, a distinct taxiing plume could be observed followed by a takeoff plume with a delay of a few minutes. The particle number concentration for the takeoff plume was generally lower than the taxiing plume because of the longer traverse distance. For the east-to-west landing pattern, an aircraft first touched down from the left-hand side and subsequently taxied in front of the observation site from the right- to left-hand side. Under southerly and southeasterly conditions, landing and taxiing plumes could be transported to the observation site nearly simultaneously. It is likely that the landing plumes were obscured by large enhancements of the particle number concentrations in the taxiing plumes. Although there might be other cases in which landing plumes were sampled separately from taxiing plumes for the west-to-east landing pattern under southerly or southeasterly conditions, these cases were not clearly identified. Therefore, this study focused on the characterization of takeoff and taxiing plumes.
2.2. Analysis methods
The identification of the operation modes in the LTO cycle for specific aircraft and the attribution of the operation modes to particle number concentration data were performed using the video camera recording and meteorological data. The arrival timing of a plume was estimated from the video camera recording and the wind speed and direction. In most cases, individual plumes were well separated because of the relatively sparse flight schedule at UKB. If the estimated arrival time coincided with the enhancement of N10 within 2-min prior and 2-min posterior to the time, it can be interpreted that unique identification of the plume was successfully achieved. The engine models were estimated based on the information available from the airline’s website and the aircraft registration database (see the Appendix).
For an identified plume, the background level was estimated by searching for the time at which N10 exhibited the minimum value within 2-min prior and 2-min posterior to the peak time of the plume (referred to as t1 and t2, respectively). The N10 data were used for determining the background levels because of the higher precision for N10 than N2.5 and CO2. The baseline was determined by using the estimated background values corresponding to t1 and t2, and the enhancements above the background for N10, ΔN10, were derived by subtracting the baseline. The enhancements above the background for N2.5 and CO2 (ΔN2.5 and ΔCO2, respectively) were derived using the above-defined t1 and t2. The average ΔN2.5/ΔCO2, ΔN10/ΔCO2, and ΔN10/ΔN2.5 ratios were calculated using an area integration method instead of the linear regression method. This approach is similar to that used by Moore et al. (Citation2017a). The 1 − ΔN10/ΔN2.5 values are referred to as the sub-10 nm fraction. The average ΔN2.5/ΔCO2 and ΔN10/ΔCO2 ratios in the unit of cm−3 ppmv−1 were converted to the particle number EIs in the unit of particles per kg of fuel (kg−1), which are referred to as EI(N2.5) and EI(N10), respectively, using the emission factor for CO2 (EICO2). Information on the hydrogen-to-carbon molar ratio for the fuel used at UKB was not available and was assumed to be 1.92 following Moore et al. (Citation2017a). The resultant EICO2 value was 3.16 × 10³ gCO2 kg−1.
The peak timing for N2.5 and N10 did not exactly match that for CO2, and the temporal variations of CO2 were slightly smoother than those of N2.5 and N10. These slight mismatches were due to the difference in the temporal response of the instruments, the difference in the residence time in the sampling tubes, and the uncertainties in the manual time adjustment at the beginning of each observation day. The recording time of the CO2 data was shifted by 1–3 s so that the timing of some distinct peaks of N2.5 and N10 coincided with that of CO2. The time shift had significant effects on the linear regression slopes of N2.5 and N10 versus CO2. The effects of the time shift on the area integration results were rather small, except for some cases when the peak ΔCO2 values were low (the uncertainties in the determination of the background levels of CO2 had a large effect). Only the plume data with a maximum ΔCO2 greater than or equal to 5 ppmv within the plume were used for estimating the particle number EIs. Possible uncertainties in the particle number EIs originate from the precision of the UCPC, CPC, and CO2 monitor, the penetration and detection efficiencies of aerosol particles through the sampling tubes and the evaporation tube, and the determination of the background levels of N2.5, N10, and CO2. The uncertainties due to the penetration and detection efficiencies of UFPs and the determination of the CO2 background levels significantly depend on the characteristics of particle number size distributions and CO2 in ambient air and are discussed in Section 4.1. The uncertainties due to the instrument precision (Takegawa et al. Citation2023) and those due to the determination of the background levels of N2.5 and N10 were relatively minor compared to those from the above two factors.
3. Results
3.1. Examples of takeoff and taxiing plumes
The ambient temperature for the local time analyzed in this study ranged from 18 °C to 26 °C during the spring period and from 18 °C to 23 °C during the fall period. Most of the aircraft identified at UKB were Boeing 737–800 (B738) and Embraer 170–200 (E175) series equipped with CFM56-7B and CF34-8 engine variants, respectively. A small number of Boeing 737–700 and Embraer 170–100 series were also identified (their engine models were also estimated to be CFM-56-7B and CF34-8, respectively). A substantial fraction of the flights listed in the nominal flight schedule were canceled because of the restrictions on movement due to COVID-19, and the frequency of plume samples was much lower than expected. Nevertheless, a total of 47 plumes were successfully identified from the spring and fall datasets. The number of plume samples that met the criterion of ΔCO2 ≥ 5 ppmv, which was used for estimating the EI values, was 19 and 15 for the total and nonvolatile particles, respectively. There were a few cases in which the automated identification procedure did not work properly mainly due to fluctuations of the CO2 background levels. Those cases were manually removed.
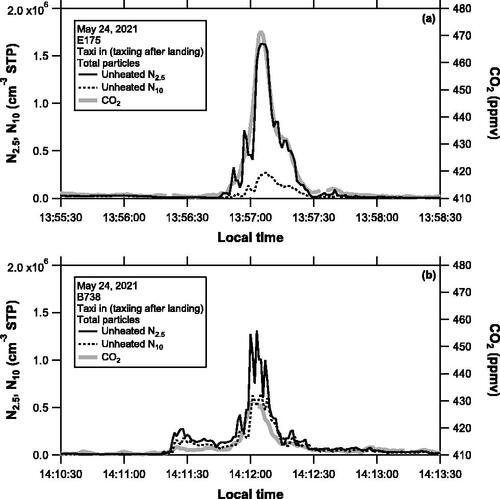
shows an example of the number concentration of the total particles in taxi-in plumes (taxiing after landing) for an E175 and B738 aircraft obtained on May 24, 2021. The estimated total particle number EIs in the taxiing mode for the E175 were EI(N2.5) = 4.3 × 10¹⁶ kg−1 and EI(N10) = 8.0 × 10¹⁵ kg−1, and those for the B738 were EI(N2.5) = 8.7 × 10¹⁶ kg−1 and EI(N10) = 5.8 × 10¹⁶ kg−1. The sub-10 nm number fraction was 0.82 for the former and 0.33 for the latter. These data illustrate the significant difference in particle number emissions for different types of aircraft. The EI(N10) for the B738 was higher by a factor of ∼7 compared to that for the E175, whereas the sub-10 nm fraction exhibited the opposite tendency.
Figure 2. Time series of the number concentration of the total particles and the mixing ratio of CO2 in taxi-in plumes (taxiing after landing) for (a) an E175 and (b) a B738 aircraft, obtained on May 24, 2021.
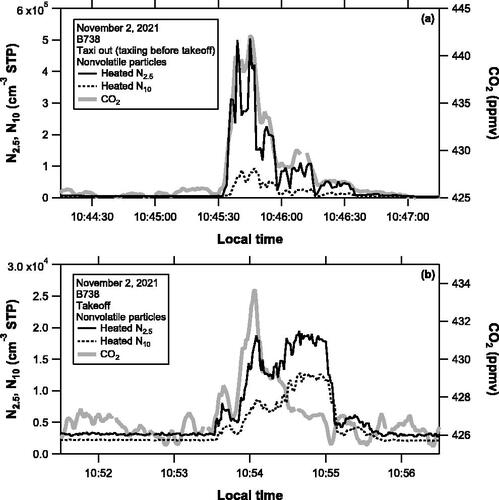
shows an example of the number concentration of the nonvolatile particles in taxi-out (taxiing before takeoff) and takeoff plumes for a B738 aircraft, obtained on November 2, 2021. These two plumes were emitted from the same aircraft. The estimated nonvolatile particle number EIs were EI(N2.5) = 4.4 × 10¹⁶ kg−1 and EI(N10) = 9.2 × 10¹⁵ kg−1 for the taxiing plume and EI(N2.5) = 5.6 × 10¹⁵ kg−1 and EI(N10) = 3.4 × 10¹⁵ kg−1for the takeoff plume. The sub-10 nm number fraction was 0.79 for the former and 0.39 for the latter. These data illustrate the significant difference in the nonvolatile particle number emissions for different engine thrust settings. The particle number EI and sub-10 nm number fraction for the taxiing plume were both higher than those for the takeoff plume. The ΔN2.5/ΔCO2 ratios for takeoff showed a significant temporal variation, i.e., they were rather small at the onset of the plume and tended to increase afterward. Moore et al. (Citation2017a) observed enhancements of nonvolatile particles relative to CO2 in the initial stage of the take-off plumes and attributed this to the burst of soot particles. They sampled aircraft exhaust plumes at a point ∼400 m downwind of the end point of a runway along the direction of the takeoff, making interpretation of the results more straightforward. The temporal variation in may have been affected by both the temporal changes in the engine emissions and the spatial variations of the plume caused by eddy diffusion, and the results should be interpreted with caution. Nevertheless, as proposed by Moore et al. (Citation2017a), these results suggest the importance of reporting the time series data in aircraft exhaust plumes.
Figure 3. Time series of the number concentration of the nonvolatile particles and the mixing ratio of CO2 in (a) taxi-out (taxiing before takeoff) and (b) takeoff plumes for a B738 aircraft, obtained on November 2, 2021.
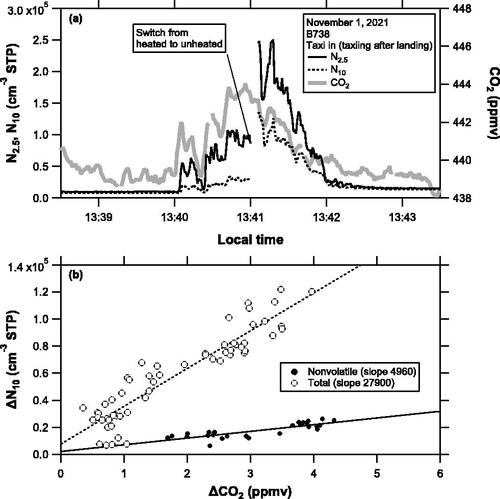
depicts the special sampling pattern for a taxiing plume from a B738 aircraft, obtained on November 1, 2021. The three-way valve for the UCPC and CPC inlet was switched from the heated to unheated mode at around the peak time of the taxiing plume (13:41 LT). The particle number EIs were not estimated in this case because the CO2 enhancements in the plume did not meet the criterion of ΔCO2 ≥ 5 ppmv. Instead, the linear regression slope was separately calculated (). The linear regression slope for the total N10 was larger by a factor of ∼5.6 compared to that for the nonvolatile N10. The difference in the regression slopes for N2.5 was smaller (a factor of ∼3.4), reflecting larger sub-10 nm particle number fractions for the nonvolatile particles compared to those for the total particles in this case.
Figure 4. (a) Time series of the number concentration of particles and the mixing ratio of CO2 in a taxiing plume from a B738 aircraft, obtained on November 1, 2021. The three-way valve for the UCPC and CPC inlet was switched from the heated to unheated mode at around the peak time of the taxiing plume (13:41 LT). (b) Scatterplots of the total and nonvolatile ΔN10 versus ΔCO2 for the corresponding time periods in (a). The time periods were selected rather arbitrarily (13:40:03–13:41:00 for the nonvolatile particles and 13:41:06–13:42:14 for the total particles). The linear regression slope values are indicated in the legend.
3.2. Particle number emission indices
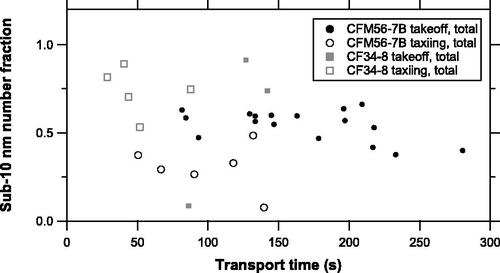
The sub-10 nm particle number fraction may depend not only on the engine characteristics but also on the residence time of the plumes in the atmosphere due to the loss of UFPs by coagulation scavenging and Brownian diffusion. shows the sub-10 nm fraction of the total particles as a function of the transport time from the runway or taxiway to the observation site. The transport time was estimated from the wind speed and direction. The sub-10 nm particle number fractions did not exhibit systematic decreases with time, which is similar to the feature found at NRT (Takegawa et al. Citation2021). Although the number of identified plumes for the total particles (31 plumes in ) is rather limited, the residence time of the plumes would not be a major factor affecting the sub-10 nm particle number fraction at least for the time scale considered in the present study.
Figure 5. Sub-10 nm number fraction for the total particles as a function of the transport time from the runway or taxiway.
and summarize the particle number EIs and sub-10 nm particle number fractions for the total and nonvolatile particles, along with the particle number EIs cited from Takegawa et al. (Citation2021), Moore et al. (Citation2017a, Citation2017b), and the ICAO Aircraft Engine Emissions Databank (Citation2021). The EIs from Moore et al. (Citation2017a, Citation2017b) and the ICAO Databank include all thrust ratings of the CFM56-7B and CF34-8 engines. The rated engine thrusts for the ICAO Databank ranged from 91.6 to 121.4 kN for the CFM56-7B and from 55.2 to 64.5 kN for the CF34-8. The sample number for the particle number EIs was smaller than that for the sub-10 nm fraction because of the criterion of ΔCO2 ≥ 5 ppmv for the former. The engine model for the B738 at NRT was estimated to be CFM56-7B. The dataset reported by Moore et al. (Citation2017a, Citation2017b) was obtained at Los Angeles International Airport (LAX) using a CPC (d50 = 4 nm, Model 3775, TSI) for unheated sampling and another CPC (d50 = 7 nm, Model 3022 A, TSI) for 350 °C-heated sampling. The ICAO Databank includes direct measurements of engine exhaust nonvolatile particles with diameters larger than 10 nm classified by each LTO-cycle mode (takeoff, climb out, approach, and idle) performed at engine test facilities. The ICAO data cited here represent those corrected for sampling system losses. The median and 25th–75th percentile range of the particle number EIs were calculated for the data categories having a sample number (n) of ≥5. The EI data obtained at LAX were used as a reference for both the EI(N2.5) and EI(N10) data obtained at UKB considering that the d50 values of the CPCs used at LAX were in between those of the UCPC and CPC used in the present study.
Figure 6. Particle number emission indices (EIs) for (a) N2.5 and (b) N10 obtained at UKB and those cited from previous literature. The data were categorized by the engine model, operation mode (takeoff and taxiing), and particle volatility (total: unheated mode; nonvolatile (nv): heated mode). The data points from the literature were shifted upward or downward for clarity of the presentation. The open circles and the red horizontal bars overlapping the circles represent the particle number EIs and their 25th–75th percentile range, respectively, obtained at UKB. The shaded squares represent the total particle number EIs for B738 obtained at NRT. The median value is plotted instead of the 25th–75th percentile range for the NRT data due to the narrow range. The green bars below the open circles represent the 25th–75th percentile range of the particle number EIs obtained at LAX. The blue bars represent the 25th–75th percentile range of the particle number EIs archived in the ICAO Aircraft Engine Emissions Databank. (c) Sub-10 nm particle number fraction obtained at UKB.
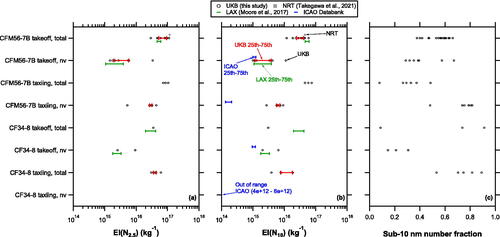
Table 1. Comparison of particle number emission indices (EIs). The unit of the particle number EIs is 1015 particles per kg of fuel.
A quantitative interpretation of the UKB dataset is made only for the CFM56-7B engines due to the limited number of samples for the CF34-8 engines. The total and nonvolatile particle number EIs for takeoff operations from the UKB dataset exhibited reasonably good agreement with those from the NRT and LAX datasets. The particle number EIs from the LAX dataset (d50 = 4 and 7 nm for the total and nonvolatile particles, respectively) were approximately between the EI(N2.5) and EI(N10) values from the UKB dataset, consistent with the difference in the detectable size ranges. The nonvolatile particle number EIs for takeoff from the UKB (d50 = 10 nm) and LAX (d50 = 7 nm) datasets tended to be larger than those from the ICAO Aircraft Engine Emissions Databank (d50 = 10 nm), but the difference was not significant (within a factor of ∼2 for a median-based comparison). By contrast, the nonvolatile particle number EIs for taxiing from the UKB dataset were considerably larger (more than an order of magnitude) than those expected from the ICAO Databank.
4. Discussion
4.1. Uncertainties
Takegawa et al. (Citation2021) discussed possible underestimation of the particle number EIs from the NRT data considering the penetration and detection efficiencies through the sampling tubes and the evaporation tube. They assumed the geometric mean diameter and geometric standard deviation of the particle number size distributions that could explain the observed sub-10 nm particle number fraction. The median sub-10 nm particle number fraction for the NRT data was 0.63 (0.53–0.70) for the total particles and 0.54 (0.44–0.72) for the nonvolatile particles, where the values in parentheses represent the 25th–75th percentile range. They suggested that the “true” particle number EIs for the total and nonvolatile particles might be larger by a factor of ∼1.5 and ∼1.7, respectively, compared to the corresponding EI(N2.5) values due to the significant decrease in the penetration and detection efficiencies in the sub-10 nm size range.
For the UKB data, the penetration and detection efficiencies through the sampling tubes and the evaporation tube estimated for the measurements at NRT could be applied because the length of the sampling tubes and the flow rates used at UKB were approximately the same as those used at NRT. The median sub-10 nm particle number fraction was 0.56 (0.41–0.63) for the total particles and 0.53 (0.33–0.75) for the nonvolatile particles. Considering the similarity in the sub-10 nm particle number fraction between the UKB and NRT data, it would be reasonable to assume that the degree of underestimation of the particle number EIs by the EI(N2.5) values derived from the UKB data was comparable to that from the NRT data. Regarding the particle number EIs for particle diameters of >10 nm (corresponding to the particle size range for the ICAO Databank), the underestimation of the particle number EIs by the EI(N10) values would not be as significant as the above-mentioned values (a factor of ∼1.5 and ∼1.7) because of the higher penetration and detection efficiencies through the sampling tubes and the evaporation tube.
An additional source of the uncertainties in the particle number EIs originates from the determination of the CO2 background levels. Although the location of the observation site was relatively isolated from urban pollutions, CO2 might have been more affected by remote non-aviation sources as compared to UFPs. The CO2 background levels tend to be positively biased if fluctuations of CO2 due to non-aviation sources are superimposed on the “true” background levels. An overestimation of the CO2 background levels would lead to the overestimation of the particle number EIs. Potential overestimation of the EIs associated with the determination of the CO2 background levels was evaluated by manually decreasing the CO2 background by 1 ppmv (approximately corresponding to the fluctuations of the CO2 baselines; see and ). The overestimation of the particle number EIs depended on the average ΔCO2 values (i.e., smaller ΔCO2 led to larger effects) and ranged from 4 to 39%. Consequently, the potential underestimation or overestimation in the particle number EIs for the UKB data was significant but unlikely to have exceeded a factor of 2 on average.
4.2. Discrepancy between the UKB and ICAO datasets
The comparison in and shows that the EI(N10) values for the nonvolatile particles for taxiing obtained at UKB were considerably higher (more than an order of magnitude) than those expected from the ICAO Databank. The discrepancy between the UKB data and the ICAO Databank would become even larger if the effects of the penetration and detection efficiencies were considered (Section 4.1). The effects of the CO2 background determination would mitigate the discrepancy between the UKB data and the ICAO Databank (Section 4.1) but not sufficiently to fill the gap.
A possible explanation for the large discrepancy between the UKB and ICAO datasets is that the taxiing operations at UKB might not be represented by the engine thrust setting of 7% used in the ICAO standard LTO cycle. Lobo et al. (Citation2015a) and Durdina et al. (Citation2017) reported that the nonvolatile particle number EIs from CFM56-7B engines exhibited large increases (more than an order of magnitude) when the engine thrust setting was decreased from 7% (the ICAO standard) to ∼3–4% (the minimum thrust for idle), whereas they did not exhibit large variations at higher thrust settings (>80%). This tendency could qualitatively explain the reasonable agreement for the takeoff plumes and the large discrepancy for the taxiing plumes. Other possible explanations include the variability in engine age, difference in fuel composition, and difference in ambient temperature between the UKB and ICAO datasets. The effects of engine age and fuel composition were not evaluated because of the lack of information. The UKB data were obtained at ambient temperatures of 18–26 °C, whereas the CFM56-7B emissions for the ICAO Databank were obtained at ambient temperatures of 22–39 °C. The ambient temperature for the UKB data was slightly lower than that for the ICAO Databank, which would not be a major factor. Considering the potential health impacts of nonvolatile particles emitted during ground-idle operations (Jonsdottir et al. Citation2019), further investigation of nonvolatile particles in aircraft taxiing plumes under real-world operating conditions is needed to fill the gap between field observations and direct engine measurements.
An additional implication from the UKB dataset can be inferred from the comparison of the total particle number EIs between takeoff and taxiing. Although the sample number of the total particles for taxiing is rather limited, it is suggested that the total particle number EIs for taxiing were comparable to those for takeoff. For some types of jet engines, the total particle number EIs exhibited a relatively weak dependency on the engine thrust levels from lower (a few percent) to higher (nearly 100%) values (Onasch et al. Citation2009; Timko et al. Citation2010). The volatile particles generally make larger contributions to the total particle number emissions as compared to the nonvolatile particles (e.g., Onasch et al. Citation2009; Timko et al. Citation2010; Moore et al. Citation2017a; Takegawa et al. Citation2021). Detailed information on the sources of the volatile particles, including the sulfur content of the fuels and the type of jet engine lubrication oil, is needed to investigate the mechanisms of the comparable levels of the total particle number EIs between takeoff and taxiing.
5. Conclusions
The total and nonvolatile particle emissions for takeoff and taxiing under real-world operating conditions were investigated using the field measurement data obtained at UKB. The particle number EIs for CFM56-7B engines (Boeing 737–700 or 800 series) were quantitatively compared with those reported by previous studies. The median total particle number EIs for d50 = 2.5 and 10 nm emitted during takeoff were estimated to be 8.3 × 10¹⁶ kg−1 and 3.6 × 10¹⁶ kg−1, respectively. They are consistent with the results obtained at NRT (d50 = 2.5 and 10 nm) and LAX (d50 = 4 nm) considering the detectable size ranges of the CPCs used for the measurements. The median nonvolatile particle number EIs for d50 = 2.5 and 10 nm emitted during takeoff were estimated to be 2.7 × 10¹⁵ kg−1 and 1.3 × 10¹⁵ kg−1, respectively, and were consistent with those obtained at NRT (d50 = 2.5 and 10 nm) and LAX (d50 = 7 nm).
The nonvolatile particle number EIs for takeoff from the UKB (d50 = 10 nm) and LAX (d50 = 7 nm) datasets tended to be larger than those from the ICAO Aircraft Engine Emissions Databank (d50 = 10 nm), but the difference was not very large (within a factor of ∼2 for a median-based comparison). By contrast, the nonvolatile particle number EIs for taxiing from the UKB dataset were considerably larger (more than an order of magnitude) than those expected from the ICAO Databank. It is suggested that the nonvolatile particle number EIs for taxiing under real-world operating conditions might not be represented by the engine thrust setting of 7% used for the ICAO standard LTO cycle. Further investigation of nonvolatile particles in aircraft taxiing plumes at in-use airports is needed to fill the gap between field observations and direct engine measurements.
Acknowledgments
The author thanks the Kobe City Government and Kobe Airport for their cooperation with the field measurements. The author thanks K. Misawa at Tokyo Metropolitan University, A. Fushimi at the National Institute for Environmental Studies, H. Sakurai at the National Institute of Advanced Industrial Science and Technology, and K. Saitoh at the Environmental Science Analysis and Research Laboratory for useful discussion and comments. The author also thanks K. Kondo and other staff members at Murata Keisokuki Service Co., Ltd., Japan and Y. Higuchi at Tokyo Metropolitan University for their support during the field measurements and data reduction.
Disclosure statement
No potential conflict of interest was reported by the author.
Data availability statement
The data are available upon request to the author.
Additional information
Funding
References
- Durdina, L., B. T. Brem, A. Setyan, F. Siegerist, T. Rindlisbacher, and J. Wang. 2017. Assessment of particle pollution from jetliners: from smoke visibility to nanoparticle counting. Environ. Sci. Technol. 51 (6):3534–41. doi: 10.1021/acs.est.6b05801.
- Fushimi, A., K. Saitoh, Y. Fujitani, and N. Takegawa. 2019. Identification of jet lubrication oil as a major component of aircraft exhaust nanoparticles. Atmos. Chem. Phys. 19 (9):6389–99. doi: 10.5194/acp-19-6389-2019.
- Herndon, S. C., J. T. Jayne, P. Lobo, T. B. Onasch, G. Fleming, D. E. Hagen, P. D. Whitefield, and R. C. Miake-Lye. 2008. Commercial aircraft engine emissions characterization of in-use aircraft at Hartsfield-Jackson Atlanta International Airport. Environ. Sci. Technol. 42 (6):1877–83. doi: 10.1021/es072029+.
- Herndon, S. C., T. B. Onasch, B. P. Frank, L. C. Marr, J. T. Jayne, M. R. Canagaratna, J. Grygas, T. Lanni, B. E. Anderson, D. Worsnop, et al. 2005. Particulate Emissions from in-use Commercial Aircraft. Aerosol Sci. Technol. 39 (8):799–809. doi: 10.1080/02786820500247363.
- ICAO Aircraft Engine Emissions Databank. 2021. https://www.easa.europa.eu/en/domains/environment/icao-aircraft-engine-emissions-databank (issue 28C; accessed 16 September 2022).
- ICAO (International Civil Aviation Organization). 2022. Environmental report. https://www.icao.int/environmental-protection/Pages/envrep2022.aspx
- Jonsdottir, H. R., M. Delaval, Z. Leni, A. Keller, B. T. Brem, F. Siegerist, D. Schönenberger, L. Durdina, M. Elser, H. Burtscher, et al. 2019. Non-volatile particle emissions from aircraft turbine engines at ground-idle induce oxidative stress in bronchial cells. Commun. Biol. 2 (1):90. doi: 10.1038/s42003-019-0332-7.
- Lobo, P., D. E. Hagen, and P. D. Whitefield. 2012. Measurement and analysis of aircraft engine PM emissions downwind of an active runway at the Oakland International Airport. Atmos. Environ. 61:114–23. doi: 10.1016/j.atmosenv.2012.07.028.
- Lobo, P., L. Durdina, G. J. Smallwood, T. Rindlisbacher, F. Siegerist, E. A. Black, Z. Yu, A. A. Mensah, D. E. Hagen, R. C. Miake-Lye, et al. 2015a. Measurement of aircraft engine non-volatile PM emissions: Results of the aviation-particle regulatory instrumentation demonstration experiment (A-PRIDE) 4 campaign. Aerosol Sci. Technol. 49 (7):472–84. doi: 10.1080/02786826.2015.1047012.
- Lobo, P., D. E. Hagen, P. D. Whitefield, and D. Raper. 2015b. PM emissions measurements of in-service commercial aircraft engines during the Delta-Atlanta Hartsfield Study. Atmos. Environ. 104:237–45. doi: 10.1016/j.atmosenv.2015.01.020.
- Masiol, M., and R. M. Harrison. 2014. Aircraft engine exhaust emissions and other airport-related contributions to ambient air pollution: A review. Atmos Environ (1994) 95:409–55. doi: 10.1016/j.atmosenv.2014.05.070.
- Mazaheri, M., G. R. Johnson, and L. Morawska. 2009. Particle and gaseous emissions from commercial aircraft at each stage of the landing and takeoff cycle. Environ. Sci. Technol. 43 (2):441–6. doi: 10.1021/es8013985.
- Moore, R. H., M. A. Shook, L. D. Ziemba, J. P. DiGangi, E. L. Winstead, B. Rauch, T. Jurkat, K. L. Thornhill, E. C. Crosbie, C. Robinson, et al. 2017a. Take-off engine particle emission indices for in-service aircraft at Los Angeles International Airport. Sci. Data. 4:170198. doi: 10.1038/sdata.2017.198.
- Moore, R. H., M. A. Shook, L. D. Ziemba, J. P. DiGangi, E. L. Winstead, B. Rauch, T. Jurkat, K. L. Thornhill, E. C. Crosbie, C. Robinson, et al. 2017b. Data from: Take-off engine particle emission indices for in-service aircraft at Los Angeles International Airport, Dryad, Dataset. doi: 10.5061/dryad.q5qm1.
- Nikoleris, T., G. Gupta, and M. Kistler. 2011. Detailed estimation of fuel consumption and emissions during aircraft taxi operations at Dallas/Fort Worth International Airport. Transp. Res. 16 (4):302–8. doi: 10.1016/j.trd.2011.01.007.
- Onasch, T. B., J. T. Jayne, S. Herndon, D. R. Worsnop, R. C. Miake-Lye, I. P. Mortimer, and B. E. Anderson. 2009. Chemical properties of aircraft engine particulate exhaust emissions. J. Propul. Power 25 (5):1121–37. doi: 10.2514/1.36371.
- SAE (Society of Automotive Engineers). 2018. Procedure for the continuous sampling and measurement of non-volatile particulate matter emissions from aircraft turbine engines: - Aerospace recommended practice 6320. https://saemobilus.sae.org/content/ARP6320/#scope.
- Stacey, B. 2019. Measurement of ultrafine particles at airports: A review. Atmos. Environ. 198:463–77. doi: 10.1016/j.atmosenv.2018.10.041.
- Takegawa, N., A. Nagasaki, A. Fushimi, Y. Fujitani, Y. Murashima, and H. Sakurai. 2023. Volatility of aircraft exhaust ultrafine particles inferred from field measurements at Narita International Airport. Atmos. Environ. 292:119391. doi: 10.1016/j.atmosenv.2022.119391.
- Takegawa, N., and H. Sakurai. 2011. Laboratory evaluation of a TSI condensation particle counter (Model 3771) under airborne measurement conditions. Aerosol Sci. Technol. 45 (2):272–83. doi: 10.1080/02786826.2010.532839.
- Takegawa, N., K. Iida, and H. Sakurai. 2017. Modification and laboratory evaluation of a TSI ultrafine condensation particle counter (Model 3776) for airborne measurements. Aerosol Sci. Technol. 51 (2):235–45. doi: 10.1080/02786826.2016.1261990.
- Takegawa, N., Y. Murashima, A. Fushimi, K. Misawa, Y. Fujitani, K. Saitoh, and H. Sakurai. 2021. Characteristics of sub-10 nm particle emissions from in-use commercial aircraft observed at Narita International Airport. Atmos. Chem. Phys. 21 (2):1085–104. doi: 10.5194/acp-21-1085-2021.
- Timko, M. T., T. B. Onasch, M. J. Northway, J. T. Jayne, M. R. Canagaratna, S. C. Herndon, E. C. Wood, R. C. Miake-Lye, and W. B. Knighton. 2010. Gas turbine engine emissions: Part II: Chemical properties of particulate matter. J. Eng. Gas Turbines Power 132:061505. doi: 10.1115/1.4000132.
APPENDIX.
Aircraft information
The registration numbers of the individual aircraft were recorded using a telephoto lens camera at UKB. Details of the engine models with respect to the registration numbers are not officially open to the public by the Japanese government. They were estimated based on the information available from the airline’s website and the aircraft registration database, as listed in .
Table A1. Sources of the aircraft registration information.