
Abstract
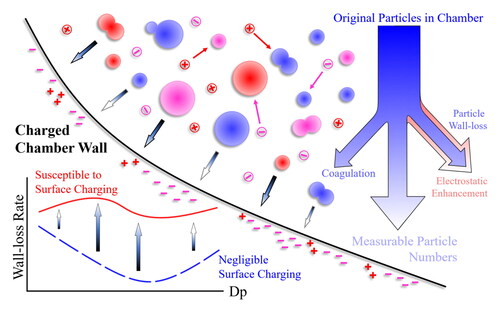
Particle size dependent wall-loss rates vary widely between Teflon environmental chambers. For instance, the UCR/CE-CERT dual-90 m3 collapsible Teflon chambers (UCR collapsible chamber) measured particle wall-loss rates are relatively insensitive to particle size, while other chambers (e.g., Caltech, GaTech, UC Davis) exhibit a strong dependence of wall loss rates on particle size. Particle wall loss rates in the larger UCR collapsible chambers exceed those reported for some smaller volume chambers. The size-dependent particle wall-loss patterns in the absence of coagulation within the UCR collapsible chambers were experimentally characterized in this work using a monodisperse particle injection method. Electrostatic charges on chamber surfaces were found to dominate the particle deposition in the UCR collapsible chamber. Charged particles ∼50 nm in diameter decay much faster than charged 200 nm particles, but the overall decay enhancement by electrostatics was determined to be smaller for 50 nm particles due to kinetic charging limitations. Particles in the chamber, regardless of initial charge state, approached a chamber-specific charge steady-state, where the charge steady-state for smaller particles was driven by preferential loss of charged particles while the charge steady-state for larger particles was driven by bidirectional diffusion charging. Coagulation was found to be significant when high particle number loadings are present (e.g., 5 × 104 cm−3). Mitigation strategies are needed for environmental chambers susceptible to surface charging (e.g., UCR collapsible chambers) in order to lower the influence from electrostatics. The shape of the particle wall-loss pattern can be used to identify chambers driven by significant electrostatic particle wall-loss.
Graphical Abstract
EDITOR:
1. Introduction
Chamber/flow tube studies, field measurements and modeling works provide different but unique perspectives to understand the atmospheric processes during which secondary organic aerosol (SOA) can be generated. Experiments in environmental chambers simulate the SOA generation processes in a controlled environment in absence of atmospheric transport processes (e.g., Carter et al. Citation2005; Cocker, Flagan, and Seinfeld Citation2001). One goal of environmental chamber studies is to quantify the SOA generation potential (the SOA yield) from target precursor(s) given a limited but specific set of atmospheric conditions. Environmental chambers have surfaces serving as the sink where particulate matter produced within them can deposit onto. However, the atmosphere does not have the same boundaries that environmental chambers do. Once generated particles are lost to the chamber wall during the course of an experiment, they can no longer be detected and particle wall-loss correction must be accounted for to accurately report aerosol yield. It is still under discussion whether or not particles on the wall are able to continue growing during experiments (Trump et al. Citation2016; Hildebrandt, Donahue, and Pandis Citation2009), while more evidence tends to favor that such growth could be negligible (Bilsback et al. Citation2023). Even without considering such an effect, the loss of particles itself leads to significant underestimation on measured aerosol yields unless accounted for appropriately. Thus, understanding particle wall-loss mechanisms and conducting reasonable correction are critical to minimize these uncertainties (McMurry and Grosjean Citation1985).
Previous studies have concluded that convection, Brownian diffusion, gravitational sedimentation and electrostatic effect are the major driving forces of the particle wall-loss processes. Their theoretical estimation and early chamber verifications have shown that convection is a function of chamber design; Brownian diffusion can be significant on sub-100 nm particle sizes; gravitational sedimentation can be significant on >500 nm particles and the electrostatic charges on chamber surfaces and particles have case-specific enhancements on all particle sizes (Van Dingenen, Raes, and Vanmarcke Citation1989; McMurry and Rader Citation1985; Crump, Flagan, and Seinfeld Citation1982; Crump and Seinfeld Citation1981). The total measurable number particle loss (referred to in this work as measured particle loss) is the sum of particle wall-loss and particle-particle coagulation (loss of number but not suspended mass), which simultaneously occurs during chamber experiments (Cocker, Flagan, and Seinfeld Citation2001). Similar to the theoretical estimation, many laboratory studies have recently reported chamber-specific size-dependent particle wall-loss patterns with or without theory-based evaluations on coagulation, noting that the scale of the decay rate difference between two measurable sizes could reach one order of magnitude or more (Shao et al. Citation2022; Vansevenant et al. Citation2021; Charan et al. Citation2018; Sunol, Charan, and Seinfeld Citation2018; Wang et al. Citation2018; Nah et al. Citation2017; Leskinen et al. Citation2015; Loza et al. Citation2012; Pierce et al. Citation2008).
The concept of the electrostatic effect on particle wall-loss processes was first reported in 1980s and has recently regained attention due to the development of modeling and detection techniques (Charan et al. Citation2018, Charan, Huang, and Seinfeld Citation2019; Pierce et al. Citation2008; Van Dingenen, Raes, and Vanmarcke Citation1989; McMurry and Rader Citation1985; Crump and Seinfeld Citation1981). When particles are charged, their wall-loss rates become higher, but the enhancement is still a function of particle size (Charan, Huang, and Seinfeld Citation2019; McMurry and Rader Citation1985; Saucy, Kamens, and Linton Citation1983). Exposure of suspended particles to a charged medium (such as suspended ions charged by cosmic radiation) is ubiquitous. When particles interact with the charged medium, charge transfer may occur (Mahfouz and Donahue Citation2020; Wagner et al. Citation2017; Kirkby et al. Citation2016; Franchin et al. Citation2015). Theoretical calculation has indicated that larger particles have much higher charging probabilities than do smaller particles under a constant ion field, but the actual charge rate is still affected by the particle concentration (Marlow and Brock Citation1975). The particle-charge interaction asymmetry between positive- and negative-polarity due to their different ion mobilities has been reported for different types of particles (Simones et al. Citation2011; Hoppel and Frick Citation1986; Marlow and Brock Citation1975), but such asymmetry was neglected in particle wall-loss charge study for simplicity (McMurry and Rader Citation1985).
Recent discussions have shown that the electrostatic effect could be either significant or negligible depending on the specific situation of each chamber. The reported averaged particle decay rate in UCR 90-m3 collapsible chambers, 7 day−1 (Carter et al. Citation2005), exceeded the reported values from other smaller chambers, e.g., Caltech 28-m3 dual chambers in early 2000s, 2 ∼ 4 day−1 (Cocker, Flagan, and Seinfeld Citation2001); Caltech new 19-m3 chamber, 0.5 ∼ 2 day−1 (Charan et al. Citation2018). Considering the driving forces behind particle wall-loss, this suggests that particle wall-loss behaviors in UCR collapsible chambers were somehow enhanced by charged chamber walls, despite their larger volume. On the other hand, it was reported that such an effect could be ignored in the new 19-m3 Caltech chamber when care has been taken not to introduce static charge to the chamber surfaces (Charan et al. Citation2018). In situations where the electrostatic played a role, the significance of its effect was found to fluctuate as the experiment proceeded since the particle charge distribution in the chamber also evolved with experimental time (Mahfouz and Donahue Citation2020). Although charge-shifted particle wall-loss curves were theoretically calculated and experimentally evaluated in previous works (Mahfouz and Donahue Citation2020; Wang et al. Citation2018; Pierce et al. Citation2008; McMurry and Rader Citation1985), a direct observation of how decay of charged particles behave among the total particles was still needed to further understand the particle size dependence of electrostatics effect on a charged chamber and to constrain the uncertainties for future particle wall-loss corrections. Overall, the wall-loss behaviors are not only affected by the charge distribution tendencies of particles themselves, but also by such tendencies from the air surrounding the particles and the chamber walls (McMurry and Rader Citation1985; Cooper, Langer, and Rosinski Citation1979).
It has been generally acknowledged that other than electrostatic charge, factors such as chamber geometry, turbulence, reaction speed and other potential ones can also affect particle loss behaviors in each chamber, thus case-specific particle loss characterizations must be developed for each environmental chamber (Wang et al. Citation2018; Nah et al. Citation2017; Pierce et al. Citation2008). It has been reported that the particle-wall deposition rates in Caltech chamber did not vary significantly as a function of chamber volume change during experiments (Loza et al. Citation2012) and such rates were not affected by humidity when the electrostatic effect was insignificant (Charan et al. Citation2018). Particle coagulation, which could deeply affect the wall-loss correction based on particle number concentration (Cocker, Flagan, and Seinfeld Citation2001), especially for the small particle size range (<150 nm), has been recently simulated using a dynamic model, which accounted for coagulation as a function of experimental time (Nah et al. Citation2017). The calculation of particle coagulation in chamber experiments have also been discussed (Charan, Huang, and Seinfeld Citation2019; Pierce et al. Citation2008). At the same time, more characterization is needed as a function of temperature, chamber relative volume (the chamber surface-area-to-volume ratio, A/V) and other potential candidates, in order to provide a more comprehensive understanding regarding the particle wall-loss.
In this study, a monodisperse particle injection approach was used to characterize the size-dependent particle wall-loss patterns under the electrostatic effect in the absence of coagulation within the UCR dual-90 m³ collapsible chambers. Such experimental methods provided controlled size of particles while limiting the particle number concentration under 500 cm−3, which was sufficiently low to be assumed “coagulation-free” for the measurement time-scale. Particle wall loss experiments with different coagulation intensities using higher number concentration polydisperse particle number loadings were also conducted. The current experimental dataset follows the same trend shown for coagulation effects observed by Nah et al. (Citation2017) and Wang et al. (Citation2018). In addition, the unique design of a modified dual-SMPS system helped characterize the fate and transport of the charged particles within our chamber.
2. Experimental
2.1. Environmental chambers
The dual 90-m3 collapsible chambers at CE-CERT, UC Riverside were characterized in this study. Their collapsible design and the other characteristics have been discussed elsewhere (Carter et al. Citation2005). It is noted here that the chambers were equipped with internal mixing ducts to ensure fast mixing after injection of the seed particles or precursors finished. The chamber enclosure room was equipped with a dual air handler system, which drew in air and forced the air through a false ceiling with perforated reflective aluminum sheets to ensure the well-mixing of the enclosure air. The top metal frames of the chambers were slowly lowered down to maintain the differential pressure inside the chamber at ∼5 Pa during experiments as the chamber volume decreased due to sampling, leak, etc. (Carter et al. Citation2005). When each experiment concluded after the chambers became “collapsed,” researchers came to the vicinity of the chambers to tidy up the edges of the chamber surface hanging on the ground. After repeated cleaning with inflation and deflation at least six times and ensuring that the background particle number concentration was below a threshold (normally 5 cm−3), the chambers were then inflated and their top frames automatically rose based on chamber’s real-time differential pressure. Experiments () were conducted at room temperature (∼21 °C) and ultra-low relative humidity (<0.1%) unless otherwise specified. Ammonium Sulfate (Sigma-Aldrich, 99%) was nebulized to generate mono- and poly-dispersed seed particles.
Table 1. List of experiments used in this study.
2.2. Experimental design
2.2.1. Particle atomization and polydisperse particle wall-loss experiments
Dry ammonium sulfate seed aerosol was generated from a 0.1 M solution using a constant-rate atomizer (Liu and Lee Citation1975), followed by a heating tunnel, a drying column and a 210Po neutralizer (10.0 mCi). For polydisperse particle wall-loss experiments, atomized ammonium sulfate particles were then injected directly into the chambers. Particles after going through the 210Po neutralizer were assumed to be at Fuchs’ charge equilibrium regardless of their charge status prior to the entrance of the neutralizer. Previous studies have shown that preexisting charges from particle generation processes do not affect their final charge distribution after going through the neutralizer, thus the output particle charge distribution was reasonably assumed to be at equilibrium (He and Dhaniyala Citation2014; Biskos, Reavell, and Collings Citation2005; Adachi, Kousaka, and Okuyama Citation1985).
2.2.2. Monodisperse experiments
A portable high-flow differential mobility analyzer (DMA) system, described by Xu and Collins (Citation2021), was used to classify atomized ammonium sulfate polydisperse particles (Section 2.2.1) prior to injection into the environmental chambers. The dry ammonium sulfate particles were neutralized by a soft x-ray neutralizer (PhotoIonBar L12535, Hamamatsu Photonics) before entering the high-flow DMA column. The monodisperse particles were classified and further dried through a Nafion tubing (Perma Pure). The sheath flow rate was set to 36 Lpm. Since the DMA column only transmits a very narrow particle size range, most of the particles produced from the atomizer were removed resulting in low number concentration of the monodisperse particles (up to 500 cm−3) suspended in the chamber. The effect of coagulation on particle decay in monodisperse experiments is assumed to be negligible at these low number concentrations.
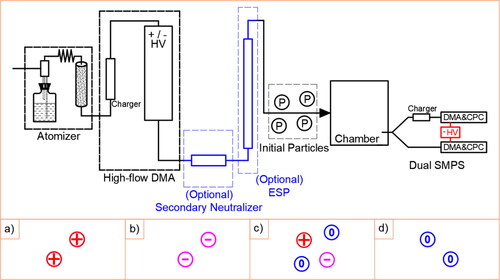
Different experimental settings ( and S1) were applied in order to inject particles under different charging status: (a) positively charged particles were injected to the chamber by applying a negative high-voltage (HV) (CPS 2591 N-24V-10KV REV-A) to the high-flow DMA column; (b) negatively charged particles were injected to the chamber by applying a positive HV supply (BERTAN 602 C-150P) to the high-flow DMA column; (c) neutralized particles (assumed at charge equilibrium) were generated by applying a secondary 210Po neutralizer before the particles were injected to the chamber; (d) uncharged (neutral) particles were selected by applying a custom electrostatic precipitator (5000 V) right after the secondary neutralizer.
Figure 1. Schematic diagrams of the experimental set-up options. Initial particles could be prepared as: (a) all positively charged, (b) all negatively charged, (c) at charge equilibrium (neutralized), (d) no particle charges (neutral).
2.3. Particle measurement and SMPS data collection
Similar to the measurement set-up studying ambient particle charge distribution (Buckley, Wright, and Henshaw Citation2008), particle samples were measured from the UCR dual collapsible chambers using a custom dual-SMPS system. Both of the DMA columns are equipped with a negative HV supply (BERTAN 602 C-100N) and therefore only select positively charged particles. One of the custom SMPS was set up conventionally, equipped with an 85Kr neutralizer before the entrance of the DMA column (referred to in this work as SMPS with charger) so that particle charge equilibrium was achieved prior to entering the DMA column. Therefore, the SMPS with charger measured total particle concentrations after applying the standard SMPS inversion algorithm (Collins, Flagan, and Seinfeld Citation2002). The other custom SMPS (referred to in this work as SMPS without charger) had no neutralizer equipped; particle samples entered the DMA column with the same charge distribution as present in the chamber. Therefore, the SMPS without charger only detected the positively-charged particles from the environmental chamber.
The data acquired from the SMPS without charger needs correction when quantitative comparison is needed. It is assumed in this work that the sample particle stream reaches the Fuchs’ particle charging equilibrium with Wiedensohler approximation (Wiedensohler Citation1988; Fuchs Citation1963) after passing through the 85Kr neutralizer and before entering the DMA column for the SMPS with charger system. The built-in signal-to-data inversion program of UCR custom SMPS systems treats the incoming signal assuming that the particles were at Fuchs’ particle charge equilibrium regardless of the actual (non-equilibrium) fraction of positively-charged particles present. shows the simplified Fuchs’ particle charging distribution for two particle sizes of interest. Regardless of the complicated inversion calculations during the SMPS signal-to-data processes, the “+1-to-total” ratio that the calculation applied over a specific size is constant. For the scope of this study, those ratios were directly applied as a simple but sufficient correction to the data output of the SMPS without charger when a rough number concentration of positively-charged particles is needed (for example, for the SMPS without charger, if the “measured” particle number after data inversion reads 100 cm−3 for particles with a single mode at 200 nm, the “+1-to-total” ratio, 19.42%, would be applied to correct the result to 19.42 cm−3).
Table 2. Single-size particle charge distribution at Fuchs’ charge equilibrium.
2.4. Particle wall-loss rate calculation
Time-averaged, size-independent particle wall-loss rates are calculated for experiments in UCR dual collapsible chambers. The details have also been described in previous studies (Carter et al. Citation2005; Cocker, Flagan, and Seinfeld Citation2001). A first-order particle decay constant was calculated by fitting the SMPS-measured total particle number decay for the analyzed experiment. Within this study, since there is no new-particle formation after the seed particle injection period, the wall-loss fitting time range starts from one hour after the SMPS detecting the maximum particle number concentrations, assuming the internal-chamber mixing ends.
3. Result and discussion
3.1. Experimental indication of electrostatic effect in UCR collapsible chambers
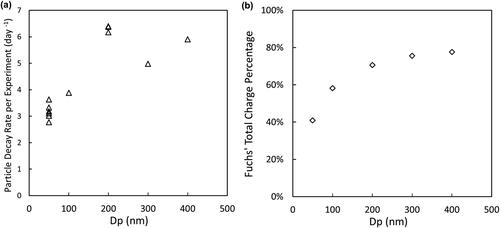
Measurements of particle wall-loss behaviors of select particle sizes (50, 100, 200, 300, and 400 nm electrical mobility diameter) in neutralized charging state were obtained from monodisperse particle experiments. As mentioned in Section 2, wall-loss rates are negligibly impacted by particle coagulation for these experiments (referred to in this work as coagulation-free wall-loss). The general trend of coagulation-free particle wall-loss rates for select particle sizes is shown (). Each dot () represents the decay rate for the select particle size during the course of an experiment. Variation in particle decay rate for similar sized particles was small between repeat experiments conducted on different days. Crump and Seinfeld (Citation1981) explored the basic size-dependent particle wall-loss patterns in chambers assumed to be affected by only Brownian motion and gravitational settling and observed that the decay rate decreases with particle size until the size reaches 300 ∼ 400 nm at which point the decay increases as particle size further increases. McMurry and Rader (Citation1985) subsequently suggested that the observed trend would be altered with increased electrostatic effect. The current size-dependent coagulation-free wall-loss rates observed (), when compared to the previous cited work, suggests that electrostatic effects may be much more important than Brownian motion and Gravitational forces within the common particle size range (50 ∼ 400 nm) in UCR collapsible chambers. Additionally, it was observed that size-dependent particle wall-loss rates in the UCR collapsible chamber follow a similar trend to the particle size-dependent total Fuchs’ charging probability (). Both observations suggest that the electrostatic effect in the UCR collapsible chamber might overpower the other two main driving forces for particle wall deposition. However, since the decay rates at different sizes only varied by two-fold (3 ∼ 6 day−1), further experimental work was performed to elucidate the extent of electrostatic effect.
Figure 2. (a) Averaged monodisperse particle decay rates as a function of size in UCR collapsible chambers and (b) Fuchs’ total charge percentage as a function of particle size.
Particle wall-loss behavior in the UCR collapsible chamber was further observed directly using our dual-SMPS measurement technique. The dual-SMPS set-up () was applied to a bimodal particle wall-loss experiment where low concentrations (up to 500 cm−3) of two narrowly selected sizes (50 and 200 nm) of particles were injected in series and co-existed in the chamber. The blue curves represent normalized total number concentrations versus time while the red curves represent normalized only positively charged particles present in the chamber. Enhanced electrostatic particle wall-loss was directly observed as the positively charged 50 nm and 200 nm particles decayed faster than total particles. Further, even though a larger decay rate due to Brownian motion is expected for 50 nm particles than 200 nm particles, the observed total number decay rate of the 200 nm particles exceeds that of the 50 nm particles. This suggests a higher enhancement of the decay rate of 200 nm particles than 50 nm particles due to electrostatic effects. The decay rate difference between charged and total particles is more significant for 50 nm particles than for 200 nm particles due to the higher electrical mobility of the former; however, total 200 nm particles still have the higher decay rate than total 50 nm particles (, blue curves), probably due to the kinetically limited charging rates for 50 nm particles. The fraction of charged particles seemed to be under the processes of both being replenished and being preferentially lost to the wall during the course of the experiment, thus it is probably the limited replenishing rate of charged 50 nm particles that constrains their overall decay enhancement by the electrostatic effect. Investigation on particles approaching a charge steady-state during experiments is further discussed in Section 3.2.
Figure 3. Dual-SMPS measurements on monodisperse particle wall-loss at two typical sizes, (a) 50 nm and (b) 200 nm during a characterization experiment. The blue curves represent normalized total particle number concentrations, measured by SMPS with charger; the red curves represent normalized positively-charged particle number concentrations, measured by SMPS without charger; (c) 50 nm total particle decay rates in four quartiles from the five selected characterization experiments.
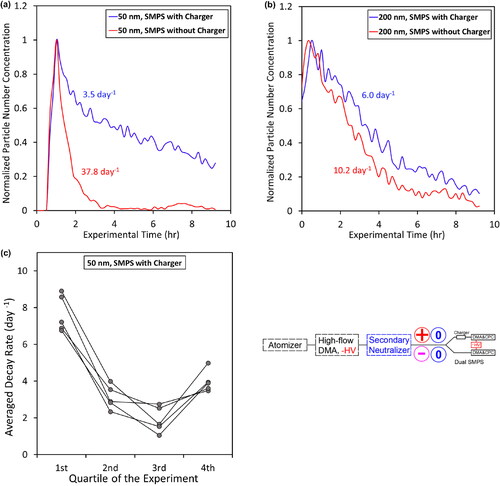
The significance of the electrostatic effect on total particle decay rate was further illustrated by investigating the contribution of the decay of charged particles to the total particle decay as a function of time (). Wall-loss experimental time was divided into four quartiles with first-order decay rates calculated for each time period. The decay rates for 50 nm particles during the first quartile of the experiments clearly exceeded the decay rates during the later quartiles, consistent with the preferential loss of charged particles in early periods. Additionally, although the observation that the particle wall-loss rate decreases with time is in agreement with the prediction of McMurry and Rader (Citation1985) under electrostatic-driven conditions, it is also noted that the decay rates increase during the fourth periods from our observation. We attribute this increase to changes in surface-area-to-volume ratio during collapse of the chamber, which is an additional effect unique to the UCR large collapsible chambers (the volume reduction can reach the order of 5-fold).
3.2. Direct measurement of dis-/re- charging behaviors
Mahfouz and Donahue (Citation2020) demonstrated that particles within a chamber during an experiment are dynamically reaching a chamber-specific charge steady-state, driven by both preferential loss of charged particles and bidirectional diffusion charging. It is also experimentally observed in this work by another three particle loss experiments where 50 nm and 200 nm size selected particles were introduced into the chamber as either all positively charged, all negatively charged, or all neutral particles. Since particles are selected based on their electrical mobility, 50 nm selected particles may include multiple charged larger diameter particles with a mobility equivalent to a single charged 50 nm particle. Therefore, for this section, the use of the term “50 nm particles” refers to the net amount of single charged 50 nm particles plus a lesser number of larger multiple charged particles that were injected with equivalent mobility to the 50 nm single charged particle (same for the term “200 nm particles”). Particles from the three experiments were observed to undergo bidirectional diffusion charging along with different observed wall loss behaviors using the dual SMPS (). The SMPS without charger (red/pink curves) only detects positively charged particles that were suspended in the chamber while measurements using the SMPS with charger (blue/teal curves) include particles that were positively, negatively, or neutrally charged when suspended in the chamber. Therefore, the difference between the blue/teal curve and the red/pink curve at any given time represents the sum of neutral and negatively charged particles suspended in the environmental chamber.
Figure 4. Dual-SMPS measurements on monodisperse particle wall-loss at two typical mobility sizes, 50 and 200 nm, during three typical types of characterization experiments. (a) Neutral-only, (b) positively-charged only and (c) negatively charged only particles were injected to the chamber, respectively. The blue/teal curves were measured by SMPS with charger while the red/pink curves were measured by SMPS without charger, detecting only the positively charged particles suspended in the chamber. The red/pink curves in (a1), (a2), (c1) and (c2) are visually scaled up by 4 times on the right-hand side y-axis.
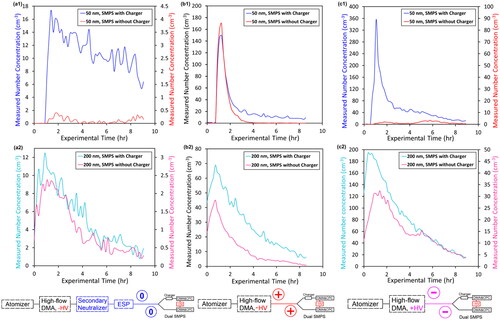
3.2.1. Neutral particle injection experiment
The observed data from the neutral particle injection experiment ( and ) indicates particle diffusion charging process, possibly driven by the interaction of initially neutral particles with surrounding charged gas ions induced by cosmic radiation (Wagner et al. Citation2017; Kirkby et al. Citation2016; Franchin et al. Citation2015). Originally neutral particles became charged and the positively charged particles were then detected (SMPS without charger, red/pink curve). Positively charged 50 nm particles are barely present (red curve, ), caused by both the much-faster decay rate of presented charged particles and their lower theoretical charging probabilities (Marlow and Brock Citation1975).
3.2.2. Positive particle injection experiment
The particle discharge behavior was directly observed ( and ) in addition to the preferential loss of charged particles, because particles other than positively charged were detected (indicated by the difference between blue/teal curve and red/pink curve), while all the injected particles were initially positively charged. This is possibly driven by the interaction of initially-charged particles with surrounding neutral or oppositely-charged gas ions (Wagner et al. Citation2017; Kirkby et al. Citation2016; Franchin et al. Citation2015). The observed discharge rate of initially positively charged 200 nm particles is much faster than the discharge rate of initially positively charged 50 nm particles as the pink curve (200 nm particles, ) diverges from the teal curve even before the completion of particle injection into the chamber, while the red curve (50 nm particles, ) coincides with the blue curve for about 1 h after the injection.
3.2.3. Negative particle injection experiment
Similar discharge behavior was observed when only negatively charged particles were injected ( and ). The measurement result suggests that a portion of initially negatively charged particles were dis-charged to neutral and then re-charged to positive as the SMPS without the charger can only detect particles that were positively charged in the chamber. The measurement of a greater fraction of 200 nm positively charged particles () than for 50 nm particles () is consistent with smaller 50 nm initially negatively charged particles both decaying to the walls faster and charge equilibrating slower than the 200 nm initially negatively charged particles.
Coupled with observations from Section 3.1, the particle wall loss trend in is reasonably explained: in early periods of the experiments, the total particle wall-loss rates are driven by the preferential loss of initially charged particles. Next, in the later time periods, the total decay rates are kinetically limited by the rate of particle charging. Finally, the uptick in wall loss is due to the collapsing of volume of the UCR system increasing surface area to volume ratio.
To summarize: (1) the electrostatic effect dominates losses of particles due to Brownian motion (even at the smallest measured sizes) in the UCR collapsible chamber; (2) 50 nm charged particles decay much faster than 200 nm charged particles; (3) the overall decay enhancement by the electrostatic effect on 50 nm particles is smaller than on 200 nm particles, due to the kinetic particle charging limitation at the former size; and (4) particles in the chamber tend toward chamber-specific charge steady-state by preferential loss of charged particles and bidirectional diffusion charging, where the former dominates the smaller (50 nm) particles and the latter dominates larger (200 nm) particles.
3.3. Coagulation effect
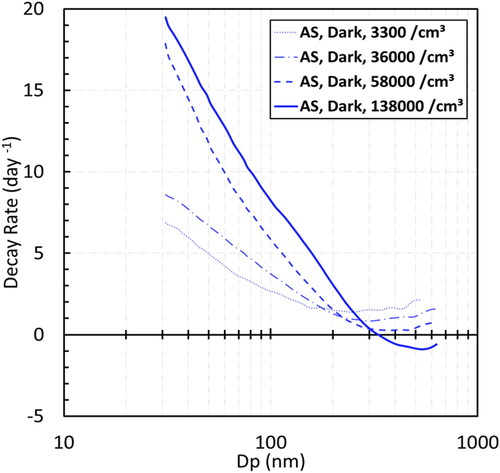
Nah et al. (Citation2017) provided model simulations of experiments with particle coagulation processes leading to particle number loss, thus here we introduce the term “measured particle loss” as the combination of particle wall-loss and coagulation loss. Their simulations show that smaller particles collide to form larger particles during coagulation resulting in losses of smaller particles while the overall particle number is somewhat compensated by the formation of larger particles. The effect of coagulation on experimentally determined size-dependent particle wall-loss is observed () when polydisperse aerosol is injected into the chamber. A clear increase in measured size-dependent particle wall-loss for higher concentration polydisperse aerosol injection experiments versus much lower concentration monodisperse particles is observed for diameters less than 200 nm due to coagulation loss of the smallest diameter particles in our dual-90 m3 chambers. An additional series of increasing number concentration polydisperse particle wall-loss experiments were conducted in the UCR 37.5-m³ MEZ chamber (), where the chamber setup has been described in detail in Nakao et al. (Citation2011). As expected, the measured size-dependent decay rates for particles under 200 nm increased with particle number concentration. As coagulation rate increased with particle number loading, the measured particle loss rates for smaller particles increased while the measured particle loss rates lowered for larger particles. The formation of larger particles due to coagulation could be sufficient to overpower their wall deposition, suggested by the negative measured particle loss rates for diameters greater than ∼320 nm (solid blue curve, ). In short, coagulation in polydisperse seed wall-loss experiments, especially at higher concentrations (e.g., 5 × 104 cm−3), can measurably impact the measured particle loss rates, thus the low-loading monodisperse characterization experiments are recommended to reduce coagulation impacts. Alternatively, computational corrections accounting for coagulation are encouraged when conducting particle loss corrections in environmental chambers using polydisperse aerosols (Charan, Huang, and Seinfeld Citation2019; Sunol, Charan, and Seinfeld Citation2018; Wang et al. Citation2018; Nah et al. Citation2017).
Figure 5. Comparison of the averaged size-dependent measured particle loss pattern obtained from polydisperse experiments (black curve) and the averaged size-dependent coagulation-free particle wall-loss pattern obtained from monodisperse experiments (blue curve) in UCR 90-m³ collapsible chambers.
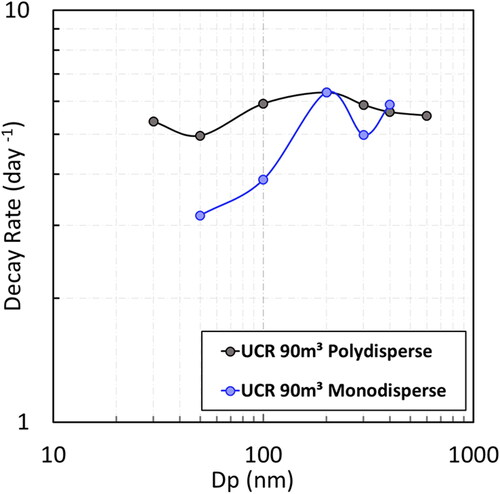
Figure 6. Averaged size-dependent measured particle loss patterns from experiments designed with increased particle number loadings (in units of cm−3) in UCR 37.5-m³ chamber.
3.4. Inter-comparison within the chamber community and implication
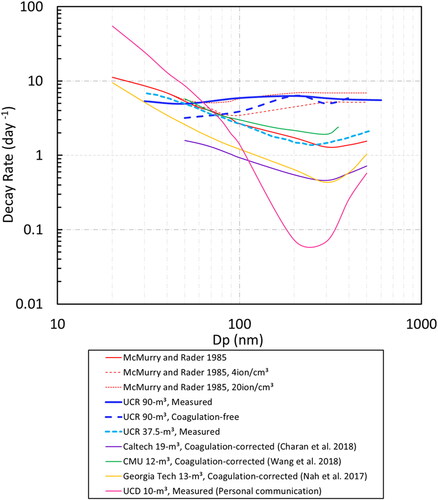
An inter-comparison of size-dependent particle wall-loss patterns in Teflon chambers was performed using both recent literatures and/or personal communications (). The size-dependent particle wall-loss rates are distributed across two orders of magnitude between different environmental chambers, implying that particle wall-loss patterns vary widely between chamber designs. These variations include differences in design/environment parameters such as physical shape, surface area/volume ratio (in static or dynamic), surface charging sources, etc., as well as their own operational schemes such as convection conditions, RH surrounding the chamber, electrostatic disruption during chamber operation (e.g., walking near chamber), rubbing between multiple reactors and/or between the surface of the reactor and its enclosure, etc. The effect of different chamber sizes was previously claimed to be insignificant (McMurry and Rader Citation1985) since their curves originated from a 250-Liter Teflon chamber and were then validated by their 60-m³ chamber. However, understanding that particle wall-loss pattern is affected by a combination of factors, sometimes a single factor is less significant for one experimental chamber but not in another. McMurry and Rader (Citation1985) also determined that the size-dependent wall-loss rate should intuitively look like a “spoon” (the solid red curve, ) if not affected by electrostatics, and this rule can be applied to roughly estimate the importance of electrostatic particle loss in a chamber, thus providing guidance for future chamber design modifications. Most of the size dependent wall loss curves from other chamber facilities listed in have the “spoon” indicator, suggesting that electrostatics are not dominating their particle wall losses. Charan et al. (Citation2018) specifically concluded that the electrostatic effect in the Caltech new 19-m³ chamber could be neglected. Curves for UCR collapsible chambers seem to be remarkably elevated from a “spoon” baseline and consistent with the elevated charge state curves from McMurry and Rader (Citation1985), indicating the existence of electrostatic loss in the UCR collapsible 90-m3 chambers despite its large size. The UCR collapsible chambers have the following designs that may enhance the role of electrostatic wall-loss: (1) the chamber enclosure air surrounding the chambers was constantly purged and extremely dry (RH < 0.1%), (2) the chamber was collapsible leading to rubbing of the wall material; (3) the chamber walls were constantly rubbing against each other in the dual-chamber design due to the external mixing system (air handlers) during experiments, and (4) the chamber walls were in direct contact with the reflective (and conductive) aluminum enclosure that it resides in. The UCR 37.5-m³ MEZ chamber is a single chamber, with little contact with grounded conducting surfaces and without dry-air external purge – observations for particle size dependent wall loss in the MEZ chamber are consistent with the “spoon” indicator, suggesting that the electrostatic loss is not the preferential route in this chamber. The discussed chamber design and the “spoon” indicator both provide insights for other environmental chambers to evaluate whether or not their chambers are subject to electrostatic-enhanced particle wall-loss. Teflon chamber researchers should be aware of potential particle wall-loss enhancing events due to elevated chamber surface charges, especially when the chamber particle wall-loss correction relies on measurement results from a calibration experiment from previous days. Potential scenarios include but are not limited to: (1) alteration/maintenance of a chamber, (2) chamber surfaces recently contacted by hands or gloves, (3) tours/inspections on a chamber where people walk around the chamber enclosure frequently, and (4) relocation of a chamber, such as field deployment. It is recommended to collect dedicated particle wall-loss patterns more frequently to account for any potential electrostatic-enhancement events. To reduce correction uncertainties due to electrostatic-enhanced particle wall-loss processes, mitigation strategies are also needed for environmental chambers susceptible to surface charging (e.g., the UCR collapsible chambers). For example, Caltech’s chamber reduces its potential electrostatic effect by not contacting conducting surfaces and by restricting access to the chamber enclosure during experimental operations (Charan et al. Citation2018). Alternatively, external neutralization of chamber surfaces prior to an experiment (e.g., Soft X-ray PhotoIonizers, Hamamatsu Photonics) is also possible. A new-generation fixed-volume 120-m3 chamber has been installed in UCR in replace of the dual collapsible chambers with regards to such mitigation, and the details and characterizations of particle wall-loss will be discussed in future works.
Figure 7. Inter-comparison of averaged size-dependent particle number loss patterns among different chamber facilities or calculations. “Measured” represents measured particle loss (including particle wall-loss and coagulation); “Coagulation-corrected” represents particle wall-loss rates that are post-corrected with theoretical coagulation rates; and “Coagulation-free” represents particle wall-loss rates obtained from monodisperse particle injection experiments in this study, where coagulation is negligible due to their low particle number loadings.
The measured particle loss pattern and the coagulation-free particle wall-loss pattern collected in this work have furthered our understanding of the particle decay behavior affected by electrostatics and coagulation in UCR dual collapsible chambers. It is noted that the measured decay rates in UCR collapsible chambers are not as sensitive to particle size as other chambers, consistent with the size independent wall-loss correction method that has been used for this chamber (Nah et al. Citation2017; Carter et al. Citation2005). Additionally, it is noted that the measured particle loss in UCR collapsible chambers can change during and between experiments, due to the unique particle coagulation and charging dynamics as a function of experimental conditions. Monodisperse particle wall-loss characterization experiments are recommended to obtain coagulation-free wall-loss pattern; however, it should be noted that the standard polystyrene latex spheres (PSL standards) are not recommended, since impurities within PSL standards can also introduce many additional small particles into the chamber and potentially impact the result due to coagulation processes. In other cases where monodisperse characterization is not practical, coagulation must be correctly accounted for when calculating particle wall-loss rates from polydisperse measurements. Regardless, based on measurements in this work (Section 3.3) and modeling works from recent studies (Charan, Huang, and Seinfeld Citation2019; Nah et al. Citation2017; Pierce et al. Citation2008), coagulation still needs to be corrected when larger particle numbers are present, by either experimental or computational approaches. To further constrain such uncertainties and increase the particle wall-loss correction accuracy, a coagulation-corrected, time-resolved particle wall-loss correction method is warranted for chambers susceptible to surface charging and for collapsible chambers.
4. Conclusions
A monodisperse particle injection and a dual-SMPS measurement approach were used to characterize the size-dependent particle wall-loss patterns under the electrostatic effect in the absence of coagulation within the UCR dual-90 m³ collapsible chambers. The collected data shows that the enhancement of particle wall-loss rate by electrostatic effect is the dominant loss mechanism and that larger particles (in a typical chamber experiment) are more influenced, resulting in particle decay rates in UCR collapsible chambers relatively insensitive to particle size. Smaller charged particles were found to have higher decay rates, but also have more significant kinetic charging limitations than larger charged particles. Particles in the chamber, regardless of initial charge distribution, tend to approach a specific charge steady-state during the course of an experiment. Smaller particles approach the charge steady-state via mainly preferential loss of charged particles, while larger particles are mainly driven by bidirectional diffusion charging rates. By inter-comparing the particle wall-loss patterns within the chamber community, we conclude here that the “spoon-shaped” size-dependent particle wall-loss patterns can be used to roughly identify the significance of the electrostatic effect, and that such patterns are also dependent on the chamber geometric designs and operating maneuver. Observations obtained from UCR collapsible chamber designs and operations provide insights for other chamber users to identify potential electrostatic impact or potential electrostatic enhancement events for their chambers. Mitigation strategies are recommended and the alternative options are provided for a chamber susceptible to surface charging in order to lower down the uncertainty in particle wall-loss correction and improve the accuracy of measured SOA yields. Additionally, the coagulation effect was observed to be significant enough to impact particle wall-loss in experiments that have increased particle number loadings, especially for <200 nm particles. Therefore, efforts to correctly account for coagulation loss is recommended, either by computationally/theoretically calculating or experimentally minimizing the coagulation.
Supplemental Material
Download MS Word (11.1 MB)Acknowledgments
We would like to thank Dr. Don Collins for his generosity in providing the high-flow DMA system to make the monodisperse particle wall-loss experiments realistic for the 90-m³ chamber. We also would like to thank Tran Nguyen from UC Davis and John Seinfeld Group from Caltech for personal communications regarding particle wall loss in their respective chambers.
Disclosure statement
No potential conflict of interest was reported by the author(s).
Additional information
Funding
References
- Adachi, M., Y. Kousaka, and K. Okuyama. 1985. Unipolar and bipolar diffusion charging of ultrafine aerosol particles. J. Aerosol Sci. 16 (2):109–23. doi: 10.1016/0021-8502(85)90079-5.
- Bilsback, K. R., Y. He, C. D. Cappa, R. Y. W. Chang, B. Croft, R. V. Martin, N. L. Ng, J. H. Seinfeld, J. R. Pierce, and S. H. Jathar. 2023. Vapors are lost to walls, not to particles on the wall: artifact-corrected parameters from chamber experiments and implications for global secondary organic aerosol. Environ. Sci. Technol. 57 (1):53–63. doi: 10.1021/acs.est.2c03967.
- Biskos, G., K. Reavell, and N. Collings. 2005. Unipolar diffusion charging of aerosol particles in the transition regime. J. Aerosol Sci 36 (2):247–65. doi: 10.1016/j.jaerosci.2004.09.002.
- Buckley, A. J., M. D. Wright, and D. L. Henshaw. 2008. A technique for rapid estimation of the charge distribution of submicron aerosols under atmospheric conditions. Aerosol Sci. Technol 42 (12):1042–51. doi: 10.1080/02786820802400645.
- Carter, W. P. L., D. R. Cocker, D. R. Fitz, I. L. Malkina, K. Bumiller, C. G. Sauer, J. T. Pisano, C. Bufalino, and C. Song. 2005. A new environmental chamber for evaluation of gas-phase chemical mechanisms and secondary aerosol formation. Atmos. Environ 39 (40):7768–88. doi: 10.1016/j.atmosenv.2005.08.040.
- Charan, S. M., Y. Huang, and J. H. Seinfeld. 2019. Computational simulation of secondary organic aerosol formation in laboratory chambers. Chem. Rev. 119 (23):11912–44. doi: 10.1021/acs.chemrev.9b00358.
- Charan, S. M., W. Kong, R. C. Flagan, and J. H. Seinfeld. 2018. Effect of particle charge on aerosol dynamics in Teflon environmental chambers. Aerosol Sci. Technol 52 (8):854–71. doi: 10.1080/02786826.2018.1474167.
- Cocker, D. R., R. C. Flagan, and J. H. Seinfeld. 2001. State-of-the-art chamber facility for studying atmospheric aerosol chemistry. Environ. Sci. Technol. 35 (12):2594–601. doi: 10.1021/es0019169.
- Collins, D. R., R. C. Flagan, and J. H. Seinfeld. 2002. Improved inversion of scanning DMA data. Aerosol Sci. Technol. 36 (1):1–9. doi: 10.1080/027868202753339032.
- Cooper, G., G. Langer, and J. Rosinski. 1979. Submicron Aerosol Losses in Aluminized Mylar Bags. J. Appl. Meteor. 18 (1):57–68. doi: 10.1175/1520-0450(1979)018<0057:SALIAM>2.0.CO;2.
- Crump, J. G., R. C. Flagan, and J. H. Seinfeld. 1982. Particle wall loss rates in vessels. Aerosol Sci. Technol. 2 (3):303–9. doi: 10.1080/02786828308958636.
- Crump, J. G., and J. H. Seinfeld. 1981. Turbulent deposition and gravitational sedimentation of an aerosol in a vessel of arbitrary shape. J. Aerosol Sci. 12 (5):405–15. doi: 10.1016/0021-8502(81)90036-7.
- Franchin, A., S. Ehrhart, J. Leppä, T. Nieminen, S. Gagné, S. Schobesberger, D. Wimmer, J. Duplissy, F. Riccobono, E. M. Dunne, et al. 2015. Experimental investigation of ion-ion recombination under atmospheric conditions. Atmos. Chem. Phys. 15 (13):7203–16. doi: 10.5194/acp-15-7203-2015.
- Fuchs, N. A. 1963. On the stationary charge distribution on aerosol particles in a bipolar ionic atmosphere. Geofis. Pura e Appl 56 (1):185–93. doi: 10.1007/BF01993343.
- He, M., and S. Dhaniyala. 2014. Experimental characterization of flowrate-dependent bipolar diffusion charging efficiencies of sub-50nm particles. J. Aerosol Sci 76:175–87. doi: 10.1016/j.jaerosci.2014.06.009.
- Hildebrandt, L., N. M. Donahue, and S. N. Pandis. 2009. High formation of secondary organic aerosol from the photo-oxidation of toluene. Atmos. Chem. Phys. 9 (9):2973–86. doi: 10.5194/acp-9-2973-2009.
- Hoppel, W. A., and G. M. Frick. 1986. Ion—aerosol attachment coefficients and the steady-state charge distribution on aerosols in a bipolar ion environment. Aerosol Sci. Technol. 5 (1):1–21. doi: 10.1080/02786828608959073.
- Kirkby, J., J. Duplissy, K. Sengupta, C. Frege, H. Gordon, C. Williamson, M. Heinritzi, M. Simon, C. Yan, J. Almeida, et al. 2016. Ion-induced nucleation of pure biogenic particles. Nature 533 (7604):521–6. doi: 10.1038/nature17953.
- Leskinen, A., P. Yli-Pirilä, K. Kuuspalo, O. Sippula, P. Jalava, M. R. Hirvonen, J. Jokiniemi, A. Virtanen, M. Komppula, and K. E. J. Lehtinen. 2015. Characterization and testing of a new environmental chamber. Atmos. Meas. Tech. 8 (6):2267–78. doi: 10.5194/amt-8-2267-2015.
- Liu, B. Y., and K. W. Lee. 1975. An aerosol generator of high stability. Am. Ind. Hyg. Assoc. J. 36 (12):861–5. doi: 10.1080/0002889758507357.
- Loza, C. L., P. S. Chhabra, L. D. Yee, J. S. Craven, R. C. Flagan, and J. H. Seinfeld. 2012. Chemical aging of m-xylene secondary organic aerosol: Laboratory chamber study. Atmos. Chem. Phys. 12 (1):151–67. doi: 10.5194/acp-12-151-2012.
- Mahfouz, N. G. A., and N. M. Donahue. 2020. Primary ion diffusion charging and particle wall loss in smog chamber experiments. Aerosol Sci. Technol. 54 (9):1058–69. doi: 10.1080/02786826.2020.1757032.
- Marlow, W. H., and J. R. Brock. 1975. Calculations of bipolar charging of aerosols. J. Colloid Interface Sci. 51 (1):23–31. doi: 10.1016/0021-9797(75)90078-8.
- McMurry, P. H., and D. Grosjean. 1985. Gas and aerosol wall losses in teflon film smog chambers. Environ. Sci. Technol. 19 (12):1176–82. doi: 10.1021/es00142a006.
- McMurry, P. H., and D. J. Rader. 1985. Aerosol wall losses in electrically charged chambers. Aerosol Sci. Technol 4 (3):249–68. doi: 10.1080/02786828508959054.
- Nah, T., R. C. McVay, J. R. Pierce, J. H. Seinfeld, and N. L. Ng. 2017. Constraining uncertainties in particle-wall deposition correction during SOA formation in chamber experiments. Atmos. Chem. Phys. 17 (3):2297–310. doi: 10.5194/acp-17-2297-2017.
- Nakao, S., M. Shrivastava, A. Nguyen, H. Jung, and D. Cocker. 2011. Interpretation of secondary organic aerosol formation from diesel exhaust photooxidation in an environmental chamber. Aerosol Sci. Technol. 45 (8):964–72. doi: 10.1080/02786826.2011.573510.
- Pierce, J. R., G. J. Engelhart, L. Hildebrandt, E. A. Weitkamp, R. K. Pathak, N. M. Donahue, A. L. Robinson, P. J. Adams, and S. N. Pandis. 2008. Constraining particle evolution from wall losses, coagulation, and condensation-evaporation in smog-chamber experiments: Optimal estimation based on size distribution measurements. Aerosol Sci. Technol 42 (12):1001–15. doi: 10.1080/02786820802389251.
- Saucy, D. A., R. M. Kamens, and R. W. Linton. 1983. An aerosol injection and outdoor chamber gas. Particle Reactions 17 (12):2617–24. doi: 10.1016/0004-6981(83)90091-4.
- Shao, Y., Y. Wang, M. Du, A. Voliotis, M. R. Alfarra, S. P. O'Meara, S. F. Turner, and G. McFiggans. 2022. Characterisation of the Manchester aerosol chamber facility. Atmos. Meas. Tech. 15 (2):539–59. doi: 10.5194/amt-15-539-2022.
- Simones, M. P., V. R. Gutti, R. M. Meyer, and S. K. Loyalka. 2011. Measurements of aerosol charge and size distribution for graphite, gold, palladium, and silver nanoparticles. Nucl. Technol 176 (2):211–26. doi: 10.13182/NT10-10.
- Sunol, A. M., S. M. Charan, and J. H. Seinfeld. 2018. Computational simulation of the dynamics of secondary organic aerosol formation in an environmental chamber. Aerosol Sci. Technol. 52 (4):470–82. doi: 10.1080/02786826.2018.1427209.
- Trump, E. R., S. A. Epstein, I. Riipinen, and N. M. Donahue. 2016. Wall effects in smog chamber experiments: A model study. Aerosol Sci. Technol. 50 (11):1180–200. doi: 10.1080/02786826.2016.1232858.
- Van Dingenen, R., F. Raes, and H. Vanmarcke. 1989. Molecule and aerosol particle wall losses in SMOG chambers made of glass. J. Aerosol Sci 20 (1):113–22. doi: 10.1016/0021-8502(89)90035-9.
- Vansevenant, B., C. Louis, C. Ferronato, L. Fine, P. Tassel, P. Perret, E. Kostenidou, B. Temime-Roussel, B. D’Anna, K. Sartelet, et al. 2021. Evolution under dark conditions of particles from old and modern diesel vehicles in a new environmental chamber characterized with fresh exhaust emissions. Atmos. Meas. Tech. 14 (12):7627–55. doi: 10.5194/amt-14-7627-2021.
- Wagner, R., C. Yan, K. Lehtipalo, J. Duplissy, T. Nieminen, J. Kangasluoma, P. S. Bauer, A. Bergen, A. Bernhammer, F. Bianchi, et al. 2017. The role of ions in new particle formation in the CLOUD chamber. Atmos. Chem. Phys. 17:15181–97. doi: 10.5194/acp-17-15181-2017.
- Wang, N., S. D. Jorga, J. R. Pierce, N. M. Donahue, and S. N. Pandis. 2018. Particle wall-loss correction methods in smog chamber experiments. Atmos. Meas. Tech. 11 (12):6577–88. doi: 10.5194/amt-11-6577-2018.
- Wiedensohler, A. 1988. An approximation of the bipolar charge distribution for particles in the submicron size range. J. Aerosol Sci 19 (3):387–9. doi: 10.1016/0021-8502(88)90278-9.
- Xu, N., and D. R. Collins. 2021. Design and characterization of a new oxidation flow reactor for laboratory and long-term ambient studies. Atmos. Meas. Tech. 14 (4):2891–906. doi: 10.5194/amt-14-2891-2021.