
 ?Mathematical formulae have been encoded as MathML and are displayed in this HTML version using MathJax in order to improve their display. Uncheck the box to turn MathJax off. This feature requires Javascript. Click on a formula to zoom.
Abstract
UV light at 222 nm inactivates SARS-CoV-2 virions at intensities appearing to be benign to skin and eyes. It can disinfect air without requiring protection of persons from UV as is needed at longer UV wavelengths. The lower risk of damage from 222-nm UV results from enhanced absorption of this UV in the outermost parts of eyes and skin. Microbes can be partially shielded from 250- to 285-nm UV when in host particles. Does the higher absorption at 222-nm increase the shielding of microbes within particles, and if so, to what extent? We use literature values to approximate the compositions and optical properties of SARS-CoV-2 virions and four types of fluids from the respiratory tract and mouth. We model virions within spherical host particles (homogeneous except for the virions), calculate the UV absorbed by the virions, and use these values to calculate survival fractions of virions in particles (Sp). We find that shielding is relatively small for particles generated in quiet breathing (typically 1.5-µm or smaller). For larger particles, shielding increases as the host-particle diameter increases. Shielding is greater at 222- than at 254-nm for all pairs of UV-fluence and particle-diameters calculated. The higher eye-safety thresholds at 222-nm allow use of larger fluences and shorter inactivation times. Because shielding increases as host-particle size increases, and because significant fractions of airborne disease-transmitting particles have diameter >1.5-µm, it appears that the sizes and optical properties of host particles must be considered in designing and verifying UV inactivation systems for such particles.
Editor:
1. Introduction
1.1. Need for UV inactivation of microbes and benefits of UV at 222 nm
Ultraviolet (UV) light (also termed “UV”) at wavelengths from 200 to 300 nm (the UVC range, also termed Germicidal Ultraviolet (GUV) or UVGI) is used to inactivate bacteria (Nardell et al. Citation2008; Mphaphlele et al. Citation2015), viruses and fungi (Kowalski Citation2009). UV is used in schools (Wells, Wells, and Wilder Citation1942), medical facilities (Anderson et al. Citation2018; Rutala et al. Citation2013), restaurants, the food industry, and others (Lindsley et al. Citation2018; Nardell et al. Citation2020). It is used in decontaminating filtering facepiece respirators (Fischer et al. Citation2020) and other masks and filters from which viruses can be reaerosolized (Fisher et al. Citation2012; Nasr et al. Citation2019). UV can reduce the indoor spreading of diseases, such as tuberculosis (TB) (Nardell et al. Citation2008), measles (Wells, Wells, and Wilder Citation1942), influenza, and covid-19 (Nardell Citation2021). An advantage of UV for reducing disease transmission and infection rates is that it can inactivate microbes (viruses, bacteria, and fungi), if the UV wavelength and intensity are in useful ranges. It does not require development of vaccines or discovery of specific antibiotics. It can inactivate simultaneously various species of microbes. By reducing rates of disease transmission, it could reduce the probability of an airborne disease becoming a pandemic.
UV can cause skin cancers and damage the cornea and vision (Sliney and Stuck Citation2021; Nardell et al. Citation2008). Typical systems using wavelengths in the 250–290-nm range must be designed to protect humans from harmful levels of UV, as is done in typical upper-room UV systems. In such upper-room UV systems the UV can be confined within the uppermost part of a room, where microbes are disinfected as they flow in air through the illuminated region (Nardell et al. Citation2008, Citation2020; Zhu et al. Citation2022). The air only needs to be circulated through this UV-illuminated region of the room, and so high disinfection rates are obtained without requiring high air-change rates or extensive filtration (Nardell Citation2021, Fig. 1). However, redesigning or designing rooms to accommodate such systems can add costs and complexity.
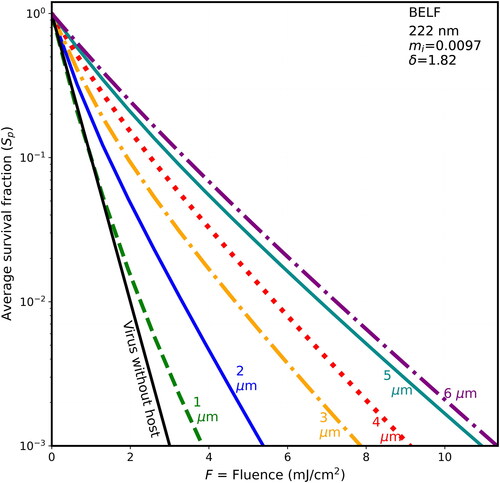
Figure 1. Average survival fractions (Sp) for virions in particles vs. fluence (F), for UV rate constant for inactivation k = 2.3 cm2/mJ at 222 nm for 90-nm diameter virions within spherical host particles of dry BELF (85% solids) having mi = 0.0097 and the host diameters indicated. The particles are illuminated with UV light from 300 randomly chosen directions (100 directions for 6-µm hosts; 150 directions for 5-µm hosts). Lines, starting from the left of the figure, are for the 1-µm host (green, dashed), individual virion (black, solid), 2-µm host (blue, solid), 3-µm host (orange, dot-dash), 4-µm host (red, dotted), 5-µm host (cyan), and 6-µm host ((purple). The F = 10 mJ/cm2 could be obtained with 5 min of UV at the limit I222_eye_86m = 2 mJ cm−2 min−1.
Fortunately, UV at 222 nm can inactivate microbes at doses that do not appear to be harmful to humans or other animals (Buonanno et al. Citation2017, Citation2020; Hessling et al. Citation2021; Welch et al. Citation2023; Fukui et al. Citation2020; Sliney and Stuck Citation2021). UV systems at 222 nm can inactivate airborne viruses directly, in spaces where persons emit virus-containing particles, without needing to draw particles into an upper-room UV system. The advantages of portability and ease of setup, with no need to enclose the 222-nm UV, are large, and they open additional possibilities for reducing transmission of airborne diseases (Bender Citation2022). Measurements of 222-nm-UV inactivation of aerosolized Staphylococcus aureus within a room (Eadie et al. Citation2022), and numerical simulations of 222-nm exposed aerosols flowing through a well- or poorly ventilated classroom (Wood et al. Citation2022), indicate the value of 222-nm UV for disinfecting air.
UV technologies are often used along with heating, ventilation, and air conditioning (HVAC) systems. For designing, building, and operating indoor spaces (e.g., buildings and vehicles), stated goals include minimizing costs in materials, energy, and labor, etc., costs in terms of human health, including morbidity, mortality, and disruption of human gatherings (Morawska et al. Citation2021; Miller et al. Citation2020), and costs in environmental degradation including effects on climate (Baniassadi et al. Citation2022; Allen et al. Citation2015). Transmission of infectious disease can be reduced by optimizing combinations of: ventilation with outside air (including heating, cooling, and/or filtration of particulates (Zhu et al. Citation2020)), mechanical ventilation of indoor air, filtration to reduce microbe-containing particles, and UV inactivation of microbes in airborne particles (Risbeck et al. Citation2021; Srivastava et al. Citation2021; Zhu et al. Citation2022; Wood et al. Citation2022; Zhang and Lai Citation2022). Optimization of overall systems for indoor spaces, including for real-time controls for optimal system usage, requires adequate models for the various subsystems (e.g., ventilation (Park, Mistrick, and Rim Citation2022, Park et al. Citation2023)). It also requires models for UV inactivation of microbes in airborne particles of various sizes and compositions, a topic which has received relatively little attention (e.g., Hill et al. Citation2023; Hill, Mackowski, and Doughty Citation2021, fig. 4; Eversole et al. Citation2023, Appendix G, fig. G5).
The topic of the present work is the effects of the sizes and compositions of microbe-containing airborne particles on the survival of viruses and other microbes within such host particles when they are exposed to various doses of 222- and 254-nm UV light.
1.2. Shielding of microbes from UV in host particles: more shielding at 222 nm?
Microbes within particles in air can be partially shielded from UV, as illustrated in measurements at 254 nm (Kesavan et al. Citation2014; Hill et al. Citation2023) and in modeling of viruses (Doughty, Hill, and Mackowski Citation2021; Hill, Mackowski, and Doughty Citation2021) and bacterial spores (Hill, Doughty, et al. 2022). This shielding from UV tends to increase with particle size. The possibility UV-absorbing host particles shielding microbes, along with the increased absorption of UV in the 200–230 nm range raise the question of whether the increased absorption by proteins and other amide-bonded materials at λ = 222 nm or, more generally λ ≤ 230 nm, increases the protection from UV of microbes within particles, and thus decreases the effectiveness of UV for inactivating microbes at these shorter wavelengths.
The importance of host-particle shielding of microbes from UV depends upon factors, such as the numbers of microbes within particles of various sizes emitted in breathing, speaking, etc. (Shen et al. Citation2022; Morawska et al. Citation2009; Asadi et al. Citation2019; Morawska et al. Citation2022; Pöhlker et al. Citation2023), and the locations where these particles are generated in the respiratory tract (Hou et al. Citation2020) or oral cavity (Huang et al. Citation2021). Also, the importance of shielding depends on the likelihood of infection and its severity (as indicated by lethal dose or other measure) for particles depositing at various sites (Shen et al. Citation2022; Thomas Citation2013, table 4, various species). The importance of shielding also depends on the size distributions of the particles and infectivity of the microbes within them, and how these vary with relative humidity (RH), time since exhalation, airflows, filtration (if any), and UV (if any) (Fennelly et al. Citation2004; Yang, Elankumaran, and Marr Citation2012; Milton et al. Citation2013; Verheyen and Bourouiba Citation2022). The effect of UV on microbes in particles depends on the optical properties of the microbes and the particles at the UV wavelength(s) used, and these properties depend on the compositions of aerosolized materials, e.g., respiratory tract lining fluids (RTLFs; e.g., Bicer Citation2015) and saliva (Edgar, Dawes, and O’Mullane Citation2012).
Particles having a large range of sizes can contribute to disease transmission. Diseases, such as TB, influenza, and inhalation anthrax (Weis et al. Citation2002) are transmitted by particles small enough (e.g., diameter <4 µm) to directly deposit deep within the lung. Others, e.g., coronavirus disease 2019 (covid-19), can infect the lungs, but may first infect the upper respiratory tract (URT), e.g., the nasal cavity (Hou et al. Citation2020; Pinto et al. Citation2022), or the mouth. The virions replicated in the URT may be aerosolized in speaking and then aspirated into the lungs (Hou et al. Citation2020; Stadnytskyi, Anfinrud, and Bax Citation2021), or may be inhaled by the emitter (Kushalnager, Chow, and Bax 2021; Chen et al. Citation2022) or by other persons. That is, diseases carried by particles too large (e.g., >4 µm) to reach the lungs (Geisler et al. Citation2019; Roy, Reed, and Hutt Citation2010), may infect the URT. The mass of (>4 µm) particles emitted tends to exceed the mass of the emitted smaller particles (Shen et al. Citation2022; Bax et al. Citation2022; Harrison et al. Citation2023, fig. 7b). However, the numbers of total and infectious virions in coarse (diameter >5 µm) aerosol particles have been measured for influenza and covid-19 to be much smaller than those in fine (diameter <5 µm) particles (Milton et al. Citation2013; Coleman et al. Citation2022; Lai et al. Citation2023).
The survival fraction (S) is the fraction of microbes that are still infectious after exposure to a dose of, e.g., UV, ozone, or heat. S is a useful quantity for modeling, designing, and using systems to reduce transmission of airborne microbial diseases. For inactivation with UV, the simplest common expression for S is the single-stage decay model (Kowalski Citation2009, p. 53),
(1)
(1)
where k is the UV rate constant for inactivation (cm2/mJ) and F is the UV fluence (energy per unit area (mJ/cm2), often termed the dose or exposure). Also, F = It, where I is the irradiance (mW/cm2) and t is the time of illumination. For a given virus and set of experimental conditions (humidity, etc.) S is measured for various F, and then k is determined by fitting the data to EquationEquation (1)
(1)
(1) . Values of k have been measured for SARS-CoV-2 (Heilingloh et al. Citation2020; Blatchley et al. Citation2023), other viruses (Sagripanti and Lytle Citation2011; Schuit et al. 2020), and bacteria and fungi (Kowalski Citation2009).
In our previous mathematical modeling of shielding of virions in host spheres from UV, the virions were modeled as 100-nm diameter homogeneous spheres (termed “virions”) randomly positioned within host spheres having optical properties selected to approximate dried-to-equilibrium droplets that were sneezed or coughed (Doughty, Hill, and Mackowski Citation2021; Hill, Mackowski, and Doughty Citation2021). The optical properties of the virions were selected to approximate SARS-CoV-2. The host spheres were modeled either as on a surface, illuminated from one to several directions, or as far from a surface, illuminated from all directions. The calculated results showed that: (1) virions in particles can be partially shielded from UV; (2) the extent of shielding is affected by the wavelength of the UV and properties of the dried-droplet host particle; (3) shielding increases as the size of the host particle increases; (4) shielding is decreased in particles illuminated from all directions, as for a particle in turbulent air, tumbling and rotating through all orientations relative to direction(s) of the UV beam(s). In that modeling the key parameter calculated for each virion was,
(2)
(2)
where Cabs,i is the absorption cross section of the ith virion in a particle (whether resting on a surface or not), defined so that Cabs,iI0 is the net rate of energy transfer into the virion, where I0 is the irradiance illuminating the host sphere. Cabs,single is the absorption cross section of an individual virion, defined so that Cabs,singleI0 is the net rate of energy transfer into an individual virion. The absorption efficiency of a sphere is Qabs = Cabs/πa2, where a is the radius. The Qabs_i for the virions were calculated using the Multi-sphere T-Matrix method (MSTM) (Mackowski Citation2008; and Mackowski and Mishchenko Citation2011, Citation2013) which provides solutions for the electromagnetic fields in groups of non-intersecting spheres. Methods that can calculate Qabs,i for more complex particles are discussed briefly in Section 4.2.3.
The optical properties of the materials in particles exhaled from the nose and mouth are also needed for modeling of UV in respiratory particles. The penetration depth, δ, for an optical planewave propagating in a material is the distance z at which I(z)/Io = 1/e = 0.369, where e = exp(1) is Euler’s number, where the intensity of the irradiance of the wave at position (z) is
(3)
(3)
and where Io is I at z = 0. Using this δ and the optical wavelength λ, the imaginary part of the complex refractive index, mi is obtained as,
(4)
(4)
The mi is related to the absorptivity, ε, by
(5)
(5)
where c is the concentration, and where if the λ is in µm, then ε is in liter moles−1 µm−1 when the concentration is in moles/liter, and is in cm3 g−1 µm−1 when c is in g/cm3. The real part of the complex refractive index is mr.
1.3. Objectives and approach
In this work, our objective is to improve our understanding of the effects of UV wavelength and the host-particle size and composition on survival fractions of virions when the virions are within host particles which may partially shield them from 222- or 254-nm UV. The emphasis is on SARS-CoV-2 virions, although the results are also relevant to varying degrees to other virions and microbes. The hope is that an increased understanding of shielding from UV, and the modeling capabilities described here, will allow designers and users of germicidal- or solar-UV systems to employ UV more effectively and economically to reduce disease transmission.
To obtain the required mr and mi, we review the literature relating to compositions of RTLF in different regions of the upper and lower respiratory tract and of saliva to estimate typical values of the concentrations of the UV absorbing materials within them, and which are likely exhaled in droplets. The three RTLF we specifically examine (defined in Section 2) are bronchiole-alveolar epithelial lining fluid (BELF), mucus (Fahy and Dickey Citation2010), and thick mucus. We also extract absorptivities of the main UV absorbing molecules from the literature and use the estimated compositions and absorptivities to calculate values of the mi for RTLFs in different regions which we hope are representative of the particles exhaled from the mouth and different regions of the respiratory tract. We assume that the aerosolized particles have the same compositions as the RTLF or saliva, although we also examine reported measurements of compositions of exhaled particles to see if they indicate differences between RTLF and exhaled RTLF.
Here, the survival fraction (Si(kF)) for the ith virion in a particle is calculated using EquationEquation (1)(1)
(1) as
(6)
(6)
The average survival fraction for all the virions in a particle is denoted as Sp, where the “p” suggests “particle” (see Methods). We calculate and illustrate curves of Sp vs. kF (rate constant × fluence) for virions of SARS-CoV-2 (approximated as 90-nm diameter spherical particles) within host particles that are spherical and homogeneous (except for the virions) and which have optical properties to approximate dried particles of breathed, sneezed, or coughed respiratory fluids. The host particles have diameters of 1-, 2-, 3-, 4-, 5-, and 6-µm. The host particles are in air and are illuminated from “all” (100–300 randomly chosen) directions. The UV wavelengths used are 222-nm, which has the much higher damage thresholds (Sliney and Stuck Citation2021; Welch et al. Citation2023; ACGIH Citation2023, p. 169, table 1), and 254 nm which is used more extensively now.
Table 1. Absorptivities (liter mole−1 µm−1 and cm3/g µm−1) of the main UV absorbing molecules in the respiratory fluids considered.
2. Methods
The virions within host particles are modeled here as 90-nm diameter homogeneous spheres. The host particles are homogeneous except for the virions. The virions are positioned at random locations within the host particle, but do not overlap. Doughty, Hill, and Mackowski (Citation2021, fig. 2) illustrate the locations of modeled virions (each 100 nm diameter) color-coded to indicate relative UV intensities for illumination from one direction and relative UV absorption by each model virion.
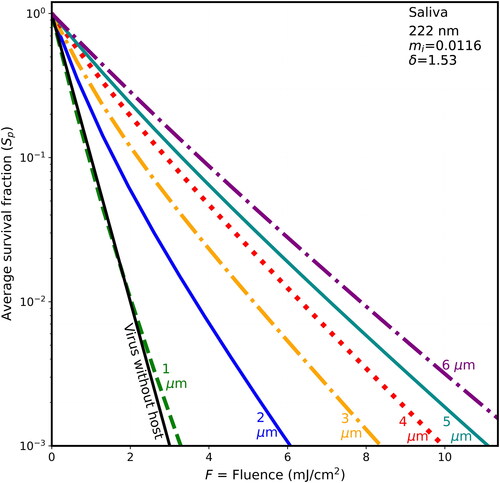
Figure 2. Average survival fractions (Sp) vs. F for 90-nm virions within spherical particles as in , with λ = 222 nm, except the host particle is of dried saliva (only 15% water mass fraction) with mi = 0.0116 and penetration depth = 1.529 µm.
The optical properties used in the modeling reported here are based on, (1) the UV absorbances of the light-absorbing molecules in the relevant materials at the wavelengths listed in Section 2.1 and (2) on the concentrations of these light-absorbing molecules for the materials studied. The concentrations used here were selected to be within the reported ranges of concentrations for the various materials as described in Section 2.2.
2.1. Absorptivities of the main relevant biological molecules at 222 and 254 nm
The UVC absorbing materials responsible for most of the UV absorption in viruses, bacteria, and fluids of the RTLF and oral cavity are the proteins and peptides, and to a lesser extent, the nucleic acids, and uric acid. lists the absorptivities of the molecules included in the calculations. Absorptivities for individual amino acids were estimated from Saidel, Goldfarb, and Waldman (Citation1952), and Wetlaufer (Citation1963, figs. 1 and 2). Absorptivities of the peptide bonds of proteins, as well as the N-acetyl bonds linking mucin’s proteins to its carbohydrates via N-acetyl sugars, such as N-acetylglucoseamine, N-acetylglalactoseamine, and sialic acid (N-acetylneuraminic acid), were estimated from Goldfarb (Citation1953). Absorptivities of DNA and RNA were estimated using Chen, Craik, and Bolton (Citation2009, figs. 2 and 5). Urate was estimated using Stimson and Reuter (Citation1943), Dey, Sain, and Goswami (Citation2014, their fig. 9A), and (for 254 nm) Hawkins, Zipkin, and Marshall (Citation1963).
Additional molecules (e.g., methionine, histidine, and ascorbate) which absorb UV at 222 nm but only absorb UV negligibly at 254 nm were not included. Other molecules which absorb UV at both 222 and 254 nm (e.g., NAD, AMP, flavin adenine dinucleotide, and pyridoxal) and which can occur in RTLF and saliva (e.g., when immunological or bacterial cells (Haro et al. Citation2020) are lyzed) were not included. We think their concentration × absorptivity is likely to be too low to justify the increased complexity, time required, and possibilities for error in including them, especially considering the other variations and uncertainties in estimating the mi.
2.2. Estimated compositions of host materials pre- and post-aerosolization and drying
The UV-absorbing biochemicals and their mass fractions were estimated/selected from the literature for one virus (SARS CoV-2) and four fluids which dry-to-equilibrium with air to become host particles. Three of the host-particle compositions are of RTLF, which differs by location in the respiratory tract (Bicer Citation2015; Patton and Byron Citation2007) and by a person’s health and other factors. The fourth composition is that of the lining fluid of the oral cavity, i.e., saliva. lists the UV-absorbing constituents included here, and the mass fractions assumed for them, for host particles of four different compositions and for one virus. The particles are assumed to be dried-to-equilibrium in air. The particle mass is assumed to be 85% solids and 15% water, as was measured for human saliva at 50% RH (Merhi et al. Citation2022, fig. 2A). We do not know the specific RH that would correspond to 15% water by mass for any of the specific compositions of saliva or respiratory fluid assumed here. Covid-19 deaths appear to increase at low indoor RH (Verheyen and Bourouiba Citation2022). RH in the range 12–24% were reported for a study of six commercial buildings in the US Midwest during the winter (Reynolds et al. Citation2001, table 2). For saliva at an RH of 20%, Merhi et al. (Citation2022, fig. 2A) measured approximately 93% solids and 7% water. That is, the solids fraction was approximately 7.5% higher than at RH = 50%, and so the mi would also be a little higher.
Table 2. Concentrations (g/cm3) of the biochemicals contributing to the mi, and the mi at 222 and 254 nm for the five materials listed.
Non-UV-absorbing constituents such as inorganic salts (e.g., NaCl, KCl, and Mg[HPO4]) are not listed in , but are accounted for in calculating the mass fractions of UV-absorbing and non-UV-absorbing constituents. The densities in were estimated using the densities of components. These densities range from 2.16 g/cm3 (NaCl) to 0.92 g/cm3 (palmitic acid and the primary (by mass) contributor to dipalmitoyl phosphatidyl choline (DPPC), the major surfactant lipid in the alveoli and terminal bronchioles).
2.2.1. Virions
The compositions of SARS-CoV-2 virions are as described previously (Doughty, Hill, and Mackowski Citation2021; Hill, Mackowski, and Doughty Citation2021). However, at 222 nm the peptide bonds also absorb UV and so this absorption by peptides is included. We assume no free amino acids and one peptide bond per amino acid.
2.2.2. Bronchiolar epithelial lining fluid (BELF) (before aerosolization)
The bronchiole fluid film burst (BFFB) mechanism described by Johnson and Morawska (Citation2009) explains how BELF is aerosolized. After a person exhales, their bronchioles collapse because of surface tension of the BELF. When the person inhales and the bronchioles expand, a fluid within the expanding bronchiole is pulled into a thin membrane which eventually bursts into droplets, many of which are drawn into the alveoli. Many droplets small enough to avoid impacting onto the internal surfaces of the lung are then exhaled. Then, if the person does not perform additional motions which generate aerosol from other parts of the respiratory tract, e.g., by speaking, singing (Gregson et al. Citation2021; Harrison et al. Citation2023), coughing, shouting, or snoring, the aerosol emitted is primarily composed of BELF. We use the term BELF to indicate our best estimate of the BELF aerosolized with the BFFB mechanism and exiting the lung, not to indicate measured composition of BELF, although various substances in exhaled droplets have been measured (Almstrand et al. Citation2012; Bredberg et al. Citation2012).
We assume that the measured/reviewed compositions of broncheoalveolar lavage fluids (BAL) described by Bicer (Citation2015) are useful approximation of BELF. Bicer’s (Citation2015) dissertation reviews the literature and provides concentrations of the major proteins, lipids, inorganic salts, and some addition UV-absorbing molecules which occur in small amounts (uric acid and ascorbic acid) (see also Kumar et al. Citation2017; Hassoun et al. Citation2018). The most common surfactant lipids that are not common throughout most of the respiratory tract are DPPC and palmitoyl-oleoyl-glycero-phosphocholine (POPC), which occur primarily in alveoli and bronchioles.
In different regions of the respiratory tract, large variations occur in the epithelial linings (Patton and Byron Citation2007, figs. 1 and 2; Janssen et al. Citation2016, fig. 2) and cellular compositions of these lining fluids (Pouwels et al. Citation2021). For example, the major mucin MUC5B is not secreted in alveoli or the terminal bronchioles (Okuda et al. Citation2019). It has, however, been suggested to mix into alveolar fluids (Janssen et al. Citation2016), although the major flow is from alveoli toward larger airways. Mucus-secreting goblet cells do not occur in terminal bronchioles. Overall, these findings substantiate the choices of Bicer (Citation2015) and others to not include mucins as major contributors to BELF.
Measurements have been reported for materials in particles generated using breathing/exhaling schemes consistent with the BFFB mechanism of Johnson and Morawska (Citation2009), or with the breathing procedures described by Almstrand et al. (Citation2010), which appears to be consistent with the BFFB mechanism. For examples, Bredberg et al. (Citation2012) analyzed particles in exhaled air using liquid chromatography followed by mass spectrometry. They estimated abundances of 124 proteins using the Mascot protein abundance index protocol and found these abundances to be, “in agreement with the expected protein composition of BELF” (Bredberg et al. Citation2012). Human serum albumin (HSA) had a Mascot score 4× the next highest scores, i.e., those of serotransferrin and pulmonary surfactant-associated protein A1. Larsson et al. (Citation2015) reported measurements of HSA and surfactant protein A (see also Behndig et al. (Citation2019)), in normal and asthmatic subjects, and in subjects allergic to birch pollen. Tinglev et al. (Citation2016) reported mass spectrometry measurements of the surfactants DPPC and POPC in exhaled breath and ruled out major contributions from the oral cavity. Larsson et al. (Citation2017, fig. 3) measured the mass fractions of DPPC and POPC in particles collected from subjects breathing in various ways (“reference,” forced-exhalation, cough, and airway re-opening). Hussain-Alkhateeb et al. (Citation2021) measured DPPC and POPC in exhaled breath as the two most common surfactant phospholipids in BELF. No mucins were reported by Bicer (Citation2015), or in any of the above-cited measurements of particles generated by the BFFB mechanism. In examining the data described in the above measurements we do not notice inconsistencies between the measurements made by and reviewed by Bicer (Citation2015) for BAL, and so we assume they are generally consistent and use them for the present work. Because the density of esters of palmitic acid is relatively low, the density of BELF used here is relatively low.
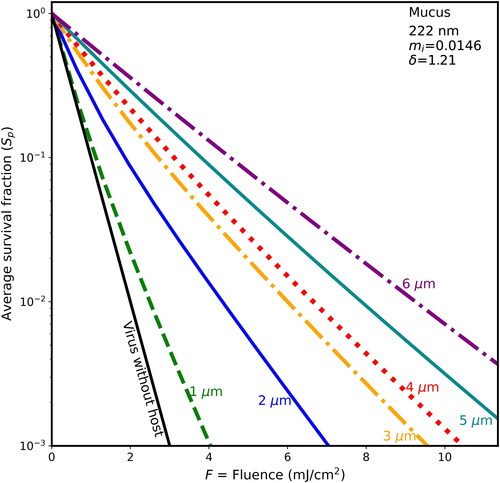
Figure 3. Average survival fractions (Sp) vs. F for 90-nm virions within spherical particles of dry mucus (85% solids) as in , except that the host particle has mi = 0.0146, and the penetration depth is 1.21 µm.
BELF is the least UV-absorbing of the four fluids modeled here for two main reasons. First, HSA comprises approximately 60% of the protein of BELF. HSA has only one tryptophan out of 585 amino acids (He and Carter Citation1992). Genomic data suggest that one tryptophan per 80 amino acids is closer to an average value for all eukaryotic protein (Kozlowski Citation2016). Because tryptophan is about 11 times more absorbing of UV at 222 nm than at 254 nm and is more absorbing than other amino acids, HSA is less absorbing than the average protein in a cell. Second, the surfactants DPPC and dipalmitoyl phosphatidyl glycerol (DPG) contribute about 40% of the mass, but each absorbs negligible UV. The only fatty acids and fats (for the modeling in this article) that absorb significant UV above 200 nm are conjugated and polyunsatured (Brice and Swain Citation1945, fig. 1; Jaffe and Orchin Citation1962, Sections 11.1 and 11.3 and Table 11.2). However, the fraction of such polyunsaturated fatty acids/fats in lung surfactant appears to be low (Veldhuizen et al. Citation1998). We assume that the lipids of BELF can be neglected in estimating UV absorption at 222 and 254 nm, considering other uncertainties in this modeling.
2.2.3. Normal mucus (before aerosolization)
Normal (healthy) mucus contains mucins, albumins and other plasma proteins, uric acid, and inorganic electrolytes, and smaller amounts of nucleic acids. The values of these used here are based primarily on Hill et al. (Citation2022, p. 1761): “Normal human airway mucus is a hydrogel comprised of ∼97.5% water, 0.9% salt, 1.1% globular proteins, and ∼0.5% high-molecular-weight mucin polymers.” Mucins are large glycoproteins typically 70–80% carbohydrate and 20–30% protein. The large majority of mucin in human airway mucus is MUC5B and MUC5AB, where the fraction in MUC5B is typically a few times larger than that of MUC5AB (Thornton, Rousseau, and McGuckin Citation2008). The amino acid content of a repeated fragment of MUC5B is stated on NCBI Uniprot. However, the assembled MUC5B also includes regions rich in serine, threonine, and cystine (i.e., no tryptophan, tyrosine, or phenylalanine). We are not confident in methods to accurately estimate the amino acid content of MUC5B. Therefore, we simply picked some amino acid fractions in the range of values for typical proteins. Matsui et al. (Citation2005) stated, “In all the mucus samples, mucins constituted ∼60% of the nonionic components.” (p. 1092, Results), and “we estimated the percent dry weight (percentage of solids) of normal mucus at ∼1.5–2.5% and of thick CF-like mucus at ∼6–15%, based on data reported from cell culture …, a mouse model …, and human studies.”
Depending upon the extent of any infections or diseases, exposure to harmful gases and particles (e.g., tobacco smoke, engine exhaust, and pollen allergens), the mucus in the respiratory tract may contain varying amounts of bacteria (Haro et al. Citation2020), viruses, and immunological cells (or debris from these cells). This mucus can also contain nucleic acids in neutrophil extracellular traps (NETs) (Lachowicz-Scroggins et al. Citation2019; Arcanjo et al. Citation2020) or traps from eosinophils or basophils (Yousefi et al. Citation2020). That nasal and nasopharyngeal swabs are useful for sampling for SARS-CoV-2 concentrations (Péré et al. Citation2020) is one more indication of the presence of nucleic acids in mucus.
2.2.4. Thick mucus (before aerosolization)
Persons with asthma (Hill et al. Citation2014; Hill et al. Citation2022) or infected with SARS-CoV-2 (Kratochvil et al. Citation2022) tend to have higher concentrations of organic molecules, mucus cell hyperplasia (i.e., more cells with secretory granules holding mucin glycoproteins) and mucus hypersecretion (Evans and Koo Citation2009), and more DNA (Fahy et al. Citation1993) and actin in the mucus. In persons with chronic obstructive pulmonary disease (COPD) the DNA and actin concentrations tend to be even higher. The concentrations of bacteria and viruses in the mucus of such patients tend to be higher than they are in normal mucus. Mucus overproduction has been suggested to help protect against covid-19 (Liuzzo Scorpo, Ferrante, and La Gruta 2021).
The values of solids used here are (as for normal mucus, above) based largely on Hill et al. (Citation2022, table 1 and figs. 7(C,D)) which is similar to Matsui et al. (Citation2005). The total solids assumed are 7% by mass. Thus, water is 93%. The fraction of total mass (including water) in all inorganic salts (Na+, K+, Cl−, H2PO4−, etc.) is 0.9%, and in organic solids is 6.1%. In Hill et al. (Citation2022, table 1) the concentration of mucins varied from 20% to 50% of the total organic solids. We assumed that 50% of the total organic solids was in mucins, and so the total mucin was 3.05 g, and the non-mucin protein was 3.05 g. We do not know the size ranges of particles that might be generated in aerosolizing thick mucus and then allowing it to dry in air.
2.2.5. Saliva (before aerosolization)
Our approximations of saliva are similar to our prior work (Doughty, Hill, and Mackowski Citation2021), which considered the review by Edgar, Dawes, and D. O’Mullane (Citation2012, table 1, references therein, and fig. 5.4). It also relies on reports of DNA and RNA in saliva by Pandit, Cooper-White, and Punyadeera (Citation2013) who measured 0.17–0.76 g/L of extracellular RNA in the saliva (in the supernatant after centrifugation) for healthy persons and 0.09–0.36 g/L in cancer patients, and by Konečná et al. (Citation2020) who measured average DNA concentrations in saliva of 0.24 g/L in healthy persons and 0.5 g/L in periodontitis patients. DNA from human saliva is used routinely for genomic studies (Poehls et al. Citation2018). In patients infected with SARS-CoV-2 the concentrations of viral RNA in saliva can exceed 1010 copies/mL (Wyllie et al. Citation2020).
2.3. Complex refractive index
The total mi for a material is obtained as the sum of the mi for each of its constituents as described in more detail in Hill et al. (Citation2015, p. 58). Non-UV-absorbing materials, such as NaCl, KCl, most carbohydrates, and most lipids, are sufficiently weakly absorbing that their contribution to mi is assumed to be zero.
2.4. UV inactivation rate constants for SARS-CoV-2 virions and UV threshold limits for humans
Comparisons of 222-nm vs. 254-nm UV for disinfection of microbes in the presence of humans (who can be harmed by UV) require measures of the damage to virions and the damage to humans. For damage to virions the main virus-dependent parameter needed is k, the UV rate constant for inactivation. For damage to humans, the main quantities needed are the threshold limit values. Values of these quantities at 222- and 254-nm are discussed below.
Measured UV survival fractions (log-scale) vs. UV fluence for SARS-CoV-2 and other coronaviruses are illustrated by Blatchley et al. (Citation2023, fig. 3), where they plot the reported results for 14 studies. These authors conclude that each 1 log10 reduction in survival fraction requires approximately 1 mJ/cm2 of 222-nm UV, a value which corresponds to k = 2.3 cm2/mJ at 222 nm (in EquationEquation (1)(1)
(1) ). For 254-nm UV, we use k = 1.7 cm2/mJ for the exponential decay of survival fraction (EquationEquation (1)
(1)
(1) ) which is approximately 50% higher than the value chosen by Blatchley et al. (Citation2023), but well within the overall scatter in the figures in that article. In selecting k from the values in Blatchley et al. (Citation2023), we emphasized some of the measurements of SARS-CoV-2 inactivation a little more than the calculated values. The use of these best-estimate actual k values allows estimation of the times required to achieve the reported decreases in Sp for a given F.
A threshold limit value for eyes at 222 nm of 160 mJ cm−2 per day was proposed by Sliney and Stuck (Citation2021) and used in developing the limits set by the American Conference of Government Industrial Hygienists (ACGIH Citation2023, p. 160, table 1). Interpolation between these ACGIH limits for eye exposure between 220 and 225 nm gives 171.2 mJ/cm2. Using this value, we assume the exposure occurs over an 86 min period (as for a meeting or meal at a restaurant (e.g., Lu et al. Citation2020)) and so the average irradiance over this time is I222_eye_86m = 2 mJ cm−2 min−1. For skin at 222 nm, a threshold limit value of 480 mJ cm−2 per day was also proposed by Sliney and Stuck (Citation2021) and was used in developing the ACGIH limits (ACGIH Citation2023, p. 161, table 2). Interpolation between these ACGIH limits for skin exposure between 220 and 225 nm gives 442 mJ/cm2 for the threshold limit value at 222 nm. For 254-nm UV the threshold limit for eyes is 6 mJ/cm2, which is 171.2/6 = 28.5 times smaller than the threshold limit at 222 nm. For that dose in an 86-minute period the I254_eye_86m = 0.0705 mJ cm−2 min−1.
2.5. Calculation of UV absorption efficiencies in microbes within particles
The MSTM (Mackowski (Citation2008, Citation2014); Mackowski and Mishchenko (Citation2011, Citation2013) was used to calculate the Qabs for each of the N virions within each spherical host particle as in Doughty, Hill, and Mackowski (Citation2021) and Hill, Mackowski, and Doughty (Citation2021), but using the wavelengths and host particle compositions described in Section 2.2 (above). Each sphere (virions and the host) scatters and absorbs light. The amount of UV absorbed by each virion is influenced by each of the other virions and the host sphere. The MSTM provides solutions to the electromagnetic field equations (Maxwell’s equations) for systems of non-intersecting spheres. In this method, the electromagnetic fields within each sphere are expanded in the vector spherical harmonics (solutions to Maxwell’s equations in spherical coordinates) having unknown coefficients (Mackowski Citation1991). The values of these coefficients are obtained using the T-matrix method. Although the MSTM solutions are theoretically exact, they can be limited by the numerical accuracy and capacity of the computer. For the calculations shown here, the MSTM is likely the least significant contribution to uncertainties. The MSTM has been validated in multiple ways, including verifying that the tangential components of the electric and magnetic fields are continuous at interfaces. The MSTM has been used as the standard/exact method for helping to validate non-exact numerical methods, including the discrete dipole method (Flatau, Fuller, and Mackowski Citation1993).
In EquationEquation (3)(3)
(3) , the FRi define an effective Fi for each of the N virions within a host particle illuminated with a fluence (F). The average of the survival fractions (where each Si(kF) = exp(−kFRi)) (EquationEquation (3)
(3)
(3) ) of all the N modeled virions in each host, is defined as Sp(kF), (where the subscript p suggests “particle”), and which explicitly is,
(7)
(7)
This Sp(kF) is the key parameter illustrated in the figures. We suggest it is the main parameter to use in understanding the effects of the particle in shielding from UV or enhancement of UV. For combining the UV shielding of virions (as discussed here) with computational fluid dynamics (CFD) models (e.g., Zhu et al. Citation2013), and with models for particle transport throughout indoor spaces (e.g., Wood et al. Citation2022; EquationEquations (3)–Equation(5)(5)
(5) , but without assuming a particle radius of zero), and with models for the UV fluence (F) throughout these spaces, the time-integrated F can be calculated and used with the Ri for each microbe in each host-particle size and composition (as calculated with the MSTM) to calculate the Sp using EquationEquation (7)
(7)
(7) .
In Doughty, Hill, and Mackowski (Citation2021) and Hill, Mackowski, and Doughty (2022), the host particles were in fixed position and illuminated from one or a very few directions in most cases, and so the distributions of the Ri were not rotationally symmetric. There were two cases with orientation-averaged results, one each for a 5- and a 9-µm host with virions. Because the host particles were as large as 9-µm (i.e., over 30 wavelengths), illuminated from only one or a few directions, and because we were interested in the most-shielded virions, large numbers of virions (e.g., 10,000) were needed in most cases to express the large range of Ri, varying over multiple orders of magnitude. Also, many host particles were used because 10,000 particles are far too many to reasonably put into any one host sphere.
Here, the particles are assumed to be illuminated equally from all directions, because the illumination is equal from all directions, and/or because the particles rotate and tumble in response to turbulent airflows and Brownian diffusional forces. That is, the particles are assumed to be illuminated in air for long enough for each particle to be illuminated from nearly all directions (relative to the particle’s axes). We approximate the illumination from all directions using 300 different random orientations for 1–4-µm hosts, 150 random orientations for 5-µm hosts, and 100 random orientations for 6-µm hosts. Fewer orientations were used for the larger host spheres to reduce computational time. With so many different illumination directions, regions shielded from UV when illuminated from one direction can still be illuminated well when the particle is illuminated in some different orientations.
For each host material, random distributions of N spheres were used for each particle size, i.e., N = 20 virions for the 1-µm hosts; 32 virions for the 2-µm hosts; 40 virions for the 3-µm hosts; 64 virions for the 4-µm hosts; 125 virions for the 5-µm hosts; and 216 virions for the 6-µm hosts. That is, for host diameter ≥4-µm the numbers of virions are proportional to volume. The default assumption for the number of virions per droplet would be the droplet volume times the virions/volume of the aerosolized fluid. However, if that trend were continued down to 1-µm hosts there would be only one virion in the 1-µm host, which is not adequate for sampling. Therefore, in going to 3 to 2 to 1 µm, the density of virions per volume increases to achieve improved sampling within the host spheres. We assume that virion density per volume does not significantly affect the results within the ranges used here. Although that assumption is clearly not valid in general, we think it is valid for the cases studied here for several reasons. (1) We examined the effects of particle densities in some detail in previous calculations (Doughty, Hill, and Mackowski Citation2021). (2) The virions and host particles have similar complex refractive indices. (3) The mass fraction of 20, 90-nm virions, within a 1-µm host is 0.073% and so the virions have a tiny effect on the average refractive index of the host particle. (4) The calculations are for all orientations, i.e., cases which are far more forgiving than single-direction illumination for a particle on a surface. (5) The Sp is an average, a forgiving calculation. (6) A difference in Sp of 3% is negligible in comparison with the variations in Sp that are important in the figures in this article.
3. Results
3.1. Optical properties for the assumed compositions
provides the contributions to the mi as calculated for the UV absorbing components of the virions and fluids from the respiratory tract as approximated here, for both 222 and 254 nm. These mi were obtained using the absorptivities of the main UV-absorbing constituents shown in , and the mass fractions approximated here for host particles of four different compositions and for one virus from . Also in are the figure numbers which use these mi.
Table 3. The imaginary component of the refractive index (mi), at 222 and 254 nm for the five materials and compositions listed in Table 2.
provides the mi as calculated for the UV absorbing components of the virions and fluids from the respiratory tract as approximated here.
Table 4. The imaginary component of the refractive index (mi), penetration depth (δ), and real component of the refractive index (mr) at 222 and 254 nm for the five materials and compositions listed in Tables 2 and 3.
3.2. Survival fractions at 222 nm: shielding increases as penetration depth decreases
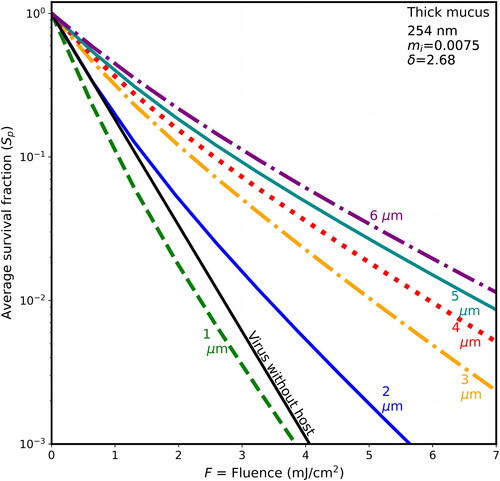
Each of illustrates the survival fractions vs. fluence for six host diameters (1–6 µm) and for the naked virion, all when the wavelength is 222 nm. The calculated Sp (average survival fractions of virions in particles) are shown for four host materials: BELF in ; saliva in ; normal mucus in ; and thick mucus in . The parameters are listed in . Some parameters are also given in the captions. To provide a sense of the times required to achieve the fluences used in the figures, we used the upper limit irradiance for eye damage (ACGIH Citation2023, p. 169, interpolated from table 1; see also Sliney and Stuck Citation2021, table 1). We assumed a maximum exposure time of 86 min (as described in 2.4), i.e., I222_eye_86m = 2 mJ cm−2 min−1.
The survival fractions tend to increase in stepping through , where the host spheres, in sequence, are BELF, saliva, mucus, and thick mucus, and the host-sphere penetration depths decrease from 1.816 to 0.8 µm. For example, in , when the fluence is 2 mJ/cm2 and the host sphere is 2-µm diameter the S is 0.01 for the naked virion and the Sp are 0.05 for BELF, 0.06 for Saliva, 0.086 for mucus, and 0.12 for thick mucus. Or for higher fluence, when F = 4 mJ/cm2, then the S is 0.0001 for the naked virion (below the Figure), and the Sp is less than 0.01 for both BELF and saliva and is 0.013 for mucus, and 0.021 for thick mucus. That is, in the case of 2-µm hosts and F = 4 mJ/cm2, the shielding is relatively small (i.e., only 1.3% of the virions survive in normal mucus).
3.3. Survival fractions at 222 nm: shielding increases with host diameter
In , the increase in Sp with particle size is directly apparent. For example, in for the host particles arising from normal mucus, when the fluence is 4 mJ/cm2, then the S is 0.0001 for the naked virion (below the Figure), Sp = 0.001 for the 1-µm diameter host, Sp = 0.013 for the 2-µm diameter, host and Sp = 0.09 for the 5-µm diameter host. That is, 9% of the virions survive in the 5-µm host of dried normal mucus.
Figure 4. Average survival fractions (Sp) vs. F for 90-nm virions within spherical host particles as in with λ = 222 nm, except the host particle is dried thick mucus (85% solids), mi = 0.02, and the penetration depth is 0.8 µm.
3.4. Survival fractions vs. F at 254 nm: shielding is less than at 222 nm
Each of illustrates the survival fractions vs. fluence for six host diameters (1–6 µm) and for the naked virion as in , but with a wavelength of 254 nm, where the rate constant for inactivation rate is 1.7 cm2/mJ. The maximum fluence shown is 7 mJ/cm2, i.e., only 63% of the 11 mJ/cm2 maximum F shown in . If F is not decreased in this way, the lines are too close together, and difficult to distinguish. The host materials in are in the same order as in (BELF, saliva, normal mucus, and thick mucus). However, because the wavelength-dependence of the absorbances of the differing components of host materials, the penetration depths of the host spheres do not decrease monotonically with figure order. Instead, the δ for 254 nm decrease from to . As they decrease, the survival fractions tend to increase.
Figure 5. Average survival fractions (Sp) vs. F for 90-nm virions within spherical particles of dry BELF (85% solids), as in , except that the wavelength is 254 nm; the UV rate constant for inactivation (k) is 1.7 cm2/mJ; the mi is 0.00068; and the penetration depth is 29.55 µm as listed in the upper right of the figure.
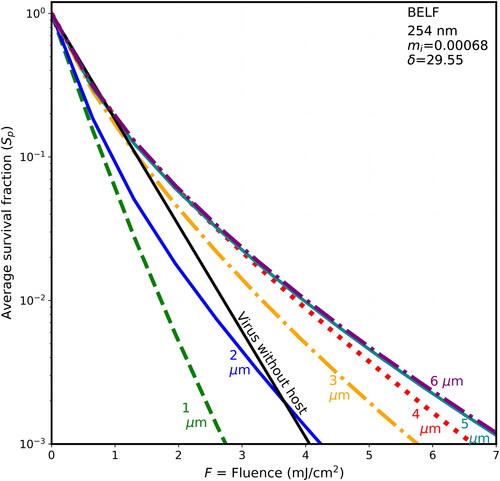
Figure 6. Average survival fractions (Sp) vs. F for 90-nm virions within spherical particles as in with λ = 254 nm, except the host particle is of dried saliva and the penetration depth is 3.145 µm.
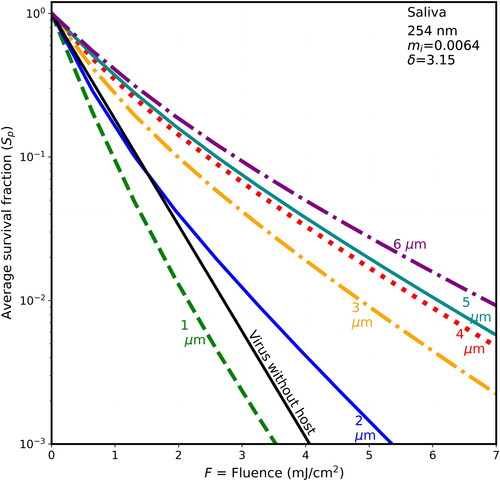
Figure 7. Average survival fractions (Sp) vs. F for 90-nm virions within spherical particles as in , with λ = 254 nm, except that the host particle is of dried mucus (85% solids), mi = 0.002, and the penetration depth is 10.04 µm.
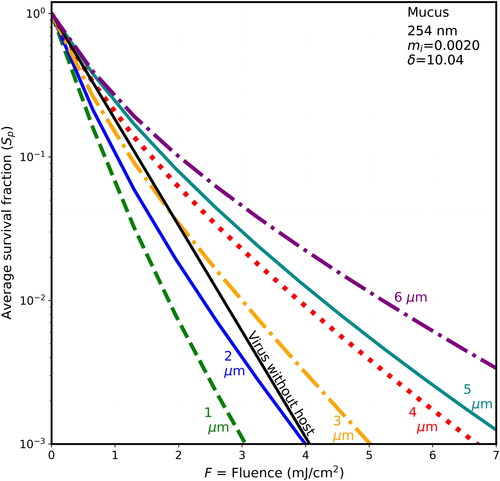
Figure 8. Average survival fractions (Sp) vs. F for 90-nm virions within spherical particles as in with λ = 254 nm, except the host sphere is nominally thick mucus with mi = 0.0075, and the penetration depth is 2.68 µm.
In , the penetration depth is almost 5 times the largest host diameter and so begins to be in the region where δ ≫ d, and d ≫ λ. In that way it has similarities to the modeling of UV in clusters of bacterial spores in spherical host particles illuminated at 325 and 450 nm (Hill, Doughty, et al. 2022;, fig. 4) where the penetration depths were 36 µm and 242 µm. In the cases with δ ≫ d, and d ≫ λ the penetration depths are sufficiently large that many of the virions within the host are exposed to more intense UV than is in the planewave illumination beam. This increased intensity occurs because of the focusing of the UV by the illuminated front surface of the sphere and by reflection of light back into the host sphere, while relatively little UV is absorbed. In , the similar magnitudes of the Sp vs. F for 4-, 5-, and 6-µm hosts a possible relevance of geometrical optics limit (e.g., Chowdhury, Barber, and Hill Citation1992) if δ ≫ d, and d ≫ λ.
3.5. Survival fractions vs. diameter for different fluences at 222 and 254 nm
show the Sp vs. host-sphere diameter for fluences increasing from 2 mJ/cm2 () to 10 mJ/cm2 (). In each figure, the Sp are shown for 222-nm UV with each of the four materials used in and for 254-nm UV with two of the four materials (normal mucus and BELF). In when the host sphere diameters ≥2 µm the 222-nm UV results are the top four curves and the 254-nm results are the lower two curves. Results for saliva and thick mucus with 254-nm UV are not shown because including them makes the figure crowded and difficult to label.
Figure 9. Average survival fractions in particles (Sp) vs. diameter (µm) for fluence = 2 mJ/cm2 at 222 nm (the upper four curves when the diameter is >1 µm), and at 254 nm in the lower two curves (except when d < 1 µm). In all cases, the virions are modeled as 90-nm spheres within spherical particles of the materials indicated. For the naked virus, the host sphere is also 90 nm (or 90 nm plus a number so small that it rounds to 90.0 nm). The lines guide the eye but do not indicate the results for points between the diameters indicated. UV rate constant for inactivation (k) is 2.3 cm2/mJ at 222 nm and is 1.7 cm2/mJ at 254 nm. The F = 2 mJ/cm2 could be obtained 1 min of UV at the limit I222_eye_86m = 2 mJ cm−2 min−1. For the 254 nm UV with the eye-limited irradiance I254_eye_86m = 0.0705 mJ cm−2 min−1 the F = 2 mJ/cm2 could be obtained 28.5 min.
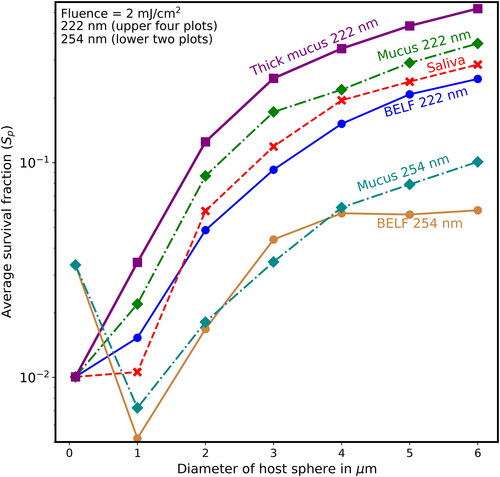
Figure 10. Average survival fractions (Sp) vs. diameter (µm) as in except that the lowest labeled value on the y-axis is 10−4, and the fluence is 4 mJ/cm2, which could be obtained with 2 min of UV at the limit I222_eye_86m = 2 mJ cm−2 min−1.
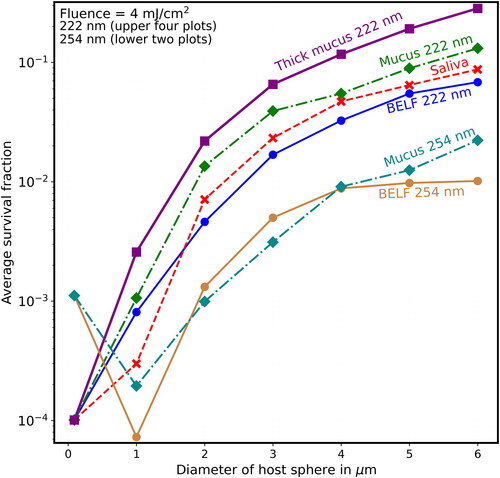
Figure 11. Average survival fractions (Sp) vs. diameter (µm) as in except that the lowest labeled value on the y-axis is 10−5, and the fluence is 6 mJ/cm2, which could be obtained with 3 min of UV at the limit I222_eye_86m = 2 mJ cm−2 min−1.
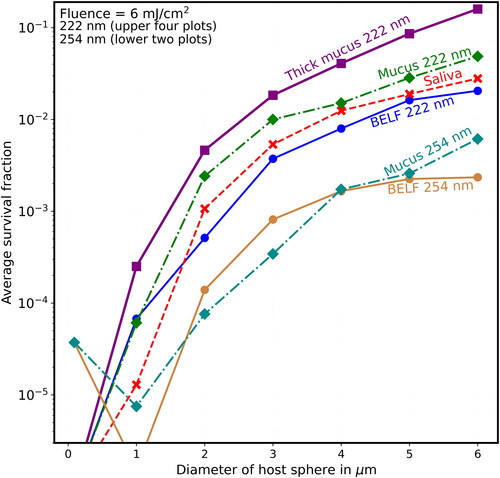
Figure 12. Average survival fractions (Sp) vs. diameter (µm) as in except that the lowest labeled value on the y-axis is 10−6, and the fluence is 8 mJ/cm2, which could be obtained with 4 min of UV at the limit I222_eye_86m = 2 mJ cm−2 min−1.
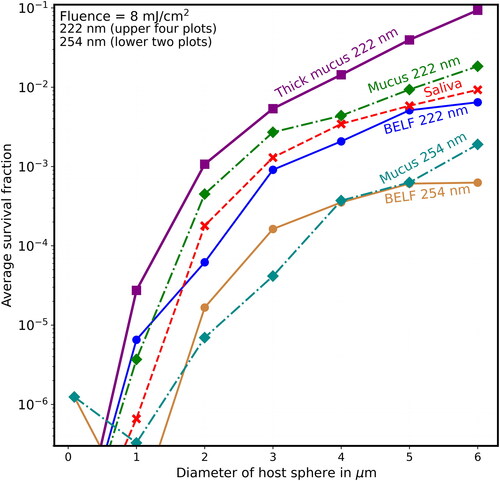
Figure 13. Average survival fractions (Sp) vs. diameter (µm) as in except that the lowest labeled value on the y-axis is 10−7, the highest labeled value on the y-axis is 10−2, and the fluence is 10 mJ/cm2, obtainable with 5 min of UV at the limit I222_eye_86m = 2 mJ cm−2 min−1.
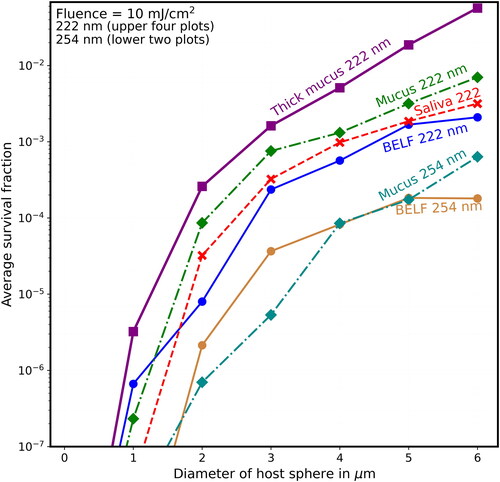
shows that when F = 8 mJ/cm2 (where, for the naked virion at 222 nm, S = 10−8, which is too low to be on scale), the Sp is almost 0.1 for virions in the thick-mucus 6-µm hosts. show that the Sp of the 5- and 6-µm particles decrease many times more slowly than do the Sp of host particles with d ≤ 2 µm.
4. Discussion
4.1. Main observations
4.1.1. Shielding increases as host diameters increase
For 222-nm UV light, shielding of viruses in host particles increases monotonically as diameters increase (illustrated in and for d = 1–6 µm), although the step from the naked virion to 1-µm host particles has overlapping survival fractions (Sp). That is, as host size increases, the survival fractions (Sp) increase for any given fluence. For 254-nm UV light, shielding of viruses in host particles increases as diameters increase (illustrated in for d = 1–6 µm). However, the Sp for the 1-µm host particles is smaller than the virus-without-host for . The Sp for the 2-µm host particles is smaller than the virus-without-host for mucus in , and for some of the fluences in for BELF and saliva. The smaller Sp for the 2-µm host particles at 254 nm likely because focusing within the host particle is a dominant effect when the particle size is sufficiently small relative the penetration depth.
4.1.2. In small particles exhaled in normal breathing the virions can be inactivated with relatively low UV fluence
For particles exhaled in normal breathing (where the peak particle numbers are near d∼1 µm and most particles have d < 2-µm (Johnson and Morawska Citation2009)), the most-similar particles modeled here are of BELF with d = 1 µm (). These particles have Sp ∼ 0.013 when F = 2 mJ/cm2, obtained in 1 min with I222_eye_86m = 2 mJ cm−2 min−1. The naked virion has Sp ∼ 0.01, and so the Sp ∼ 0.013 is within the range of uncertainties in modeling parameters.
4.1.3. In large particles emitted in speaking, inactivation of virions requires higher fluence
For particles generated in speaking (including singing and laughing), most of the emitted particle mass is in liquid droplets (Shen et al. Citation2022), primarily of saliva. These droplets dry to the particles we attempt to model in . For these particles generated in speaking, most of the mass is in particles that larger than the largest (5 and 6 µm) hosts modeled here. Most of the virions in such cases have been measured in <5-µm hosts (Lai et al. Citation2023). However, with measurable in virions in particles with diameter ≥5 µm (Lai et al. Citation2023), and with the better shielding from 222-nm UV in the ≥5-µm hosts, and with the possibility of infection (or initial infection) in the URT, such larger particles may be important in disease transmission.
4.1.4. Shielding is larger at 222 nm than at 254 nm
Virions in host particles are less shielded from UV at 254 nm ( and ) than at 222 nm. The shielding at 222 nm relative to that at 254 nm tends to increase with host particle size (). The increased shielding at 222 nm is primarly because the higher absorptivity at 222 nm reduces the fraction of UV that reaches the virions.
4.1.5. Higher eye-damage limits for UV at 222 nm (vs. 254 nm) allow larger F to be used
Because of the similarities in inactivation rate constants used (2.3 at 222 nm vs. 1.7 at 254 nm (Blatchley et al. Citation2023)) the doses required to achieve a specified Sp at 222 and 254 nm are similar for the smallest hosts. However, because the eye damage limit is 28.5 times higher at 222 nm (171.2 mJ/cm2) than at 254 nm (6 mJ/cm2), the times required for inactivation at 222 nm are many times smaller than are required at 254 nm if humans were not protected from the 254-nm UV. For example, for a 6-µm dried-saliva host particle at 222 nm, an Sp of 0.01 is obtained with F = 7.9 mJ/cm2 (), which can be obtained in 3.95 min. For the same 6-µm dried-saliva host at 254 nm, an Sp = 0.01 can be obtained with F = 6.9 mJ/cm2 (). The required fluences are similar. However, because the damage threshold is so low with 254-nm UV (I254_eye_86m = 0.0705 mJ cm−2 min−1) the time required using 254-nm UV would be 49 min and so eye protection is used.
4.1.6. Increases in UV can occur within small host spheres, especially when the penetration depth is large
For the largest penetration depths (i.e., δ = 29.6 µm for BELF and δ = 10 µm for mucus), both at 254 nm, the Sp for d = 2 µm hosts are lower than those for the naked virions for the majority of F illustrated in and . The decreases in Sp occur because focusing of the UV by the host sphere increases the intensity within much of the host. As the host size increases relative to the penetration depth, the UV is more attenuated before it reaches the virions, the UV distribution is more dominated by the absorption, and the Sp increases. For nonspherical, highly inhomogenous particles shown by Vejerano and Marr (Citation2017) at RH < approximatly 85%, such internal focusing is much less likely, and may be negligible for the particles illuminated from all orientations.
4.2. Uncertainties and limitations
4.2.1. Uncertainties in aerosol particle sizes that transmit various diseases
The importance of airborne particles of various sizes for transmission of specific diseases is not well understood in general, although much is known about transmission of influenza, TB, and covid-19. An improved understanding is needed for the size distributions of microbe-containing particles emitted (exhaled, spoken, etc.), the numbers of microbes-per-particle for different particle sizes (Milton et al. Citation2013), how these numbers vary with disease (Leung et al. Citation2020), and the likelihood of infection caused by inhalation of different sized particles when the deposit in different regions of the respiratory trace (see Section 1.2 above). Improved knowledge of such phenomena is needed for reducing disease transmission, including through improved modeling, designing, and using combined GUV and HVAC systems to optimize the inactivation of airborne microbes and to reduce airborne transmission of disease (Zhu et al. Citation2022; Wood et al. Citation2022; Peñaloza et al. Citation2023; Risbeck et al. Citation2021).
4.2.2. Compositions from reported values for respiratory-tract fluids and saliva
We assumed that the aerosolized particles have the compositions of fluids from the respiratory tract and oral cavity (saliva). Even if that assumption is valid, there are uncertainties in using the reported studies to estimate the compositions of materials (BELF, saliva, and normal and thick mucus) and their water fractions: How do the water contents of the airborne particles of specific materials vary with humidity? What are the overall mass fractions of the most UV-absorbing amino acids? What mass fraction of mucin is in N-acetyl sugars or sialic acids? What ranges of DNA and RNA concentrations exist in host-particle fluids, and how do they vary with disease state and immunological status? How much DNA or RNA in extracellular traps (e.g., NETS (Linssen et al. Citation2021)) appear in emitted particles? How does one take into account the varying compositions of lining fluids, and cells growing within them, as they vary from the alveoli to the nose or mouth? Which components of the RTLF are more readily aerosolized than others? Uncertainties in answers to these questions are significant. Even variations in the RTLF and saliva values can be large (e.g., Bicer, Citation2015; Edgar, Dawes, and D. O’Mullane Citation2012, table 1 and fig. 5.4). However, for a given assumed water content we think that the mi calculated based on reported values for BELF, mucus (normal or thick) or saliva, are unlikely to be more than 50% greater than, or 40% less than, typical mi for dried particles from those fluids. If the idealized particles we model here were exposed to higher RH (e.g., 65%) the water content of the particle would increase, the the mass of solids in the particle would not change, the concentrations of the UV absorbing molecules would decrease, and so the penetration depth would be a little larger.
4.2.3. Many if not all host particles are neither homogeneous nor spherical
Particles generated by aerosolizing human saliva, collecting the particles on a surperhydrophobic surface, and then letting their water content to come to equilibrium with the humidity of the air, were shown to be inhomogeneous and not perfectly spherical for RH < aproximately 85% (Vejerano and Marr Citation2017, fig. 2). The results were consistent with additional measurements for aerosolized artificial saliva (Vejerano and Marr Citation2017, figs. 4–6), and with measurements of Papineni and Rosenthal (Citation1997) for particles exhaled by persons and then collected onto a surface. There are uncertainties in how the results of the present calculations (homogeneous, spherical hosts) compare with actual, more-complex particles. Modeling more complex particles than those studied here is possible using the MSTM for spherical approximations of microbes within multi-layered particles with additional particles of varying sizes, compositions (e.g., NaCl or protein), and random positions inside or outside a primary sphere, so long as the boundaries of no two spheres intersect. For calculating the Qabs_i within more irregularly shaped particles having more complex inhomogeneities, example useful methods are the discrete dipole method (DDA or ADDA) (Yurkin and Hoekstra Citation2011) and finite-difference time-domain method (FDTD) (Sun and Fu Citation2000; Hill et al. Citation2001). In using such methods, scattering caused by inhomogeneities and surface roughness would likely reduce some of the focusing and resonance effects that can appear in spherical particles (even in radially varying spheres), and which may be related to the non-monotonic increases in Sp in .
4.2.4. Particles larger than those modeled here may be important for disease transmission
The largest particles modeled here have d = 6 µm. For the large particles emitted in speaking, the range of sizes of the resulting dried particles is approximately 5–20 µm and the large majority of the mass is in particles larger than 6 µm (Shen et al. Citation2022). All the figures in this article suggest that shielding continues to increase with particle size, as do the all-orientation results for 5- and 9-µm particles exposed to 260-nm UV in Hill, Mackowski, and Doughty (Citation2021, fig. 4).
4.2.5. Smaller ranges of illumination angles tend to increase Sp and this effect tends to increase with d
The host particles modeled here were illuminated from many randomly-chosen directions, to approximate equal illumination from all directions. However, host particles illuminated from only a few orientations with respect to the UV beam(s) tend to have Sp much larger than the Sp in particles illuminated from all-orientations, as illustrated for 1-, 5-, and 9-µm host spheres in Hill, Mackowski, and Doughty (Citation2021). In that study, the Sp decreased as the numbers of widely-spaced orientiation angles increased to essentially “all” orientations.
In many cases requiring modeling of airflows, UV intensities, and microbe-containing aerosols, the uncertainty in illumination orientations may be a large source of uncertainty in estimating survival fractions, especially for larger particles. For small (e.g., 1 µm) particles, Brownian rotational diffusion may result in illumination from many-orientations even if the particle is in a single UV beam, illuminated from one direction. Brownian rotational diffusion, however, is likely less able to approximate “all-orientation averaging” for larger (e.g., 6 or 20 µm) particles in the times considered here.
Turbulence can cause rotation and tumbling and thereby contribute to orientatation averaging. UV inactivation systems can use: multiple UV sources to illuminate airborne particles from widely separated directions, highly reflective surfaces (Rutala et al. Citation2013; Lindsley et al. Citation2018), and flows that increase rotational turbulence. However, if the inactivation systems do not illuminate particles with UV from sufficiently wide ranges of angles, the effects of that must be recognized.
4.2.6. Locations of virions within host particles could have large effects on survival fractions
The locations of virions in dried droplets are not known. We treat the problem as if the virions are randomly distributed throughout the particle. If the virions are mainly near the surface of the host sphere, the Sp in UV-illuminated hosts will be lower than if uniformly distributed. If the virions are predominantly near the center of any of the homogeneous host spheres considered here, their Sp likely will be larger.
4.2.7. Survival fractions of UV-exposed virions in host particles with diameters ≤ 2 µm
The dose required to achieve a 99% reduction in Sp for 2-µm hosts varies from F = 3.2 mJ cm−2 (, BELF) to F = 4.8 mJ cm−2 (, thick mucus). Using the 86-min maximum irradiance (I222_eye_86m = 2 mJ cm−2 min−1), those doses are achieved in 1.6–2.4 min. Thus, our impression is that for the large majority of particles generated by the BFFB mechanism in normal breathing where the generated particles are almost all with d ≤ 2 µm, the shielding of virions from 222-nm UV is not likely to be major problem.
5. Conclusions
The overall conclusion of this work is that the sizes and optical properties of the relevant microbe-containing particles need to be considered in designing and verifying systems which use UV to inactivate microbes in airborne particles. That may sound obvious, although we are not aware of reports of UV inactivation systems designed for and tested with various ranges of particle sizes, with some particle ranges >2 or 3 µm. The need to consider particle sizes and optical properties in using UV to inactivate airborne microbes is evidenced by three conclusions as follows.
The calculated penetration depths (δ) for 222-nm UV are in the range 1.82–0.8 µm for the approximations of the materials considered, all assumed to have dried in air to 15% water by mass. These δ were calculated using estimated compositions of dried-in-air droplets of saliva and RTLFs (i.e., BELF, mucus, and thick mucus), and the absorbances of their major UV-absorbing molecules. These penetration depths are in the range of, or smaller than, the ranges of sizes which are thought to transmit respiratory diseases, e.g., up to 4, or up to 20 µm, depending upon factors, such as the regions of the respiratory tract which can be infected. The calculated survival fractions (Sp) tend to increase as the absorptivity (and mi) of the host particles increase and as the penetration depths (δ) in the host material decrease.
When 222-nm UV illuminates the particles, the calculated survival fractions (Sp) increase with host diameter (d) for all fluences calculated, except for cases where the fluence is <2 mJ/cm2 and the host is dried saliva or BELF ( and ). In these small-particle cases, the Sp for the 1-µm host particles can be a little smaller than the survival fraction of the bare virions.
Shielding of virions in particles is larger with 222- as compared with 254-nm UV (see or see and and compare the curves for the naked virion and the 6-µm diameter host). The shielding of eyes is also larger at 222 nm and contributes to the threshold limit for human eyes being 28 times larger at 222 nm than at 254 nm.
Four caveats applying to this work are as follows.
We do not know the distributions of microbes and other materials within drying particles. Actual dried-in-air respiratory particles at RH < 85% are unlikely to be homogeneous or perfectly spherical.
We do not know the ranges of optical properties of particles of respiratory fluids or saliva, although we think the optical properties calculated here and used in calculations are within those ranges. Nor do we know how common it is for thick mucus to be aerosolized into particles which dry into, e.g., 5-µm particles.
We do not know how quickly particles of various sizes rotate and tumble as they respond to turbulent or other airflows and to Brownian diffusional forces. The calculated results shown here are for virions in host particles illuminated approximately uniformly from all directions. When the illumination is from one or a few directions, the survival fractions (Sp) can be many times higher (Hill, Mackowski, and Doughty 2022). Reductions in ranges of illumination angles may occur because of airflows, placement of UV sources, a short time of exposure to UV, and/or low-reflectivity surfaces within the room (Rutala et al. Citation2013). Decreases in rotation/tumbling because of decreases in Brownian rotational diffusion with increasing particle size may contribute to smaller ranges of illumination angles.
We do not know which particle sizes are most important for transmission of which diseases. Most particles released during normal breathing have d ≤ 2 µm (Johnson and Morawska Citation2009). Large particles emitted in speaking, singing, shouting, or coughing (Stadnytskyi, Anfinrud, and Bax Citation2021; Harrison et al. Citation2023; and Merhi et al. Citation2022), dry to particles largely in the 5–20-µm range at humidities less than about 65%. However, most virions in exhaled or spoken particles have been measured to be in host particles <5 µm (Milton et al. Citation2013; Lai et al. Citation2023). What is the cause of this inconsistency? Are there regions of the respiratory tract where the RTLF have relatively few virions per volume but are readily aerosolized in speaking, singing, etc., into large particles?
In situations where dried-droplet aerosol particles in the 5–20-µm size range are major contributors to the transmission of respiratory diseases (see Shen et al. Citation2022; Harrison et al. Citation2023), then the survival fractions illustrated here suggest that increased caution is likely needed in using small-particle (e.g., d ≤ 2 µm) UV-inactivation results to estimate the risk for larger particles (e.g., d between 3 and 20 µm). The calculations suggest that UV is less adequate for inactivating virions in 4–20-µm particles unless the UV dose is higher than needed to inactivate virions in the smaller particles. Testing with relevant microbes, compositions, and sizes would be needed.
More information on several of the above-listed unknowns/questions, along with modeling capabilities of such as those illustrated here, are likely to be useful in modeling (Zhu et al. Citation2022; Wood et al. Citation2022; Peñaloza et al. Citation2023) and designing of indoor spaces (e.g., buildings) and UV inactivation systems for them (Xu, Fisher, and Miller Citation2013; Won et al. Citation2023), and in developing procedures for their optimal use (Risbeck et al. Citation2021). Such capabilities likely can lead to reduced transmission of airborne diseases without using more energy than is necessary (Nardell Citation2016; ASHRAE Citation2019). Such designs can help achieve the simultaneous objectives of clean indoor air, reduced transmission of airborne microbial diseases (Morawska et al. Citation2021), energy-efficient buildings and vehicles, and reduced rates of greenhouse gas emissions (Allen et al. Citation2015; Baniassadi et al. Citation2022). Such systems can be useful in mitigating diseases caused by new microbes or new variant microbes. Deciding when to use UV or other methods for controlling microbes “should be based on a complete analysis that considers overall performance goals for air quality, impact on energy use and economic factors” (ASHRAE Citation2019). The modeling shown here suggest that shielding of microbes in host particles from UV should be accounted for in such analyses.
Supplemental Material
Download MS Word (1.5 MB)Acknowledgments
Hill and Doughty acknowledge partial support from DEVCOM ARL. All authors acknowledge partial support from the Defense Threat Reduction Agency.
Code availability
Researchers interested in the MSTM codes to calculate the Qabs for virions or other spheres inside of spheres can email D.W. Mackowski ([email protected]). Those interested in generating the input files used by the MSTM to generate the Qabs, i and Ri for the cases studied here, and in using these values to generate the Figures and/or Tables can email S. C. Hill or D. C. Doughty.
Disclosure statement
No potential conflict of interest was reported by the author(s).
Additional information
Funding
References
- ACGIH. 2023. TLVs and BEIs based on the documentation of the threshold limit values for chemical substances and physical agents and biological exposure indices. Cincinatti, OH: ACGIH. ISBN: 978-160-726157-5. 158–64.
- Allen, J. G., P. MacNaughton, J. G. C. Laurent, S. S. Flanigan, E. S. Eitland, and J. D. Spengler. 2015. Green buildings and health. Curr. Environ. Health Rep. 2 (3):250–8. doi: 10.1007/s40572-015-0063-y.
- Almstrand, A.-C., B. Bake, E. Ljungström, P. Larsson, A. Bredberg, E. Mirgorodskaya, and A.-C. Olin. 2010. Effect of airway opening on production of exhaled particles. J. Appl. Physiol. (1985) 108 (3):584–8. doi: 10.1152/japplphysiol.00873.2009.
- Almstrand, A.-C., M. Josefson, A. Bredberg, J. Lausmaa, P. Sjövall, P. Larsson, and A.-C. Olin. 2012. TOF-SIMS analysis of exhaled particles from patients with asthma and healthy controls. Eur. Respir. J. 39 (1):59–66. doi: 10.1183/09031936.00195610.
- Anderson, D. J., R. W. Moehring, D. J. Weber, S. S. Lewis, L. F. Chen, J. C. Schwab, P. Becherer, M. Blocker, P. F. Triplett, L. P. Knelson, et al. 2018. Effectiveness of targeted enhanced terminal room disinfection on hospital-wide acquisition and infection with multidrug-resistant organisms and Clostridium difficile: A secondary analysis of a multicentre cluster randomized controlled trial with crossover design (BETR Disinfection). Lancet. Infect. Dis. 18 (8):845–53. doi: 10.1016/S1473-3099(18)30278-0.
- Arcanjo, A., J. Logullo, C. C. B. Menezes, T. C. de Souza Carvalho Giangiarulo, M. C. Dos Reis, G. M. M. de Castro, Y. da Silva Fontes, A. R. Todeschini, L. Freire-de-Lima, D. Decoté-Ricardo, et al. 2020. The emerging role of neutrophil extracellular traps in severe acute respiratory syndrome coronavirus 2 (COVID‑19). Sci. Rep. 10 (1):19630. doi: 10.1038/s41598-020-76781-0.
- Asadi, S., A. S. Wexler, C. D. Cappa, S. Barreda, N. M. Bouvier, and W. D. Ristenpart. 2019. Aerosol emission and superemission during human speech increase with voice loudness. Sci. Rep. 9 (1):2348. doi: 10.1038/s41598-019-38808-z.
- ASHRAE. 2019. “Ultraviolet air and surface treatment,” Ch. 62. 2019 ASHRAE handbook-HVAC applications. Peachtree Corners, GA: ASHRAE.
- Baniassadi, A., J. Heusinger, P. I. Gonzalez, S. Weber, and H. W. Samuelson. 2022. Co-benefits of energy efficiency in residential buildings. Energy 238:121768. doi: 10.1016/j.energy.2021.121768.
- Bax, A., Y. Shen, Y. T. Kakeshpour, and K. P. Fennelly. 2022. Snoring may transmit infectious aerosols from the upper to the lower respiratory tract. Med. Hypotheses 168:110966. doi: 10.1016/j.mehy.2022.110966.
- Behndig, A. F., E. Mirgorodskaya, A. Blomberg, and A. C. Olin. 2019. Surfactant Protein A in particles in exhaled air (PExA), bronchial lavage and bronchial wash - a methodological comparison. Respir. Res. 20 (1):214. doi: 10.1186/s12931-019-1172-1.
- Bender, E. 2022. Safety is in the air. Nature 610 (7933):S46–S47. doi: 10.1038/d41586-022-03360-w.
- Bicer, E. M. 2015. Compositional characterisation of human respiratory tract lining fluids for the design of disease specific simulants. PhD diss., Kings College. https://kclpure kcl.ac.uk/portal/
- Blatchley, E. R., Ill, D. J. Brenner, H. Claus, T. E. Cowan, K. G. Linden, Y. Liu, T. Mao, S.-J. Park, P. J. Piper, R. M. Simons, et al. 2023. Far UV-C radiation: An emerging tool for pandemic control. Crit. Rev. Environ. Sci. Technol. 53 (6):733–53. doi: 10.1080/10643389.2022.2084315.
- Bredberg, A., J. Gobom, A.-C. Almstrand, P. Larsson, K. Blennow, A. C. Olin, and E. Mirgorodskaya. 2012. Exhaled endogenous particles contain lung proteins. Clin. Chem. 58 (2):431–40. doi: 10.1373/clinchem.2011.169235.
- Brice, B. A., and M. L. Swain. 1945. Ultraviolet absorption method for the determination of polyunsaturated constituents in fatty materials. J. Opt. Soc. Am. 35 (8):532–44. doi: 10.1364/JOSA.35.000532.
- Buonanno, M., B. Ponnaiya, D. Welch, M. Stanislauskas, G. Randers-Pehrson, L. Smilenov, F. D. Lowy, D. M. Owen, and D. J. Brenner. 2017. Germicidal efficacy and mammalian skin safety of 222-nm UV light. Radiat. Res. 187 (4):483–91. doi: 10.1667/RR0010CC.1.
- Buonanno, M., D. Welch, I. Shuryak, and D. J. Brenner. 2020. Far-UVC light (222 nm) efficiently and safely inactivates airborne human coronaviruses. Sci. Rep. 10 (1):10285. doi: 10.1038/s41598-020-67211-23.
- Chen, A., T. Wessler, K. Daftari, K. Hinton, R. C. Boucher, R. Pickles, R. Freeman, S. K. Lai, and M. G. Forest. 2022. Modeling insights into SARS-CoV-2 respiratory tract infections prior to immune protection. Biophys. J. 121 (9):1619–31. doi: 10.1016/j.bpj.2022.04.003.
- Chen, R. Z., S. A. Craik, and J. R. Bolton. 2009. Comparison of the action spectra and relative DNA absorbance spectra of microorganisms: Information important for the determination of germicidal fluence (UV dose) in an ultraviolet disinfection of water. Water Res. 43 (20):5087–96. doi: 10.1016/j.watres.2009.08.03296.
- Chowdhury, D. Q., P. W. Barber, and S. C. Hill. 1992. Energy-density distribution inside large non-absorbing spheres by using Mie theory and geometrical optics. Appl. Opt. 31 (18):3518–23. doi: 10.1364/AO.31.003518.
- Coleman, K. K., D. J. W. Tay, K. S. Tan, S. W. X. Ong, T. S. Than, M. H. Koh, Y. Q. Chin, H. Nasir, T. M. Mak, J. J. H. Chu, et al. 2022. Viral load of Severe Acute Respiratory Syndrome Coronavirus 2 (SARS-CoV-2) in respiratory aerosols emitted by patients with Coronavirus Disease 2019 (COVID-19) while breathing, talking, and singing. Clin. Infect. Dis. 74 (10):1722–8. doi: 10.1093/cid/ciab691.
- Dey, S., D. Sain, and S. Goswami. 2014. Naphthyridine based fluorescent receptors for the recognition of uric acid. RSC Adv. 4 (1):428–33. doi: 10.1039/C3RA45197F.
- Doughty, D. C., S. C. Hill, and D. W. Mackowski. 2021. Viruses such as SARS-CoV-2 can be partially shielded from UV radiation when in particles generated by sneezing or coughing: Numerical simulations. J. Quant. Spectrosc. Radiat. Transf. 262:107489. doi: 10.1016/j.jqsrt.2020.107489.
- Eadie, E., W. Hiwar, L. Fletcher, E. Tidswell, P. O'Mahoney, M. Buonanno, D. Welch, C. S. Adamson, D. J. Brenner, C. Noakes, et al. 2022. Far‑UVC (222 nm) efficiently inactivates an airborne pathogen in a room‑sized chamber. Sci. Rep. 12 (1):4373. doi: 10.1038/s41598-022-08462-z.
- Edgar, M., C. Dawes, and D. D. O’Mullane. 2012. Saliva and oral health. 4th ed. London: Stephen Hancocks, Ltd.; 2012. Table 1.2 and references therein, and Fig. 5.4.
- Evans, C. M., and J. S. Koo. 2009. Airway mucus: The good, the bad, the sticky. Pharmacol. Ther. 121 (3):332–48. doi: 10.1016/j.pharmthera.2008.11.001.
- Eversole, J. D., C. S. Scotto, M. B. Hart, J. Czege, J. S. Kesavan, V. K. Rastogi, D. R. McGrady, T. Ingersoll, J. B. Cabalo, S. C. Hill, et al. 2023. Prediction of aerosol viability from experiments on surfaces (PAVES): Program summary report, 142. NRL formal report, Naval Research Laboratory, Washington, DC.
- Fahy, J. V., and B. F. Dickey. 2010. Airway mucus function and dysfunction. N Engl. J. Med. 363 (23):2233–47. doi: 10.1056/NEJMra0910061.
- Fahy, J. V., D. J. Steiger, J. Liu, C. B. Basbaum, W. E. Finkbeiner, and H. A. Boushey. 1993. Markers of mucus secretion and DNA levels in induced sputum from asthmatic and from healthy subjects. Am. Rev. Respir. Dis. 147 (5):1132–7. doi: 10.1164/ajrccm/147.5.1132.
- Fennelly, K. P., J. W. Martyny, K. E. Fulton, I. M. Orme, D. M. Cave, and L. B. Heifets. 2004. Cough-generated aerosols of Mycobacterium tuberculosis a new method to study infectiousness. Am. J. Respir. Crit. Care Med. 169 (5):604–9. doi: 10.1164/rccm.200308-1101OC.
- Fischer, R. J., D. H. Morris, N. van Doremalen, S. Sarchette, M. J. Matson, T. Bushmaker, C. K. Yinda, S. N. Seifert, A. Gamble, B. N. Williamson, et al. 2020. Effectiveness of N95 respirator decontamination and reuse against SARS-CoV-2 virus. Emerg. Infect. Dis. 26 (9):2253–5. doi: 10.3201/eid2609.201524.
- Fisher, E. M., A. W. Richardson, S. D. Harpest, K. C. Hofacre, and R. E. Shaffer. 2012. Reaerosolization of MS2 bacteriophage from an N95 filtering facepiece respirator by simulated coughing. Ann. Occup. Hyg. 56 (3):315–25. doi: 10.1093/annhyg/mer101.
- Flatau, P. J., K. A. Fuller, and D. W. Mackowski. 1993. Scattering by two spheres in contact: Comparisons between discrete-dipole approximation and modal analysis. Appl. Opt. 32 (18):3302–5. doi: 10.1364/AO.32.003302.
- Fukui, T., T. Niikura, T. Oda, Y. Kumabe, H. Ohashi, M. Sasaki, T. Igarashi, M. Kunisada, N. Yamano, K. Oe, et al. 2020. Exploratory clinical trial on the safety and bactericidal effect of 222-nm ultraviolet C irradiation in healthy humans. PLoS One 15 (8):e0235948. doi: 10.1371/journal.pone.0235948.
- Geisler, T. S., M. V. Majji, J. S. Kesavan, V. J. Alstadt, E. S. G. Shaqfeh, and G. Iaccarino. 2019. Simulation of microparticle inhalation in rhesus monkey airways. Phys. Rev. Fluids 4 (8):083101. doi: 10.1103/PhysRevFluids.4.083101.
- Goldfarb, A. R. 1953. Absorption spectrum of the peptide bond: Influence of chain length. J. Biol. Chem. 201 (1):317–20. doi: 10.1016/S0021-9258(18)71372-0.
- Gregson, F. K. A., N. A. Watson, C. M. Orton, A. E. Haddrell, L. P. McCarthy, T. J. R. Finnie, N. Gent, G. C. Donaldson, P. L. Shah, J. D. Calder, et al. 2021. Comparing aerosol concentrations and particle size distributions generated by singing, speaking, and breathing. Aerosol Sci. Technol. 55 (6):681–91. doi: 10.1080/02786826.2021.188354.
- Haro, K., M. Ogawa, M. Saito, K. Kusuhara, and K. Fukuda. 2020. Bacterial composition of nasal discharge in children based on highly accurate 16S rRNA gene sequencing analysis. Sci. Rep. 10 (1):20193. doi: 10.1038/s41598-020-77271-z.
- Harrison, J., B. Saccente-Kennedy, C. M. Orton, L. P. McCarthy, J. Archer, H. E. Symons, A. Szczepanska, N. A. Watson, W. J. Browne, B. Moseley, et al. 2023. Emission rates, size distributions, and generation mechanism of oral respiratory droplets. Aerosol Sci. Technol. 57 (3):187–99. doi: 10.1080/02786826.2022.2158778.
- Hassoun, M., P. G. Royall, M. Parry, R. D. Harvey, and B. Forbes. 2018. Design and development of a biorelevant simulated human lung fluid. J. Drug Deliv. Sci. Technol. 47:485–91. doi: 10.1016/j.jddst.2018.08.006.
- Hawkins, G. R., I. Zipkin, and L. M. Marshall. 1963. Determination of uric acid, tyrosine, tryptophan, and protein in whole human parotid saliva by ultraviolet absorption spectrophotometry. J. Dent. Res. 42 (4):1015–22. doi: 10.1177/00220345630420040301.
- He, X. M., and D. C. Carter. 1992. Atomic structure and chemistry of human serum albumin. Nature 358 (6383):209–15. doi: 10.1038/358209a0.
- Heilingloh, C. S., U. W. Aufderhorst, L. Schipper, U. Dittmer, O. Witzke, D. Yang, X. Zheng, K. Sutter, M. Trilling, M. Alt, et al. 2020. Susceptibility of SARS-CoV-2 to UV irradiation. Am. J. Infect. Control. 48 (10):1273–5. doi: 10.1016/j.ajic.2020.07.031.
- Hessling, M., R. Haag, N. Sieber, and P. Vatter. 2021. The impact of far-UVC radiation (200–230 nm) on pathogens, cells, skin, and eyes – a collection and analysis of a hundred years of data. GMS Hyg. Infect. Control. 16:2196–5226. doi: 10.3205/dgkh000378.
- Hill, D. B., B. Button, M. Rubinstein, and R. C. Boucher. 2022. Physiology and pathology of human airway mucus. Physiol. Rev. 102 (4):1757–836. doi: 10.1152/physrev.00004.2021.
- Hill, D. B., P. A. Vasquez, J. Mellnik, S. A. McKinley, A. Vose, F. Mu, A. G. Henderson, S. H. Donaldson, N. E. Alexis, R. C. Boucher, et al. 2014. A biophysical basis for mucus solids concentration as a candidate biomarker for airways disease. PLoS One 9 (2):e87681. doi: 10.1371/journal.pone.0087681.
- Hill, S. C., D. C. Doughty, and D. W. Mackowski. 2022. Absorption of ultraviolet radiation in bacterial spores in clusters in air and on surfaces: Model calculations using the Multi-sphere T-Matrix Method. J. Quant. Spectrosc. Radiat. Transf. 293:108383. doi: 10.1016/j.jqsrt.2022.108383.
- Hill, S. C., D. C. Doughty, D. W. Mackowski, V. Rastogi, J. D. Eversole, D. McGrady, F. Handler, and J. Kesavan. 2023. Enhanced survival fractions of UV-irradiated spores in clusters on surfaces in air: Measured and mathematically modeled results at 254-nm. Aerosol Sci. Technol. 57:487–507. doi: 10.1080/02786826.2023.2186213.
- Hill, S. C., D. W. Mackowski, and D. C. Doughty. 2021. Shielding of viruses such as SARS-Cov-2 from ultraviolet radiation in particles generated by sneezing or coughing: Numerical simulations of survival fractions. J. Occup. Environ. Hyg. 18 (8):394–408. doi: 10.1080/15459624.2021.1939877.
- Hill, S. C., G. Videen, W. Sun, and Q. Fu. 2001. Scattering and internal fields of a microsphere that contains a saturable absorber: Finite-difference time-domain simulations. Appl. Opt. 40 (30):5487–94. doi: 10.1364/AO.40.005487.
- Hill, S. C., C. C. Williamson, D. C. Doughty, Y. L. Pan, J. L. Santarpia, and H. H. Hill. 2015. Size-dependent fluorescence of bioaerosols: Mathematical model using fluorescing and absorbing molecules in bacteria. J. Quant. Spectrosc. Radiat. Transf 157:54–70. doi: 10.1016/j.jqsrt.2015.01.011.
- Hou, Y. J., K. Okuda, C. E. Edwards, D. R. Martinez, T. Asakura, K. H. Dinnon, T. Kato, R. E. Lee, B. L. Yount, T. M. Mascenik, et al. 2020. SARS-CoV-2 reverse genetics reveals a variable infection gradient in the respiratory tract. Cell 182 (2):429–46.e14. doi: 10.1016/j.cell.2020.05.042.
- Huang, N., P. Pérez, T. Kato, Y. Mikami, K. Okuda, R. C. Gilmore, C. D. Conde, B. Gasmi, S. Stein, M. Beach, et al. 2021. SARS-CoV-2 infection of the oral cavity and saliva. Nat. Med. 27 (5):892–903. doi: 10.1038/s41591-021-01296-8.
- Hussain-Alkhateeb, L., B. Bake, M. Holm, O. Emilsson, E. Mirgorodskaya, and A.-C. Olin. 2021. Novel non-invasive particles in exhaled air method to explore the lining fluid of small airways—a European population-based cohort study. BMJ Open Resp. Res. 8 (1):e000804. doi: 10.1136/bmjresp-2020-000804.
- Jaffe, H. H., and M. Orchin. 1962. Theory and application of ultraviolet spectroscopy, 62–151181. New York, NY: John Wiley and Sons. ISBN-13 978–0471436744.
- Janssen, W. J., A. L. Stefanski, B. S. Bochner, and C. M. Evans. 2016. Control of lung defence by mucins and macrophages: Ancient defence mechanisms with modern functions. Eur. Respir. J. 48 (4):1201–14. doi: 10.1183/13993003.00120-2015.
- Johnson, G. R., and L. Morawska. 2009. The mechanism of breath aerosol formation. J. Aerosol Med. Pulm. Drug Deliv. 22 (3):229–37. doi: 10.1089/jamp.2008.0720.
- Kesavan, J., D. Schepers, J. Bottiger, and J. Edmonds. 2014. UV-C decontamination of aerosolized and surface-bound single spores and bioclusters. Aerosol Sci. Technol. 48 (4):450–7. doi: 10.1080/02786826.2014.889276.
- Konečná, B., A. Gaál Kovalčíková, A. Pančíková, B. Novák, E. Kovaľová, P. Celec, and Ľ. Tóthová. 2020. Salivary extracellular DNA and DNase activity in periodontitis. Appl. Sci. 10 (21):7490. doi: 10.3390/app10217490.
- Kowalski, W. 2009. Ultraviolet germicidal irradiation handbook: UVGI for air and surface disinfection. New York, NY: Springer. doi: 10.1007/978-3-642-01999-9.
- Kozlowski, L. P. 2016. Proteome-pl: Proteome isoelectric point. Nucleic Acids Res. 45 (D1):D1112–D1116. doi: 10.1093/nar/gkw978.
- Kratochvil, M. J., G. Kaber, S. Demirdjian, P. C. Cai, E. B. Burgener, N. Nagy, G. L. Barlow, M. Popescu, M. R. Nicolls, M. G. Ozawa, et al. 2022. Biochemical, biophysical, and immunological characterization of respiratory secretions in severe SARS-CoV-2 (COVID-19) infections. JCI Insight 7 (12):e152629. doi: 10.1172/jci.insight.152629.
- Kumar, A., W. Terakosolphan, M. Hassoun, K.-K. Vandera, A. Novicky, R. Harvey, P. G. Royall, E. M. Bicer, J. Eriksson, K. Edwards, et al. 2017. A biocompatible synthetic lung fluid based on human respiratory tract lining fluid composition. Pharm. Res. 34 (12):2454–65. doi: 10.1007/s11095-017-2169-4.
- Kushalnagar, P., C. C. Chow, and A. Bax. 2021. Self-infection with speech aerosol may contribute to COVID-19 severity. J. Intern. Med. 290 (6):1275–7. doi: 10.1111/joim.13370.
- Lachowicz-Scroggins, M. E., E. M. Dunican, A. R. Charbit, W. Raymond, M. R. Looney, M. C. Peters, E. D. Gordon, P. G. Woodruff, E. Lefrançais, B. R. Phillips, et al. 2019. Extracellular DNA, neutrophil extracellular traps, and inflammasome activation in severe asthma. Am. J. Respir. Crit. Care Med. 199 (9):1076–85. doi: 10.1164/rccm.201810-1869OC.
- Lai, J., K. K. Coleman, S. H S. Tai, J. German, F. Hong, B. Albert, Y. Esparza, A. K. Srikakulapu, M. Schanz, I. S. Maldonado, et al. 2023. Exhaled breath aerosol shedding of highly transmissible versus prior severe acute respiratory syndrome coronavirus 2 variants. Clin. Infect. Dis. 76 (5):786–94. doi: 10.1093/cid/ciac846.
- Larsson, P., B. Bake, A. Wallin, O. Hammar, A. C. Almstrand, M. Lärstad, E. Ljungström, E. Mirgorodskaya, and A. C. Olin. 2017. The effect of exhalation flow on endogenous particle emission and phospholipid composition. Respir. Physiol. Neurobiol. 243:39–46. doi: 10.1016/j.resp.2017.05.003.
- Larsson, P., M. Lärstad, B. Bake, O. Hammar, A. Bredberg, A. C. Almstrand, E. Mirgorodskaya, and A. C. Olin. 2015. Exhaled particles as markers of small airway inflammation in subjects with asthma. Clin. Physiol. Funct. Imaging 37 (5):489–97. doi: 10.1111/cpf.12323.
- Leung, N. H., D. K. W. Chu, E. Y. C. Shiu, K. H. Chan, J. J. McDevitt, B. J. P. Hau, H.-L. Yen, Y. Li, D. K. M. I. D. K., J. S. M. Peiris, W. H. Seto, et al. 2020. Respiratory virus shedding in exhaled breath and efficacy of face masks. Nat. Med. 26 (5):676–80. doi: 10.1038/s41591-020-0946-9org/10.1038/s41591-020-0843-2.
- Lindsley, W. G., T. L. McClelland, D. T. Neu, S. B. Martin, K. R. Mead, R. E. Thewlis, and J. D. Noti. 2018. Ambulance disinfection using Ultraviolet Germicidal Irradiation (UVGI): Effects of fixture location and surface reflectivity. J. Occup. Environ. Hyg. 15 (1):1–12. doi: 10.1080/15459624.2017.1376067.
- Linssen, R. S., G. Chai, J. Ma, A. B. Kummarapurugu, J. B. M. van Woensel, R. A. Bem, L. Kaler, G. A. Duncan, L. Zhou, B. K. Rubin, et al. 2021. Neutrophil extracellular traps increase airway mucus viscoelasticity and slow mucus particle transit. Am. J. Respir. Cell Mol. Biol. 64 (1):69–78. doi: 10.1165/rcmb.2020-0168OC.
- Liuzzo Scorpo, M., G. Ferrante, and S. La Grutta. 2021. An overview of asthma and COVID-19: Protective factors against SARS-COV-2 in pediatric patients. Front. Pediatr. 9:661206. doi: 10.3389/fped.2021.661206.
- Lu, J., J. Gu, K. Li, K. Xu, W. Su, Z. Lai, D. Zhou, C. Yu, B. Xu, and Z. Yang. 2020. COVID-19 outbreak associated with air conditioning in restaurant, Guangzhou, China, 2020. Emerg. Infect. Dis. 26 (7):1628–31. doi: 10.3201/eid2607.200764.
- Mackowski, D. W. 1991. Analysis of radiative scattering for multiple sphere configurations. Proc. R. Soc. Lond. Ser. A 433:599–614. doi: 10.1098/rspa.1991.0066.
- Mackowski, D. W. 2008. Exact solution for the scattering and absorption properties of sphere clusters on a plane surface. J. Quant. Spectrosc. Radiat. Transf. 109 (5):770–88. doi: 10.1016/j.jqsrt.2007.08.024.
- Mackowski, D. W. 2014. A general superposition solution for electromagnetic scattering by multiple spherical domains of optically active media. J. Quant. Spectrosc. Radiat. Transf. 133:264–70. doi: 10.1016/j.jqsrt.2013.08.012.
- Mackowski, D. W., and M. I. Mishchenko. 2011. A multiple sphere T-matrix Fortran code for use on parallel computer clusters. J. Quant. Spectrosc. Radiat. Transf. 112 (13):2182–92. doi: 10.1016/j.jqsrt.2011.02.019.
- Mackowski, D. W., and M. I. Mishchenko. 2013. Direct simulation of extinction in a slab of spherical particles. J. Quant. Spectrosc. Radiat. Transf. 109 (5):770–88. doi: 10.1016/j.jqsrt.2013.02.008.
- Matsui, H., M. W. Verghese, M. Kesimer, U. E. Schwab, S. H. Randell, J. K. Sheehan, B. R. Grubb, and R. C. Boucher. 2005. Reduced three-dimensional motility in dehydrated airway mucus prevents neutrophil capture and killing bacteria on airway epithelial surfaces. J. Immunol. 175 (2):1090–9. doi: 10.4049/jimmunol.175.2.1090.
- Merhi, T., O. Atasi, C. Coetsier, B. Lalanne, and K. Roger. 2022. Assessing suspension and infectivity times of virus-loaded aerosols involved in airborne transmission. Proc. Natl. Acad. Sci. USA. 119 (32):1–10. doi: 10.1073/pnas.2204593119.
- Miller, S. L., W. W. Nazaroff, J. L. Jimenez, A. Boerstra, G. Buonanno, S. J. Dancer, J. Kurnitski, L. C. Marr, L. Morawska, and C. Noakes. 2020. Transmission of SARS-CoV-2 by inhalation of respiratory aerosol in the Skagit Valley Chorale superspreading event. Indoor Air. 31 (2):314–23. doi: 10.1111/ina.12751.
- Milton, D. K., M. P. Fabian, B. J. Cowling, M. L. Grantham, and J. J. McDevitt. 2013. Influenza virus aerosols in human exhaled breath: Particle size, culturability, and effect of surgical masks. PLoS Pathog. 9 (3):e1003205. doi: 10.1371/journal.ppat.1003205.
- Morawska, L., J. Allen, W. Bahnfleth, P. M. Bluyssen, A. Boerstra, G. Buonanno, J. Cao, S. J. Dancer, A. Floto, F. Franchimon, et al. 2021. A paradigm shift to combat indoor respiratory infection. Science 372 (6543):689–91. doi: 10.1126/science.abg202.
- Morawska, L., G. Buonanno, A. Mikszewski, and L. Stabile. 2022. The physics of respiratory particle generation, fate in the air, and inhalation. Nat. Rev. Phys. 4 (11):723–34. doi: 10.1038/s42254-022-00506-7.
- Morawska, L., G. R. Johnson, Z. D. Ristovski, M. Hargreaves, K. Mengersen, S. Corbett, C. Y. H. Chao, Y. Li, and D. Katoshevski. 2009. Size distribution and sites of origin of droplets expelled from the human respiratory tract during expiratory activities. J. Aerosol Sci. 40 (3):256–69. doi: 10.1016/j.jaerosci.2008.11.002.
- Mphaphlele, M., A. S. Dharmadhikari, P. A. Jensen, S. N. Rudnick, T. H. van Reenen, M. A. Pagano, W. Leuschner, T. A. Sears, S. P. Milonova, M. van der Walt, et al. 2015. Institutional tuberculosis transmission controlled trial of upper room ultraviolet air disinfection: A basis for new dosing guidelines. Am. J. Respir. Crit. Care Med. 192 (4):477–84. doi: 10.1164/rccm.201501-0060OC.
- Nardell, E. A. 2016. Indoor environmental control of tuberculosis and other airborne infections. Indoor Air. 26 (1):79–87. doi: 10.1111/ina.12232.
- Nardell, E. A. 2021. Air disinfection for airborne infection control with a focus on COVID-19: Why Germicidal UV is essential. Photochem. Photobiol. 97 (3):493–7. doi: 10.1111/php.13421.
- Nardell, E. A., S. J. Bucher, P. W. Brickner, C. Wang, R. L. Vincent, K. Becan-McBride, M. A. James, M. Michael, and J. D. Wright. 2008. Safety of upper-room ultraviolet germicidal air disinfection for room occupants: Results from the tuberculosis ultraviolet shelter study. Public Health Rep. 123 (1):52–60. doi: 10.1177/003335490812300108.
- Nardell, E., P. Lederer, H. Mishra, R. Nathavitharana, and G. Theron. 2020. Cool but dangerous: How climate change is increasing the risk of airborne infections. Indoor Air. 30 (2):195–7. doi: 10.1111/ina.12608.
- Nasr, B., G. Ahmadi, A. R. Ferro, and S. Dhaniyala. 2019. Overview of mechanistic particle resuspension models: Comparison with compilation of experimental data. J. Adhes. Sci. Technol. 33 (24):2631–60. doi: 10.1080/01694243.2019.1650989.
- Okuda, K., G. Chen, D. B. Subramani, M. Wolf, R. C. Gilmore, T. Kato, G. Radicioni, M. Kesimer, M. Chua, H. Dang, et al. 2019. Localization of secretory mucins MUC5AC and MUC5B in normal/healthy human airways. Am. J. Respir. Crit. Care Med. 199 (6):715–27. doi: 10.1164/rccm.201804-0734OC.
- Pandit, P., J. Cooper-White, and C. Punyadeera. 2013. High-yield RNA-extraction method for saliva. Clin. Chem. 59 (7):1118–22. doi: 10.1373/clinchem.2012.197863.
- Papineni, R. S., and F. S. Rosenthal. 1997. The size distribution of droplets in the exhaled breath of healthy human subjects. J. Aerosol Med. 10 (2):105–16. doi: 10.1089/jam.1997.10.105.
- Park, S., R. Mistrick, and D. Rim. 2022. Performance of upper-room ultraviolet germicidal irradiation (UVGI) system in learning environments: Effects of ventilation rate, UV fluence rate, and UV radiating volume. Sustain. Cities Soc. 85:104048. doi: 10.1016/j.scs.2022.104048.
- Park, S., R. Mistrick, W. Sitzabee, and D. Rim. 2023. Effect of ventilation strategy on performance of upper-room ultraviolet germicidal irradiation (UVGI) system in a learning environments. Sci. Total Environ. 85:104048. doi: 10.1016/j.scs.2022.104048.
- Patton, J. S., and P. R. Byron. 2007. Inhaling medicines: Delivering drugs to the body through the lungs. Nat. Rev. Drug Discov. 6 (1):67–74. doi: 10.1038/nrd2153.
- Peñaloza, C. H., A. Wood, E. Eadie, C. Noakes, M. F. King, and K. Wood. 2023. Validated computational modelling to evaluate spatial inactivation of airborne pathogens by Far‐UVC irradiation. Photochem. Photobiol. 99:1502–1502. doi: 10.1111/php.13807.
- Péré, H., I. Podglajen, M. Wack, E. Flamarion, T. Mirault, G. Goudot, C. Hauw-Berlemont, L. Le, E. Caudron, S. Carrabin, et al. 2020. Nasal swab sampling for SARS-CoV-2: A convenient alternative in times of nasopharyngeal swab shortage. J. Clin. Microbiol. 58 (6):e00721-20. doi: 10.1128/JCM.00721-20.
- Pinto, A. L., R. K. Rai, J. C. Brown, P. Griffin, J. R. Edgar, J. Shah, A. Singanayagam, C. Hogg, W. S. Barclay, C. E. Futter, et al. 2022. Ultrastructural insight into SARS-CoV-2 entry and budding in human airway epithelium. Nat. Commun. 13 (1):1609. doi: 10.1038/s41467-022-29255-y.
- Poehls, U. G., C. C. Hack, A. B. Ekici, M. W. Beckmann, P. A. Fasching, M. Ruebner, and H. Huebner. 2018. Saliva samples as a source of DNA for high throughput genotyping: An acceptable and sufficient means in improvement of risk estimation throughout mammographic diagnostics. Eur. J. Med. Res. 23 (1):20. doi: 10.1186/s40001-018-0318-9.
- Pöhlker, M. L., C. Pöhlker, O. O. Krüger, J.D. Förster, T. Berkemeier, W. Elbert, J. Fröhlich-Nowoisky, U. Pöschl, G. Bagheri, E. Bodenschatz, et al. 2023. Respiratory aerosols and droplets in the transmission of infectious diseases. Rev. Mod. Phys. 95 (4):045001(49. doi: 10.1103/RevModPhys.95.045001.
- Pouwels, S. D., J. K. Burgess, E. Verschuuren, and D. J. Slebos. 2021. The cellular composition of the lung lining fluid gradually changes from bronchus to alveolus. Respir. Res. 22 (1):285. doi: 10.1186/s12931-021-01882-x.
- Reynolds, S. J., D. W. Black, S. S. Borin, G. Breuer, L. F. Burmeister, L. J. Fuortes, T. F. Smith, M. A. Stein, P. Subramanian, P. S. Thorne, and P. Whitten. 2001. Indoor environmental quality in six commercial office buildings in the midwest United States. Appl. Occup. Environ. Hyg. 16 (11):1065–77. doi: 10.1080/104732201753214170.
- Risbeck, M. J., M. Z. Bazant, Z. Jiang, Y. M. Lee, K. H. Drees, and J. D. Douglas. 2021. Modeling and multiobjective optimization of indoor airborne disease transmission risk and associated energy consumption for building HVAC systems. Energy Build. 253:111497. doi: 10.1016/j.enbuild.2021.111497.
- Roy, C. J., D. S. Reed, and J. A. Hutt. 2010. Aerobiology and inhalation exposure to biological select agents and toxins. Vet. Pathol. 47 (5):779–89. doi: 10.1177/0300985810378650.
- Rutala, W. A., M. F. Gergen, B. M. Tande, and D. J. Weber. 2013. Rapid hospital room decontamination using ultraviolet (UV) light with a nanostructured UV-reflective wall coating. Infect. Control Hosp. Epidemiol. 34 (5):527–9. doi: 10.1086/67021.
- Saidel, L. J., A. R. Goldfarb, and S. Waldman. 1952. The absorption spectra of amino acids in the region two hundred to two hundred and thirty millimicrons. J. Biol. Chem. 197 (1):285–91. doi: 10.1016/S0021-9258(18)55677-5.
- Sagripanti, J. L., and C. D. Lytle. 2011. Sensitivity to ultraviolet radiation of Lassa, vaccinia, and Ebola viruses dried on surfaces. Arch. Virol. 156 (3):489–94. doi: 10.1007/s00705-010-0847-1.
- Schuit, M., S. Gardner, S. Wood, K. Bower, G. Williams, D. Freeburger, and P. Dabisch. 2020. The influence of simulated sunlight on the inactivation of influenza virus in aerosols. J. Infect. Dis. 221 (3):372–8. doi: 10.1093/infdis/jiz582.
- Shen, Y., J. M. Courtney, P. Anfinrud, and A. Bax. 2022. Hybrid measurement of respiratory aerosol reveals a dominant coarse fraction resulting from speech that remains airborne for minutes. Proc. Natl. Acad. Sci. USA 119 (26):e2203086119. doi: 10.1073/pnas.2203086119.
- Sliney, D. H., and B. E. Stuck. 2021. A need to revise human exposure limits for ultraviolet UV-C radiation. Photochem. Photobiol. 97 (3):485–92. doi: 10.1111/php.13402.
- Srivastava, S., X. Zhao, Ati. Manay, and Q. Chen. 2021. Effective ventilation and air disinfection system for reducing coronavirus disease 2019 (COVID-19) infection risk in office buildings. Sustain. Cities Soc. 75:103408.doi: 10.1016/j.scs.2021.103408.
- Stadnytskyi, V., P. Anfinrud, and A. Bax. 2021. Breathing, speaking, coughing or sneezing: What drives transmission of SARS-CoV-2? J. Intern. Med. 290 (5):1010–27. doi: 10.1111/joim.13326.
- Stimson, M. M., and M. A. Reuter. 1943. Ultraviolet absorption spectra of nitrogenous heterocycles. VII. Effect of hydroxy substitutions on the ultraviolet absorption of the series: Hypoxanthine, xanthine and uric acid. J. Am. Chem. Soc. 65 (2):153–5. doi: 10.1021/ja01242a006.
- Sun, W., and Q. Fu. 2000. Finite-difference time-domain solution of light scattering by dielectric particles with large complex refractive indices. Appl. Opt. 39 (30):5569–78. doi: 10.1364/AO.39.005569.
- Thomas, R. J. 2013. Particle size and pathogenicity in the respiratory tract. Virulence. 4 (8):847–58. doi: 10.4161/viru.27172.
- Thornton, D. J., K. Rousseau, and M. A. McGuckin. 2008. Structure and function of the polymeric mucins in airways mucus. Annu. Rev. Physiol. 70 (1):459–86. doi: 10.1146/annurev.physiol.70.113006.100702.
- Tinglev, A. D., S. Ullah, G. Ljungkvist, E. Viklund, A. C. Olin, and O. Beck. 2016. Characterization of exhaled breath particles collected by an electret filter technique. J. Breath Res. 10 (2):026001. doi: 10.1088/1752-7155/10/2/026001.
- Vejerano, E. P., and L. C. Marr. 2017. Physico-chemical characteristics of evaporating respiratory fluid droplets. J. R Soc. Interface 15 (139):0939. doi: 10.1098/rsif.2017.0939.
- Veldhuizen, R., K. Nag, S. Orgeig, and F. Possmayer. 1998. The role of lipids in pulmonary surfactant. Biochim. Biophys. Acta. 1408 (2–3):90–108. doi: 10.1016/S0925-4439(98)00061-1.
- Verheyen, C. A., and L. Bourouiba. 2022. Associations between indoor relative humidity and global COVID-19 outcomes. J. R Soc. Interface 19 (196):20210865. doi: 10.1098/rsif.2021.0865.
- Weis, C. P., A. J. Intrepido, A. K. Miller, P. G. Cowin, M. A. Durno, J. S. Gebhardt, and R. Bull. 2002. Secondary aerosolization of viable Bacillus anthracis spores in a contaminated US Senate office. JAMA 288 (22):2853–8. doi: 10.1001/jama.288.22.2853.
- Welch, D., N. J. Kleiman, P. C. Arden, K. L. Kuryla, M. Buonanno, B. Ponnaiya, X. Wu, and D. J. Brenner. 2023. No evidence of induced skin cancer or other skin abnormalities after long-term (66 week) chronic exposure to 222-nm far-UVC radiation. Photochem. Photobiol. 99 (1):168–75. doi: 10.1111/php.13656.
- Wells, W. F., M. W. Wells, and T. S. Wilder. 1942. The environmental control of epidemic contagion. I. An epidemiologic study of radiant disinfection of air in day schools. Am J Hyg. 35 (1942):97–121.
- Wetlaufer, D. B. 1963. Ultraviolet spectra of proteins and amino acids. Adv. Protein Chem. 17:303–90. doi: 10.1016/S0065-3233(08)60056-X.
- Won, Y., D. Rim, R. Mistrick, and W. Bahnfleth. 2023. CFD modeling of room airflow effects on inactivation of aerosol SARS-CoV-2 by an upper-room ultraviolet germicidal irradiation (UVGI) system. Sci. Technol. Built Environ. 29 (7):719–29. doi: 10.1080/23744731.2023.2247947.
- Wood, K., A. Wood, C. Peñaloza, and E. Eadie. 2022. Turn up the lights, leave them on and shine them all around—numerical simulations point the way to more efficient use of far-UVC lights for the inactivation of airborne coronavirus. Photochem. Photobiol. 98 (2):471–83. doi: 10.1111/php.13523.
- Wyllie, A. L., J. Fournier, A. Casanovas-Massana, M. Campbell, M. Tokuyama, P. Vijayakumar, J. L. Warren, B. Geng, M. C. Muenker, A. J. Moore, et al. 2020. Saliva or nasopharyngeal swab specimens for detection of SARS-CoV-2. N Engl. J. Med. 383 (13):1283–6. doi: 10.1056/NEJMc2016359.
- Xu, P., N. Fisher, and S. L. Miller. 2013. Using computational fluid dynamics modeling to evaluate the design of hospital ultraviolet germicidal irradiation systems for inactivating airborne mycobacteria. Photochem. Photobiol. 89 (4):792–8. doi: 10.1111/php.12062.
- Yang, W., S. Elankumaran, and L. C. Marr. 2012. Relationship between humidity and influenza A viability in droplets and implications for influenza’s seasonality. PLoS One 7 (10):e46789. doi: 10.1371/journal.pone.0046789.
- Yousefi, S., D. Simon, D. Stojkov, A. Karsonova, A. Karaulov, and H. U. Simon. 2020. In vivo evidence for extracellular DNA trap formation. Cell Death Dis. 11 (4):300. doi: 10.1038/s41419-020-2497-x.
- Yurkin, M. A., and A. G. Hoekstra. 2011. The discrete-dipole-approximation code ADDA: Capabilities and known limitations. J. Quant. Spectrosc. Radiat. Transf. 112 (13):2234–47. doi: 10.1016/j.jqsrt.2011.01.031.
- Zhang, H., and A. C. K. Lai. 2022. Evaluation of single-pass disinfection performance of far-UVC light on airborne microorganisms in duct flows. Environ. Sci. Technol. 56 (24):17849–57. doi: 10.1021/acs.est.2c04861.
- Zhu, S., J. Srebric, S. N. Rudnick, R. L. Vincent, and E. A. Nardell. 2013. Numerical investigation of upper‐room UVGI disinfection efficacy in an environmental chamber with a ceiling fan. Photochem. Photobiol. 89 (4):782–91. doi: 10.1111/php.12039.
- Zhu, S., S. Jenkins, K. Addo, M. Heidarinejad, S. A. Romo, A. Layne, J. Ehizibolo, D. Dalgo, N. W. Mattise, F. Hong, et al. 2020. Ventilation and laboratory confirmed acute respiratory infection (ARI) rates in college residence halls in College Park, Maryland. Environ. Int. 137:105537. doi: 10.1016/j.envint.2020.105537.
- Zhu, S., T. Lin, L. Wang, E. A. Nardell, R. L. Vincent, and J. Srebric. 2022. Ceiling impact on air disinfection performance of Upper-Room Germicidal Ultraviolet (UR-GUV). Build. Environ. 224:109530. doi: 10.1016/j.buildenv.2022.109530.