
 ?Mathematical formulae have been encoded as MathML and are displayed in this HTML version using MathJax in order to improve their display. Uncheck the box to turn MathJax off. This feature requires Javascript. Click on a formula to zoom.
Abstract
Accurate theoretical calculations of particle deposition in a 90° bend rely on understanding its flow field characteristics. However, given the complexity of the flow patterns within the bend, most mathematical models utilize relatively simplified simulated flow fields. This study collected experimental data on aerosol particle losses in 90° bends, facilitating a clearer model selection. In addition, it also aimed to experimentally investigate the impact of expanding the cross-section of a bend and subsequently generalize these findings as design criteria. The results revealed that none of the models could accurately predict the experimental data concerning particles ranging from 1.4 to 10 μm in diameter and with 32 channels per decade sizing resolution. While the Reynolds number (Re) is a conventional metric for flow characterization, our study underscores the superior relevance of the Dean number (De) in bends due to centripetal force and secondary flow effects. Hence, a novel empirical equation was proposed after analyzing experimental data encompassing a De range of 1000 to 4200 and a Stokes number (Stk) range of 0.001 to 10. This equation solely relies on Stk to calculate the transport efficiency of particles in bends. In contrast, the model proposed by Pui et al. demonstrated a tendency to overestimate the transport efficiency of particles with Stk > 0.2 while underestimating the transport efficiency of particles with Stk < 0.2. Furthermore, extending the cross-section of the 90° bend by 0.2 times the bend diameter at the 45° position was shown to improve particles’ transport efficiency significantly.
Graphical abstract

Editor:
Introduction
Accurately determining the transport efficiency of aerosol particles as they traverse a curved passageway, such as pipe bends and lung bifurcations, holds critical significance across various applications. An illustrative example is using extractive-type continuous emission monitoring systems (CEMS) for measuring particulate matter (PM) concentrations in stack gas emissions. In such cases, incorporating at least one bend or other nozzle extension becomes necessary to ensure proper alignment between the suction flow direction of the sampling probe inlet and the flue flow (Wang et al. Citation2023; Zhu et al. Citation2018). This alignment is essential in fulfilling one of the isokinetic sampling requirements prescribed in Performance Specification 11 (PS11) by the United States Environmental Protection Agency (USEPA Citation2019). At a given sampling flow rate, larger particles exhibit higher inertia, resulting in decreased transport efficiency. Consequently, a more significant percentage of particles are deposited in the pipe bends, i.e., particle loss. The loss of particles in the bend leads to an underestimation of PM concentrations and impairs the representativeness of the results. According to a preliminary study (Wang Citation2019), the loss of 10 μm particles through a gooseneck sampling nozzle, as specified in the EN 13284 standard (European Union Citation2017), reached up to 75%.
Model development
To calculate the trajectories of particles accurately, defining the flow field at the bend is crucial. The differences between the defined flow field and real-world conditions must be small enough to ensure the accuracy and applicability of the model. Early theoretical calculations were conducted by assuming a parabolic flow (Landahl and Herrmann Citation1949) or a potential flow (Hacker, Brun, and Boyd Citation1953) within the bends. Yeh (Citation1974) developed a theoretical model based on the particle motion equation to predict particle inertial impaction deposition in the respiratory tract with a laminar flow field through heat and mass transfer analysis. Cheng and Wang (Citation1975) presented another expression to calculate particle loss in an idealized flow, neglecting secondary flow and assuming that fluid velocity depends solely on the distance from the tube wall. Subsequently, Cheng and Wang (Citation1981) proposed a new mathematical model that utilized laminar flow field velocity profiles developed by Mori (Citation1965). The model determined particle trajectories to calculate the particle transport efficiency, taking into account the effects of Reynolds number (Re), curvature ratio (CR), and Dean number (De).
The flow field in bends is highly complex due to oscillatory pressure gradients and the development of secondary flows (Boiron, Deplano, and Pelissier Citation2007; Eckmann and Grotberg Citation1988). Despite advancements in theoretical and mathematical models, accurately predicting particle trajectories in these complex flow fields remains challenging. Notably, a contribution was made by Crane and Evans (Citation1977), who studied particle trajectories in three-dimensional flows, which included the effects of secondary flows and centrifugal forces. The related predicted results were concluded to an empirical correlation by Yamano and Brockmann (Citation1989). Pui, Romay-Novas, and Liu (Citation1987) developed a model based on their experimental data for turbulent cases (Re = 6000 and 10,000) in a 5 mm diameter bend with a CR 5.7. This model has been widely used in aerosol-related textbooks (Hinds and Zhu Citation2022; Kulkarni, Baron, and Willeke Citation2011), modeling (Breuer, Baytekin, and Matida Citation2006; Vasquez, Walters, and Walters Citation2015; Wang et al. Citation2012; Wilson et al. Citation2011), sampler development (Sorooshian et al. Citation2006), and ventilation (Sun et al. Citation2013) studies. In addition, McFarland et al. (Citation1997) developed a model employing computational fluid dynamics (CFD) to predict particle transport and deposition in bends by considering the CR of the tube. The study encompassed Re ranging from 3200 to 19,800. However, the initial publication of their model contained some editing issues, which were rectified in later publications by Peters and Leith (Citation2004). In addition, Pilou et al. (Citation2011) used an Eulerian model to predict the particle transport efficiency in the laminar flow field. Besides, Inthavong (Citation2019) also employed CFD technology to develop a model in bends with CR more significant than 4 and Re > 1000. presents the models mentioned above that can be expressed using simplified equations.
Table 1. The prediction models for particles in bends.
Model comparison
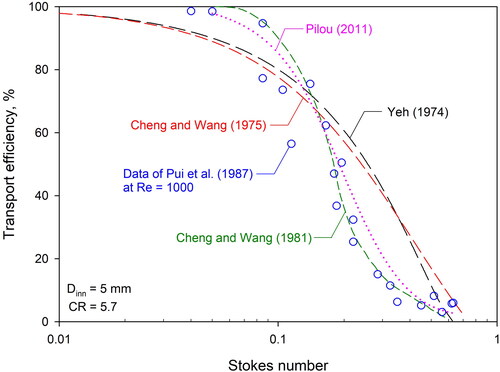
For the bend with Dinn = 5 mm and CR = 5.7, showed the transport efficiency versus Stokes curves calculated by various models for the laminar flow regime classified by Reynolds number. In addition, the figure included experimental data (represented by open symbols) obtained in a study conducted by Pui, Romay-Novas, and Liu (Citation1987), which provided a basis for comparison. Notably, the data aligned more closely with the calculated results of Cheng and Wang (Citation1981) model, which incorporated the fully developed laminar flow velocity profile proposed by Mori (Citation1965). However, it is essential to note that Mori (Citation1965)’s experiments had a De value of approximately 632 (>400), which is now recognized as indicative of a fully developed secondary flow. Consequently, it would be inappropriate to classify Cheng and Wang’s (Citation1981) model as solely applicable to the laminar region. Additionally, the prediction results obtained from the Eulerian model (Pilou et al. Citation2011) exhibit considerable similarity to Cheng and Wang (Citation1981)'s results. Regarding the remaining two models, simulating particle trajectories within an assumed laminar flow (Yeh Citation1974) or an idealized flow (Cheng and Wang Citation1975) can yield comparable predictions. However, it is crucial to highlight that these results significantly deviated from the experimental findings presented by Pui, Romay-Novas, and Liu (Citation1987).
Figure 1. The previous models in laminar cases (classified by Re).
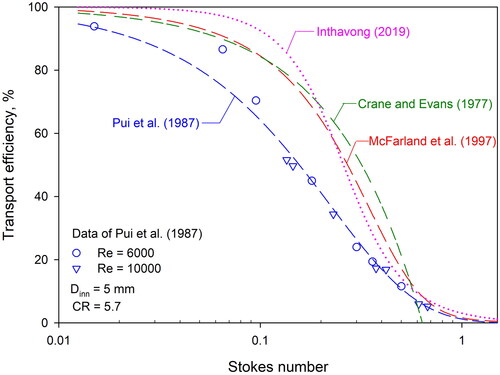
illustrates the transport efficiency of the bend (Dinn = 5 mm and CR = 5.7) versus Stokes for the case Re > 6000. The line curves are the numerical results from previous studies (Crane and Evans Citation1977; Inthavong Citation2019; McFarland et al. Citation1997) and a fitting of the data points published by Pui, Romay-Novas, and Liu (Citation1987) for the same case. The experimental data were higher than those predicted by the numerical models. Although Pui, Romay-Novas, and Liu (Citation1987)’s fitting curve matched well with their data points for Stk higher than 0.1, deviations were observed for data points with Stk = 0.065 and 0.095. The discrepancy was attributed to possible variations in inlet conditions and the use of the exponential form in Pui, Romay-Novas, and Liu (Citation1987)'s model, which resulted in a reduced weighting of transport efficiency for particles with low Stk during curve fitting (McFarland et al. Citation1997). Additionally, limited data resolution for particles with Stk < 0.1 is another issue that could affect the accuracy of curve fitting.
Figure 2. The previous models in turbulent cases (classified by Re).
Previous discussions on Dean number
In straight pipes, the Reynolds number is a convenient parameter to predict whether the fluid flow condition is laminar or turbulent, when considering inertial, pressure, and viscous effects. However, there are more parameters than those mentioned above that could govern the flow field properties within a bend. Therefore, relying on the Re alone may not provide a complete picture of the flow in this case. In a bend, centripetal forces cause the fluid to move away from the inner wall toward the outer wall, resulting in the development of a secondary flow perpendicular to the main flow direction (Berger, Talbot, and Yao Citation1983; Crowe et al. Citation2011; Elghobashi Citation1994; Saffman Citation1965; Sudarsan and Ugaz Citation2006). The strength of this secondary flow is characterized by the De, which represents the ratio of centripetal force to viscous force. It can also be expressed as the ratio of the Re to the square root of the CR (defined as the ratio of the radius of curvature of the centerline to the pipe radius). Studies on particle transport in bends have demonstrated that an increase in the De results in a more random and complex distribution of particles (Bhagat, Kuntaegowdanahalli, and Papautsky Citation2008; Sun and Lu Citation2013), a decrease in particle settling velocity (Lin, Lin, and Chen Citation2009) and a significant influence on the transport processes near the interface (Berrouk and Laurence Citation2008). Thus, the presence of the secondary flow mitigates particle loss induced by inertia and turbulence to some extent. Secondary flow significantly impacts the transport of particles in bends, making it essential to employ the Dean number when conducting research on bends to assess the development of secondary flows.
Experimental data on aerosol deposition in bends have been limited, with studies conducted across various Dean numbers. Pui, Romay-Novas, and Liu (Citation1987) conducted experiments at De from 40 to 4200. The bends’ secondary flow is considered fully developed when the De exceeds 400 (Ligrani Citation1994). McFarland et al. (Citation1997) provided data for De ranging from 2600 to 6300. Additionally, Sato, Chen, and Pui (Citation2003) investigated aerosol particle deposition in bends at low pressure and obtained experimental results within the De range of 1.8 to 2.2. Moreover, Yook and Pui (Citation2006) examined the penetration of particles sized 3–50 nm through coils under De ranging from 21 to 1779, revealing that particle loss was primarily influenced by secondary flow and Brownian diffusion. For various applications such as aerosol sampling, ventilation, and respiratory tract deposition, the De in bends typically exceeds 400, and particle deposition occurs due to inertia. Pui, Romay-Novas, and Liu (Citation1987) and McFarland et al. (Citation1997) conducted studies within this Dean number range. However, these two models do not consistently yield the same results under identical conditions, leading to ongoing discussions regarding the accuracy of their predictive capabilities.
As previously discussed, there is a general recognition that the flow field within a bend is three-dimensional and characterized by notable secondary flow. However, a comprehensive understanding of the intricate details of this flow field remains elusive. The latest generation of computational fluid dynamics (CFD) technology has significantly improved performance, cost-effectiveness, and computational efficiency. Consequently, modeling flow patterns and particle trajectories using CFD has become a convenient and practical tool for many applications. Nonetheless, it is crucial to validate the accuracy of computational results by comparing them with actual experimental data. Therefore, this study evaluated the efficiency of particle transport with high particle size resolution by a simple experimental method (Wang et al. Citation2022). The evaluation consisted of testing a series of elbows at different flow rates. The results obtained serve two purposes: to help clarify the choice of a suitable model and to provide a basis for developing new models when no suitable option is available. Furthermore, this study attempted to extend the cross-section at 45° of the 90° bend to investigate its feasibility for improving the efficiency of particle transport in the bend.
Methods
displays the schematic diagram of the experimental setup. A solution of di-ethyl-hexyl-sebacate (DEHS) dissolved in isopropanol (IPA) was fed by a syringe pump (KDS 200 P, KD Scientific Inc., Holliston, MA, USA) into an ultrasonic atomizing nozzle (Model 8700-120MS, Sono-TekCorporation, Poughkeepsie, NY, USA). The polydispersed droplets were initially generated by the atomizing nozzle, that converts high-frequency acoustic waves into mechanical energy and transfers it to the solution. The droplets were then neutralized by passing them through the aerosol neutralizer (radiative source, 25 mCi, Am-241), making aerosols a Boltzmann equilibrium state. The net charge on the aerosol particles was checked by an aerosol electrometer (model 3086 A, TSI Inc., Shoreview, MN, USA). The neutralized droplets were mixed with 80 L/min of filtered air to dry the solvent and obtain stable particle size distributions. The initial droplet size is about 18 μm. The final aerosol particles’ count median diameter (CMD) depends on the DEHS solution’s volume fraction.
Figure 3. Schematics of the experimental system.
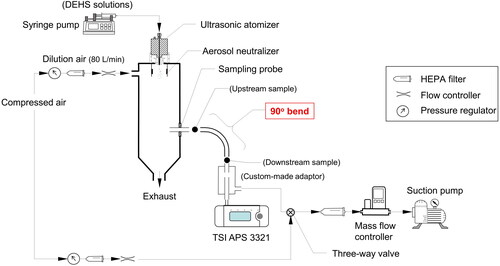
An aerodynamic particle sizer (APS, model 3321, TSI Inc.) was equipped to measure the particle size distribution and concentration. The APS counts individual particles separated by aerodynamic diameter at a size resolution of 32 channels per decade over the range of 0.5–20 μm. At a coincidence error of less than 10% for 10 µm particles, the upper limit of concentration measurement is 1000 particles/cm3 (TSI Inc. Citation2012). To correct the errors in measured aerodynamic size caused by droplet deformation in the APS (Baron et al. Citation2008; Baron Citation1986; Bartley et al. Citation2000; Griffiths, Iles, and Vaughan Citation1986), the calibration equation proposed by a previous study (Wang et al. Citation2022) was employed. In addition, the size-measuring accuracy of the APS was calibrated by polystyrene latex spheres (Duke Scientific Corporation, Palo Alto, CA, USA). Besides, a bubble meter (model Gilibrator-2 Calibrator, Sensidyne LP, St. Petersburg, FL, USA) was used to check APS's inner and outer nozzle flow rate before and after each test run.
To eliminate the influence of aspiration efficiency on the transport efficiency measurement results, a sampling probe with the same inner diameter as the measured bend and at least eight times the inner diameter in length was installed on the wall of the mixing chamber. Particle size distribution samples were taken in alternating order, with downstream samples taken when a bend was attached to the outlet of the sampling probe and upstream samples taken when the bend was not present. The transport efficiency value was calculated by dividing the particle concentration distribution of the downstream and upstream samples. A custom-made adapter was installed ahead of the APS's inlet. This modification enables the connection of a vacuum or air supply source, allowing for adjustment of the airflow rate through the bend while preserving the functionality of the APS. Both vacuum and supply airflow rates were controlled by mass flow controllers (MFC, model MC-Series, Alicat Scientific Inc., Tucson, AZ, USA). Each test was repeated at least five times. The bend under test was cleaned after every five runs.
The experimental parameters are listed in . The range of Dean numbers investigated in this study covered most of the aerosol sampling applications. All the bends in the current study were made by a photo-curing 3D printer (model Sonic 4K, Phrozen Technology, Hsinchu, Taiwan). To facilitate direct comparison with existing experimental data in the literature (Pui, Romay-Novas, and Liu Citation1987), an experiment was initially performed to investigate the transport efficiency of the bend, which had an inner diameter (Dinn) of 5 mm and CR = 5.7. The bend tubes in the previous study were made of glass and stainless steel. Tubes made from these two materials, as well as resin, can all be considered smooth tubes under the experimental test conditions in this study (Al-Dulaijan et al. Citation2022; Gad et al. Citation2022; Hilbert et al. Citation2003; Kandlikar, Joshi, and Tian Citation2003; Scotti et al. Citation2020). The experiments were conducted at Re = 6000 and 10,000, respectively. Next, bends with different Dinn (5, 10, and 15 mm) and CR (2 and 10) were designed and tested at different Re (1400–3500) in the present study to investigate the dependency of transport efficiency on the abovementioned parameters.
Table 2. Experimental parameters.
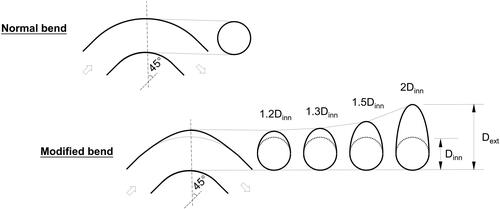
Furthermore, to reduce the loss of particles in the bend, modifications were made to the bends by increasing the inner diameter at the 45° position (Dext) without changing the inner diameter of the inlet and outlet. As depicted in , the inner curvature of the bend remained unchanged while the outer curvature expanded. The Dext varied from 1.2Dinn to 2.0Dinn. This modification would expect a decrease in the local airflow speed and an increase in the distance between particles and the wall. The characteristic length of the system for a particle passing through the bend was then lengthed.
Figure 4. Schematics of the bends with normal cross-section and extended cross-sections.
Results and discussion
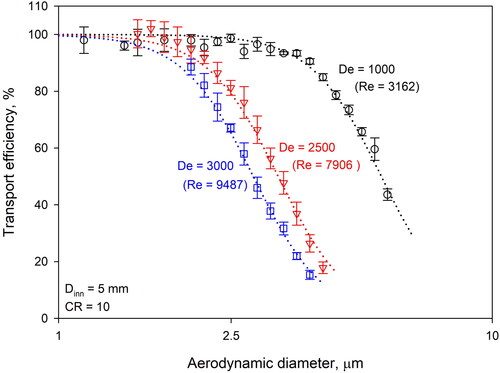
For a given Dinn and CR, the efficiency of particle transport through a bend is contingent upon particle size and airflow velocity. shows the measured transport efficiency curves for the bend (Dinn = 5 mm and CR = 10) as a function of the aerodynamic particle size. The transport efficiency diminishes with increasing particle size for a given De, which is directly linked to airflow velocity. Concurrently, the transport efficiency diminishes at a fixed particle size as De rises, and this decline becomes more prominent with larger particle sizes. Notably, for particles exceeding a few micrometers in diameter, inertial impaction emerges as the predominant deposition mechanism in the bends.
Figure 5. The effect of Dean number on particle transport efficiency.
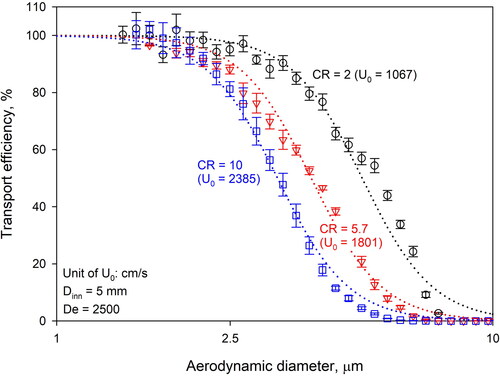
In , we examined how the curvature ratio (CR) affects the transport efficiency of particles of varying sizes at Dinn = 5 mm and De = 2500. Larger particles naturally exhibited lower transport efficiency under a given CR condition due to their higher inertia. Typically, particle deposition via inertial impaction increased in bends as the Stokes number raised, indicating a more abrupt curvature of streamlines with smaller CR. However, an intriguing observation in is that as CR decreased, the transport efficiency curve shifted toward larger particles, implying improved transport efficiency. This may seem counterintuitive, but it is essential to note that decreasing CR necessitates a reduction in airflow velocity within the bend, to maintain a constant De. Thus, the actual reason for the enhanced transport efficiency with decreasing CR is the reduced airflow velocity within the bend. As this trend aligns with airflow velocity changes, it suggests that, within the CR range of 2 to 10 and with a consistent flow pattern (De = 2500), CR may have a minimal impact on particle transport efficiency in bends. Nevertheless, increasing the curvature ratio has been proposed as a means to enhance particle transport efficiency in bends (McFarland et al. Citation1997).
Figure 6. The effect of Curvature ratio on particle transport efficiency.
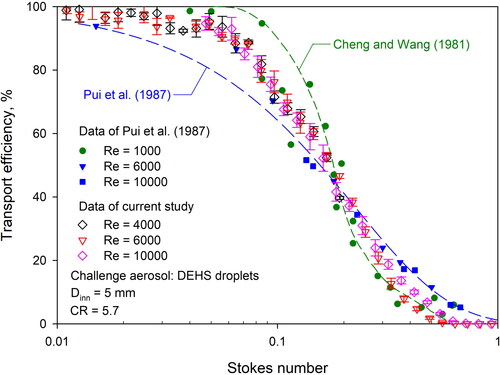
Building on the analysis and comparison of multiple models discussed in the Introduction session, the numerical model of Cheng and Wang (Citation1981) and the published results by Pui, Romay-Novas, and Liu (Citation1987) were chosen for further comparison and analysis with the experimental data obtained in the present study. As shown in , the experimental data of this study were in fair agreement with those of Pui, Romay-Novas, and Liu (Citation1987), except in the range of Stk > 0.3, where the transport efficiency of Pui, Romay-Novas, and Liu (Citation1987) 's data was slightly higher than those of this study. The results also showed that the model of Pui, Romay-Novas, and Liu (Citation1987) underpredicted the transport efficiency for Stk in the range of 0.02–0.2. The underestimation observed can be attributed to the limited number of data points available for Stk < 0.1, leading to less influence during the curve fitting process. Regarding the data trend, the experimental data of this study exhibited a remarkable consistency with the mean values obtained by averaging the results of the models of Pui, Romay-Novas, and Liu (Citation1987) and Cheng and Wang (Citation1981).
Figure 7. The comparison between current experimental data and previous literature.
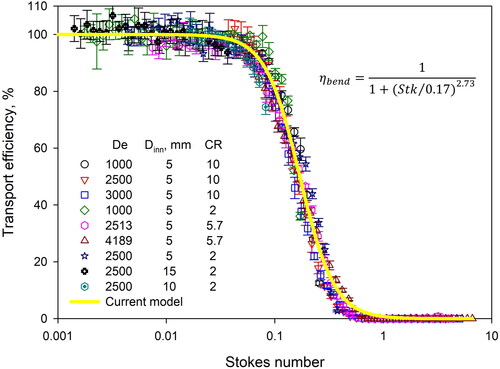
The results revealed that none of the models can accurately predict the experimental data of this study. Therefore, a series of transport efficiency experiments with combinations of De (1000–4189), Dinn (5–15 mm), and CR (2–10) were conducted. The results are presented in . The transport efficiency was independent of De, Dinn, and CR for the particles with the same Stk. Accordingly, an equation used to calculate the transport efficiency of bends was developed by curve fitting as follows:
Figure 8. The testing results under several bend conditions and the new-developed model.
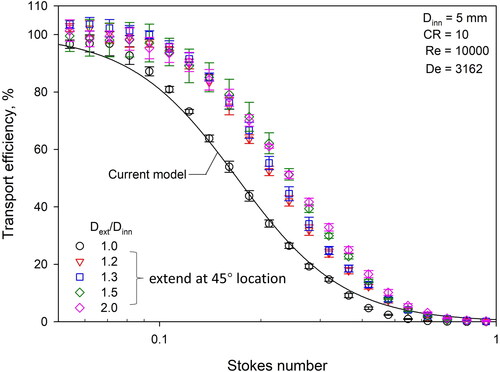
The impact of extending the bend diameter at the 45° position on transport efficiency is depicted in . The Dinn of the original bend is 5 mm, and the CR is 10. For De = 3162, the calculated data of the original bend matched the experimental data well. The results further indicated that the modified bends exhibited higher transport efficiencies than the original ones despite a mere 20% increase in diameter (Dext = 1.2 Dinn). Nevertheless, as Dext continued to increase (1.3–2.0 Dinn), the extent of improvement in transport efficiency remained relatively unchanged. While the discovery presents an intriguing aspect, it is not without its limitations. A comprehensive understanding of this phenomenon is yet to be achieved, pending further experimentation that includes a range of Dean numbers, tube diameters, and extension percentages.
Figure 9. The effect of extending the cross-section of a bend.
Conclusions
The present study comprehensively compared and validated various models for predicting particle transport efficiency in bends. It was observed that differentiating the flow field inside bends solely based on laminar and turbulent regimes is insufficient. However, when the De exceeds 400, a separate model can effectively predict transport efficiency. A series of experiments were conducted to develop a novel empirical prediction equation capable of accurately estimating particle transport efficiency within the Stokes number range of 0.001 to 10. Furthermore, the research revealed that, when considering particles with identical aerodynamic diameters, the effect of airflow velocity on transport efficiency is more pronounced compared to the influence of the tube curvature ratio. Additionally, at the tested experimental condition, outwardly extending the cross-section at the 45° position on a 90° bend enhanced particle transport efficiency, with an extension of 20% of the original inner diameter being the optimal choice for practical optimization.
Nomenclature
1. Curvature ratio (CR)
where
radius of curvature of the bend and
tube radius.
2. Reynolds number (Re):
where
fluid density; U: flow speed; L: characteristic length; and
dynamic viscosity of the fluid.
3. Dean number (De)
4. Stokes number (Stk)
where
relaxation time of particles;
particle density; and
particle diameter.
Disclosure statement
No potential conflict of interest was reported by the author(s).
Additional information
Funding
References
- Al-Dulaijan, Y. A., L. Alsulaimi, R. Alotaibi, A. Alboainain, H. Alalawi, S. Alshehri, S. Q. Khan, M. Alsaloum, H. S. AlRumaih, A. A. Alhumaidan, et al. 2022. Comparative evaluation of surface roughness and hardness of 3d printed resins. Materials 15 (19):6822. doi: 10.3390/ma15196822.
- Baron, P., G. J. Deye, A. B. Martinez, E. N. Jones, and J. S. Bennett. 2008. Size shifts in measurements of droplets with the aerodynamic particle sizer and the aerosizer. Aerosol Sci. Technol. 42 (3):201–9. doi: 10.1080/02786820801958734.
- Baron, P. A. 1986. Calibration and use of the aerodynamic particle sizer (aps 3300). Aerosol Sci. Technol. 5 (1):55–67. doi: 10.1080/02786828608959076.
- Bartley, D., A. Martinez, P. Baron, D. Secker, and E. Hirst. 2000. Droplet distortion in accelerating flow. J. Aerosol Sci. 31 (12):1447–60. doi: 10.1016/S0021-8502(00)00042-2.
- Berger, S. A., L. Talbot, and L. Yao. 1983. Flow in curved pipes. Annu. Rev. Fluid Mech. 15 (1):461–512. doi: 10.1146/annurev.fl.15.010183.002333.
- Berrouk, A. S., and D. Laurence. 2008. Stochastic modelling of aerosol deposition for les of 90 bend turbulent flow. Int. J. Heat Fluid Flow 29 (4):1010–28. doi: 10.1016/j.ijheatfluidflow.2008.02.010.
- Bhagat, A. A. S., S. S. Kuntaegowdanahalli, and I. Papautsky. 2008. Continuous particle separation in spiral microchannels using dean flows and differential migration. Lab Chip. 8 (11):1906–14. doi: 10.1039/b807107a.
- Boiron, O., V. Deplano, and R. Pelissier. 2007. Experimental and numerical studies on the starting effect on the secondary flow in a bend. J. Fluid Mech. 574:109–29. doi: 10.1017/S0022112006004149.
- Breuer, M., H. T. Baytekin, and E. A. Matida. 2006. Prediction of aerosol deposition in 90∘ bends using les and an efficient lagrangian tracking method. J. Aerosol Sci. 37 (11):1407–28. doi: 10.1016/j.jaerosci.2006.01.013.
- Cheng, Y-s, and C-s Wang. 1975. Inertial deposition of particles in a bend. J. Aerosol Sci. 6 (2):139–45. doi: 10.1016/0021-8502(75)90007-5.
- Cheng, Y.-S., and C. Wang. 1981. Motion of particles in bends of circular pipes. Atmos. Environ. (1967) 15 (3):301–6. doi: 10.1016/0004-6981(81)90032-9.
- Crane, R., and R. Evans. 1977. Inertial deposition of particles in a bent pipe. J. Aerosol Sci. 8 (3):161–70. doi: 10.1016/0021-8502(77)90003-9.
- Crowe, C. T., J. D. Schwarzkopf, M. Sommerfeld, and Y. Tsuji. 2011. Multiphase flows with droplets and particles. Boca Raton, FL: CRC Press.
- Eckmann, D. M., and J. B. Grotberg. 1988. Oscillatory flow and mass transport in a curved tube. J. Fluid Mech. 188:509–27. doi: 10.1017/S0022112088000825.
- Elghobashi, S. 1994. On predicting particle-laden turbulent flows. Appl. Sci. Res. 52 (4):309–29. doi: 10.1007/BF00936835.
- European Union. 2017. Stationary source emissions - determination of low range mass concentration of dust - part 1: Manual gravimetric method.
- Gad, M. M., S. M. Fouda, R. Abualsaud, F. A. Alshahrani, A. M. A. Thobity, S. Q. Khan, S. Akhtar, I. S. Ateeq, M. A. Helal, and F. A. Al‐Harbi. 2022. Strength and surface properties of a 3d‐printed denture base polymer. J. Prosthodont. 31 (5):412–8. doi: 10.1111/jopr.13413.
- Griffiths, W., P. Iles, and N. Vaughan. 1986. The behaviour of liquid droplet aerosols in an aps 3300. J. Aerosol Sci. 17 (6):921–30. doi: 10.1016/0021-8502(86)90018-2.
- Hacker, P. T., R. J. Brun, and B. Boyd. 1953. Impingement of droplets in 90° elbows with potential flow. NACA TN 2999:14.
- Hilbert, L. R., D. Bagge-Ravn, J. Kold, and L. Gram. 2003. Influence of surface roughness of stainless steel on microbial adhesion and corrosion resistance. Int. Biodeterior. Biodegrad. 52 (3):175–85. doi: 10.1016/S0964-8305(03)00104-5.
- Hinds, W. C., and Y. Zhu. 2022. Aerosol technology: Properties, behavior, and measurement of airborne particles. Hoboken, NJ: John Wiley & Sons.
- Inthavong, K. 2019. A unifying correlation for laminar particle deposition in 90-degree pipe bends. Powder Technol. 345:99–110. doi: 10.1016/j.powtec.2018.12.095.
- Kandlikar, S. G., S. Joshi, and S. Tian. 2003. Effect of surface roughness on heat transfer and fluid flow characteristics at low reynolds numbers in small diameter tubes. Heat Transfer Eng. 24 (3):4–16. doi: 10.1080/01457630304069.
- Kulkarni, P., P. A. Baron, and K. Willeke. 2011. Aerosol measurement: Principles, techniques, and applications. Hoboken, NJ: John Wiley & Sons.
- Landahl, H., and R. Herrmann. 1949. Sampling of liquid aerosols by wires, cylinders, and slides, and the efficiency of impaction of the droplets. J. Colloid Sci. 4 (2):103–36. doi: 10.1016/0095-8522(49)90038-0.
- Ligrani, P. M. 1994. A study of dean vortex development and structure in a curved rectangular channel with aspect ratio of 40 at dean numbers up to 430: NASA.
- Lin, J., P. Lin, and H. Chen. 2009. Research on the transport and deposition of nanoparticles in a rotating curved pipe. Phys. Fluids 21 (12):122001. doi: 10.1063/1.3264110.
- McFarland, A. R., H. Gong, A. Muyshondt, W. Wente, and N. Anand. 1997. Aerosol deposition in bends with turbulent flow. Environ. Sci. Technol. 31 (12):3371–7. doi: 10.1021/es960975c.
- Mori, Y. 1965. Study on forced convective heat transfer in curved pipes-1. Laminar region. Int. J. Heat Mass Transfer 8:67–82.
- Peters, T. M., and D. Leith. 2004. Particle deposition in industrial duct bends. Ann. Occup. Hyg. 48 (5):483–90.
- Pilou, M., S. Tsangaris, P. Neofytou, C. Housiadas, and Y. Drossinos. 2011. Inertial particle deposition in a 90 laminar flow bend: An eulerian fluid particle approach. Aerosol Sci. Technol. 45 (11):1376–87. doi: 10.1080/02786826.2011.596171.
- Pui, D. Y., F. Romay-Novas, and B. Y. Liu. 1987. Experimental study of particle deposition in bends of circular cross section. Aerosol Sci. Technol. 7 (3):301–15. doi: 10.1080/02786828708959166.
- Saffman, P. G. 1965. The lift on a small sphere in a slow shear flow. J. Fluid Mech. 22 (2):385–400. doi: 10.1017/S0022112065000824.
- Sato, S., D.-R. Chen, and D. Y. Pui. 2003. Particle transport at low pressure: Deposition in bends of a circular cross-section. Aerosol Sci. Technol. 37 (10):770–9. doi: 10.1080/02786820300911.
- Scotti, C. K., M. M. d A. C. Velo, F. A. P. Rizzante, T. R. de Lima Nascimento, R. F. L. Mondelli, and J. F. S. Bombonatti. 2020. Physical and surface properties of a 3d-printed composite resin for a digital workflow. J. Prosthet. Dent. 124 (5):e611–614. e615. doi: 10.1016/j.prosdent.2020.03.029.
- Sorooshian, A., F. J. Brechtel, Y. Ma, R. J. Weber, A. Corless, R. C. Flagan, and J. H. Seinfeld. 2006. Modeling and characterization of a particle-into-liquid sampler (pils). Aerosol Sci. Technol. 40 (6):396–409. doi: 10.1080/02786820600632282.
- Sudarsan, A. P., and V. M. Ugaz. 2006. Multivortex micromixing. Proc. Natl. Acad. Sci. U. S. A. 103 (19):7228–33. doi: 10.1073/pnas.0507976103.
- Sun, K., and L. Lu. 2013. Particle flow behavior of distribution and deposition throughout 90 bends: Analysis of influencing factors. J. Aerosol Sci. 65:26–41. doi: 10.1016/j.jaerosci.2013.07.002.
- Sun, K., L. Lu, H. Jiang, and H. Jin. 2013. Experimental study of solid particle deposition in 90 ventilated bends of rectangular cross section with turbulent flow. Aerosol Sci. Technol. 47 (2):115–24. doi: 10.1080/02786826.2012.731094.
- TSI Inc. 2012. Model 3321 aerodynamic particle sizer spectrometer. Operation and service manual.
- USEPA. 2019. Performance specification 11 - specifications and test procedures for particulate matter continuous emission monitoring systems at stationary sources The United States
- Vasquez, E. S., K. B. Walters, and D. K. Walters. 2015. Analysis of particle transport and deposition of micron-sized particles in a 90 bend using a two-fluid eulerian–eulerian approach. Aerosol Sci. Technol. 49 (9):692–704. doi: 10.1080/02786826.2015.1062466.
- Wang, S. 2019. Optimal design of sampling train for extractive pm cems. In Institute of Occupational Medicine and Industrial Hygiene. Taipei, Taiwan: National Taiwan University.
- Wang, S., Y.-M. Kuo, C.-W. Lin, S.-H. Huang, and C.-C. Chen. 2023. Development of a sampling assembly for pm2. 5 cems. J. Aerosol Sci. 174:106244. doi: 10.1016/j.jaerosci.2023.106244.
- Wang, S., Y.-M. Kuo, C.-W. Lin, S.-H. Huang, B. Fu, Q. Zhang, and C.-C. Chen. 2022. A simple method for aerosol transport efficiency tests in sampling tubes. Aerosol Air Qual. Res. 22 (11):220219. doi: 10.4209/aaqr.220219.
- Wang, X., J. Watson, J. Chow, S. Kohl, L.-W. Chen, D. Sodeman, A. Legge, and K. Percy. 2012. Measurement of real-world stack emissions with a dilution sampling system. Dev. Environ. Sci. 11:171–92.
- Wilson, S. R., Y. Liu, E. A. Matida, and M. R. Johnson. 2011. Aerosol deposition measurements as a function of reynolds number for turbulent flow in a ninety-degree pipe bend. Aerosol Sci. Technol. 45 (3):364–75. doi: 10.1080/02786826.2010.538092.
- Yamano, N, and J. Brockmann. 1989. Aerosol sampling and transport efficiency calculation (astec) and application to surtsey/dch aerosol sampling system: Code version 1. 0: Code description and user’s manual. Nuclear Regulatory Commission, Washington, DC (USA). Div. of Systems.
- Yeh, H.-C. 1974. Use of a heat transfer analogy for a mathematical model of respiratory tract deposition. Bull. Math. Biol. 36:105–16. doi: 10.1016/S0092-8240(74)80014-5.
- Yook, S.-J., and D. Y. Pui. 2006. Experimental study of nanoparticle penetration efficiency through coils of circular cross-sections. Aerosol Sci. Technol. 40 (6):456–62. doi: 10.1080/02786820600660895.
- Zhu, R., Y. Zhang, Y. Yuan, and S. Li. 2018. Deposition loss of particles in the sampling lines of continuous emission monitoring system (cems) in coal-fired power plants. Aerosol Air Qual. Res. 18 (6):1483–92. doi: 10.4209/aaqr.2017.11.0523.