
 ?Mathematical formulae have been encoded as MathML and are displayed in this HTML version using MathJax in order to improve their display. Uncheck the box to turn MathJax off. This feature requires Javascript. Click on a formula to zoom.
Abstract
The stability of nanoparticle (NP) production by atmospheric-pressure spark ablation was studied and found to depend on the composition of the electrodes and the carrier gas (here N2 or Ar). For materials that do not react with N2, such as Pd and Ni, NP production was rather stable regardless of the carrier gas employed. In contrast, for materials that can easily produce nitride species (e.g., Al and Mg), both the concentration and size of the resulting NPs exhibited noticeable fluctuations, when ablating them in N2, which are more pronounced when the electrical energy input to the system is low. The variation in concentration and particle size is attributed to the formation of a metal-nitride region on the face of the electrodes where the sparks hit, as a result of its reaction with the carrier gas, altering the electrical and thermal conductivity, and consequently the ablatability of the electrode at that region. This explanation was corroborated by offline analysis of the face surface of the electrodes, showing two chemically distinct regions: one with high content of N and one without. In addition, the concentration of the Al and Mg NPs produced in N2 decreased gradually over time until it reached a plateau after several hours. When using Ar, the fluctuation and decreasing trend in NP production, and consequently the formation of nitride compounds on the face surface of the electrodes, were negligible, providing an effective solution for stable ablation of materials that can easily react with N2.
Graphical abstract
EDITOR:
1. Introduction
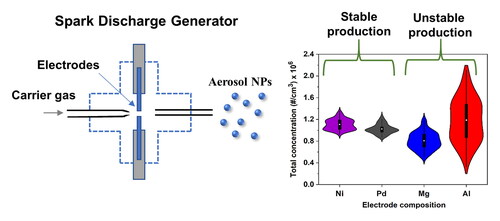
Spark ablation is a gas-phase synthesis method for generating nanoparticles (NPs) from conductive materials in the form of electrodes (Schmidt-Ott Citation2020). The method was originally introduced by Schwyn et al. (Citation1988), and has been employed for the synthesis of catalytic (Lu et al. Citation2020; Wondergem et al. Citation2020; Sapountzi et al. Citation2022), sensing (Isaac et al. Citation2015; Efimov et al. Citation2016a; Isaac et al. Citation2016; Kohut et al. Citation2020), and photovoltaic (Jang et al. Citation2016) nanomaterials, among others. The process relies on spark discharges forming a plasma between two conductive electrodes, heating them up and consequently evaporating small amounts of the material they consist of. Τhe resulting vapors are subsequently quenched and carried away by a gas flow, forming NPs upon nucleation and growth.
Spark ablation can produce NPs over a wide size range: i.e., from that of clusters of a few atoms (Maisser et al. Citation2015) and singlets having diameters up to several nanometers (Feng et al. Citation2015), to agglomerated structures of several tens or hundreds nanometers (Meuller et al. Citation2012). A great advantage of the technique is that it provides good control over the size and composition of the resulting NPs in a simple, inexpensive, and environmentally friendly manner because no chemical precursors are required and no wastes are produced. Spark ablation can produce mixed NPs at the atomic and the nanometer scales. Mixing at the atomic scale can be achieved using one spark discharge generator (SDG) and alloyed electrodes, or two electrodes of different elements (Tabrizi et al. Citation2009, Citation2010; Anastasopol et al. Citation2013; Muntean et al. Citation2016; Kohut et al. Citation2020; Petallidou et al. Citation2023). Mixing at the nanometer scale can be achieved by using two SDGs in series or in parallel (Vons et al. Citation2011), or, under specific conditions, one SDG and two electrodes of different elements that are immiscible, such as Cu and Ag (Snellman et al. Citation2021; Villy et al. Citation2022). One limiting factor of spark ablation has been its relatively low throughput; i.e., the mass of the produced NPs per unit time. Increasing the throughput of spark ablation to scale up the process can be achieved by high-frequency sparking (Feng et al. Citation2016), running multiple units in parallel, or using multiple pairs of electrodes in one chamber (Efimov et al. Citation2016b).
In principle, the composition of the NPs produced by spark ablation is the same as that of the electrodes employed in the process. As shown by a number of reports (Vons et al. Citation2011; Hallberg et al. Citation2018; Preger et al. Citation2019; Němec et al. Citation2020; Efimov et al. Citation2021), trace amounts of O2 or H2O in the carrier gas can alter the composition of the NPs by oxidising them in part or fully. Considering that trace amounts of O2 present in any gas bottle can oxidize the resulting NPs, one can introduce small amounts of H2 in the carrier gas in order to produce them in their pure metal form, as has been demonstrated recently by Preger et al. (Citation2019) and Ternero et al. (Citation2023).
The carrier gas can also react with the electrodes, and thus alter their composition. For example, the presence of oxygen in the carrier gas can oxidize the surface of the metal electrodes, and consequently alter their ablatability (i.e., a property that indicates the ability of the material to ablate), which can in principle affect the performance of the SDG in terms of its production throughput. Similarly, nitriding (i.e., a surface hardening process whereby atomic nitrogen diffuses into a metal, leading to the formation of a metal nitride layer) of the electrode surface can in principle happen when employing N2 as a carrier gas. We should note here that the terms nitriding and nitridation are interchangeably employed in the literature, with the first being related to the metal surface hardening process described above, and the second, more generally, to the reaction of nitrogen with any substance. In either case, nitriding/nitridation is likely to happen during spark ablation considering that molecular nitrogen can brake up to atomic nitrogen in the discharge plasma, and thus can more effectively interact with the metal electrodes and/or any atom or molecule present in the gas phase.
Here we investigate the stability of spark ablation when ablating electrodes that can easily nitridate. We select two materials that can react with N2 (i.e., Al and Mg) and can form metal nitrides (Dupré and Streiff 1970; Chen et al. Citation1994), and two that are much less prone to nitriding (i.e., Ni and Pd). The electrodes were ablated under different conditions in a SDG over several hours, and analyzed using offline techniques. To the best of our knowledge, this is the first time that the reactivity of different combinations of electrode materials and carrier gases used in spark ablation, and its effect on the stability of NP production, is reported.
2. Experimental
For all the measurements reported in this study, we used a commercial SDG (VSParticle Model G1) with high purity rods (99.95% for Al, 99.99% for Ni, 99.9% for Mg, 99.95% for Pd) having diameters of 3 mm. Prior to each experiment, the electrodes were cleaned with sandpaper and acetone to remove impurities from their surface. The carrier gases (Ar or N2, 99.999% purity) were further purified downstream the bottles by passing them through an oxygen and moisture-removal trap (Agilent, Part No. CP17970).
Three combinations of experimental conditions (cf. ) were employed in order to investigate whether the energy per spark and/or the flow rate had any effect on the production stability of the NPs from the SDG. In the first combination of conditions (reference or low-energy/high-flow conditions), the gas flow rate was set at 6 L/min, whereas the voltage V to 0.5 kV, and the capacitance C to 20 nF. This led to an energy per spark of 5.6 mJ, determined as where
is the discharge voltage that was empirically determined to be 1.5 times the set voltage V; i.e.,
(cf. Figure S1 in the Supplementary Information; SI). In the second case (high-energy/high-flow conditions), the gas flow rate was kept at 6 L/min, but the energy per spark was increased to 22.5 mJ by setting V to 1.0 kV and C to 20 nF, whereas in the third case (high-energy/low-flow conditions), the flow rate was reduced to 2 L/min while maintaining the energy per spark to 22.5 mJ using the same voltage and capacitance as in the second case. In all cases, the sparking frequency was set to 100 Hz.
Table 1. Experimental conditions employed for all the experiments reported in this work. In all cases the capacitance was 20 nF and the sparking frequency 100 Hz.
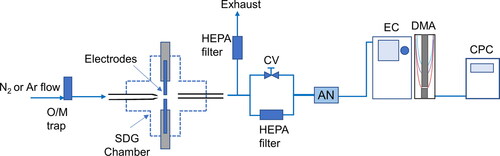
A Scanning Mobility Particle Sizer (SMPS) comprised of a Differential Mobility Analyzer (DMA; TSI, Model 3081) connected to an 241Am Aerosol Neutralizer (GRIMM, Model 5.522), an electrostatic classifier (TSI Model 3080), and an ultrafine water-based Condensation Particle Counter (CPC; TSI, Model 3786), was used to measure the size distributions of NPs produced by the SDG (cf. ). The SMPS scans were carried out over periods of 3 min for the entire course of the experiments that lasted several hours, whereas the voltage on the DMA was scanned from 0.01 to 9.95 kV, allowing the SMPS to record NP size distributions in the range of 7–305 nm. In all the measurements, the aerosol and sheath flow through the DMA were set to 0.6 and 6.0 L/min, respectively.
Figure 1. Schematic layout of the experimental setup used in all the measurements to determine the stability of the SDG. Key: O/M trap: oxygen and moisture trap; SDG: spark discharge generator; CV: flow control valve; AN: aerosol neutralizer; EC: electrostatic classifier; DMA: differential mobility analyzer; CPC: condensation particle counter.
To investigate the surface of the face of the Al electrodes through microscopy and x-ray diffraction (XRD), we used removable disks having a diameter of 5.0 mm and a thickness of 0.75 mm (purity: 99.999%) attached to a cylindrical Al electrode with a diameter of 7.0 mm (cf. Figure S2 in the SI). For these tests, the electrode with an Al disk attached to one of its ends, together with a 3-mm diameter Al rod serving as the second electrode, were placed opposite each other inside the SDG chamber, with a gap of 1 mm between them, and ablated for a period of 2 h. XRD spectra from the Al disks were captured using a MiniFlex 600 benchtop diffractometer (Rigaku; CuKa radiation, l = 1.5418 Å) in the 2θ = 20–80° range, operated with a scanning speed of 10° min−1. An optical microscope (Hirox KH-8700) was used to image the Al disks, whereas a Scanning Electron Microscope (SEM; Zeiss EVO 15) equipped with an Energy Dispersive X-ray Spectroscopy (EDS) module was employed to investigate its morphology and chemical composition.
3. Results and discussion
shows the concentrations of NPs produced by the SDG when ablating Ni, Pd, Al, or Mg electrodes over 5 h, as those are derived from the SMPS measurements. For the Ni and Pd electrodes (), the total concentration of the produced NPs was constant over time, exhibiting for both materials mean concentrations of ca. 1 × 10⁶ #/cm3 and relatively small variations; i.e., standard deviations of the concentration measurements recorded over the entire period of the experiment were 0.10 for Ni and 0.09 for Pd. In contrast, the total concentration of the Al or the Mg NPs produced by the SDG fluctuated and decreased over time (cf. ), exhibiting mean values of 0.80 × 10⁶ #/cm3 for Mg (decreasing from 1.00 × 10⁶ to 0.63 × 10⁶ #/cm3 from the start to the end of the experiment) and 1.18 × 10⁶ #/cm3 for Al (decreasing respectively from 1.49 × 10⁶ to 0.92 × 10⁶ #/cm3) and standard deviations of 0.16 for Mg and 0.40 for Al (cf. and ). For both elements, the concentration of the resulting NPs decreased with a slope of ca. −10% (specifically, −8% for Mg and −11% for Al). The possibility that these fluctuations and decreases in concentration were caused by the variability of the current and/or voltage between the two electrodes was excluded as both these variables were rather stable over the course of the experiments (cf. Figure S3 in the SI).
Figure 2. Total concentration of (a) Pd and Ni, and (b) Al and Mg NPs produced by the SDG over a period of 5 h using N2 as a carrier gas. In all the experiments the electrode diameter was 3 mm, the carrier gas flow rate was set to 6 L/min, the voltage to 0.5 kV, whereas the capacitance was 20 nF, leading to an energy of 5.6 mJ, and the sparking frequency 100 Hz (reference conditions).
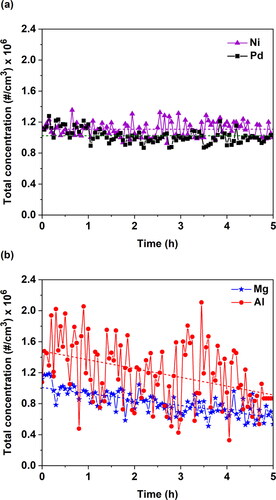
Figure 3. Violin plots showing distribution statistics of (a) the total concentration, and (b) the geometric mean diameter of the NPs produced by the SDG using electrodes of different composition. All the parameters and operating conditions in these experiments were the same as those described in the caption of . The boxes and the lines show respectively the 25th to 75th and the 10th to 90th percentiles of the distributions.
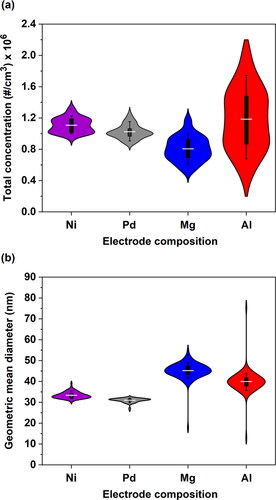
shows violin plots of the total concentration and the geometric mean diameter of the NPs produced using different electrodes at reference conditions in the SDG over periods of 5 h. For the Ni and Pd electrodes, the geometric mean NP diameter was relatively constant over time, having values of 33.4 ± 1.5 nm for Ni and 31.0 ± 1.1 nm for Pd. The geometric mean diameters for Mg and Al were, respectively, 45.2 ± 4.0 and 40.0 ± 5.6 nm. Contour plots showing the particle size distributions recorded by the SMPS are provided in Figure S4 in the SI.
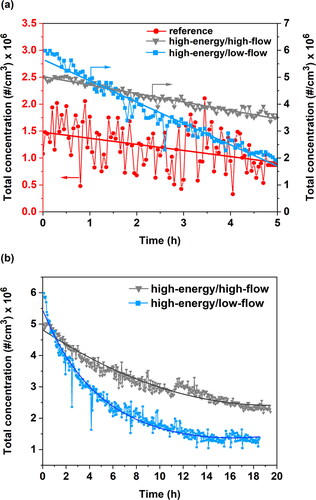
To examine how the experimental conditions affect the stability of NP production when ablating Al in N2, we sequentially increased the energy and decreased the flow, leading to the high-energy/high-flow and high-energy/low-flow conditions described in Section 2. As shown in , when we increased the energy while maintaining the high-flow conditions, the total concentration of the resulting NPs exhibited smaller fluctuations compared to the reference conditions (standard deviation: 0.40 vs. 0.48), and a decreasing trend from 5.02 × 10⁶ #/cm3 at the start of the experiment to 3.50 × 10⁶ #/cm3 at the end. The fluctuations in the concentration of the produced Al NPs remained small even when reducing the flow rate to 2 L/min (high-energy/low-flow conditions). Under these conditions we observed a more pronounced decrease in the concentration of the NPs, ranging from 5.68 × 10⁶ #/cm3 at the start of the experiment to 1.69 × 10⁶ #/cm3 at the end as also shown in . In particular, the concentration of the Al NP produced by the SDG decreased with a slope of −11% under the reference conditions (i.e., the low-energy/high flow conditions), −31% for the high-energy/high-flow conditions, and −78% for the high-energy/low-flow conditions. Carrying out longer experiments, we observed that concentration of the produced NPs reached a plateau after 17 h under the high-energy/high-flow condition, and 12 h under the high-energy/low-flow conditions. We should stress that these experiments are highly repeatable, and the estimated deviations in the concentrations are very similar among experiments using the same materials and operating conditions (Figure S5).
Figure 4. Total concentration of Al NPs produced by the SDG over a period of (a) 5 h in N2 at reference (low-energy/high-flow), high-energy/high-flow, as well as high-energy/low-flow conditions, and (b) almost 20 h in N2 under high-energy/high-flow and high-energy/low-flow conditions.
A possible explanation of the high fluctuations in the concentrations of the Mg and Al NPs, and the associated decreasing trends could be the chemical modification of the employed electrodes. Both elements can react effectively with N2, used here as a carrier gas, which is partly dissociated into single nitrogen atoms and/or radicals by the plasma, nitriding the electrodes in the vicinity of the spots where the sparks hit. As discussed in the introduction, all carrier gases have trace amounts of O2 (in the order of a few ppm), and thus oxidation of the electrodes also occurs to some extent. It seems, however, that potential oxidation of the electrodes does not cause fluctuations in the concentration and size of the NPs produced by spark ablation, as this would have been observed when using any carrier gases, and particularly synthetic air.
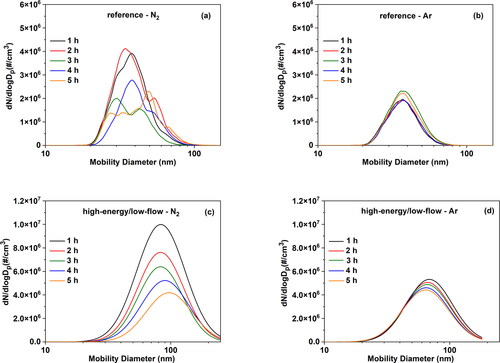
To investigate the hypothesis that nitriding the electrodes is associated with the fluctuating NP production, we carried out similar experiments to those described above where we used Al electrodes, but using also Ar as carrier gases. shows size distribution measurements of the resulting NPs, recorded at different times during the course of the experiments, when using either a N2 () or an Ar () gas flow, at different conditions. Contour plots of the size distributions over the entire period of the experiments are provided in Figure S6 in the SI. Evidently, the NP size distributions are highly variable when the Al electrodes are ablated in N2 at reference conditions, but become much more uniform and repeatable when switching to Ar. The associated variability in the concentration of the resulting NPs over the entire measurement period is reduced substantially, as also reflected by the decrease of the standard deviation from 0.40 (when ablating in N2; ) to 0.05 (when ablating in Ar; ) at the same (reference) conditions. At high-energy/low-flow conditions, the distributions of the resulting NPs shift to larger sizes while the concentration drops substantially when using N2, but become rather uniform when switching to Ar. The standard deviation in the concentration of the resulting NPs in this case drops from 1.19 to 0.07, indicating that there is a strong improvement when ablating Al electrodes in Ar compared to N2. The variations in the NP size also decrease when employing Ar compared to N2, as evidenced by their smaller variability: ± 1 standard deviation that corresponds to 5.6 nm for N2 and 1.4 nm for Ar. These observations suggest that the ablatability of the electrodes changes over time when using N2, most likely due to the chemical modification of the face where the sparks heat, leading to unstable NP production. In addition, considering that both N2 and Ar contain trace amounts of O2 at similar concentrations, these appear to have a negligible impact.
Figure 5. Particle size distributions of Al NPs produced by the SDG and measured be the SMPS over a period of 5 h at (a) reference conditions (low-energy/high-flow) in N2, (b) reference conditions (low-energy/high-flow) in Ar, (c) high-energy/low-flow conditions in N2, and (d) high-energy/low-flow conditions in Ar.
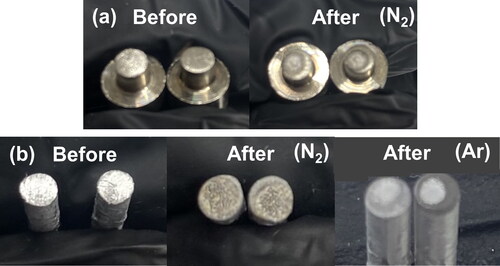
Considering the evidence that the electrodes are at least partly altered by ablation in N2, we carried out systematic characterization of their face surface where the sparks hit using offline techniques as described in Section 2. For comparison we used a Ni electrode, which shows stable production over time, and an Al electrode that exhibits unstable NP production. We should note that before each experiment, the electrodes were cleaned with sandpaper and acetone to remove impurities from their surface. After each experiment, the electrodes were cleaned with acetone to remove potential NPs deposited on the surface during the experiment, before the images were taken. As shown in , the electrode face of Ni was shining before the experiment, whereas a grey color with a black ring was observed after ablation in the SDG for 5 h under N2. In contrast, the Al electrodes exhibited a yellow-brown color after ablating them in the SDG with N2, indicating the formation of aluminum nitride over the electrode face (), and a white color when using Ar, indicating the formation of Al2O3, as shown by the XRD analysis (cf. next paragraph). These images indicate that the Ni electrodes, which yield stable NP production, are not chemically altered. In contrast, the composition of the Al electrodes, which exhibit fluctuating NP production, are chemically altered as indicated by the color of the electrode face.
Figure 6. Pictures of the faces of (a) Ni electrodes before and after being ablated in the SDG under N2, and (b) of Al electrodes before and after being ablated in the SDG under N2 or Ar at reference conditions (low-energy/high-flow).
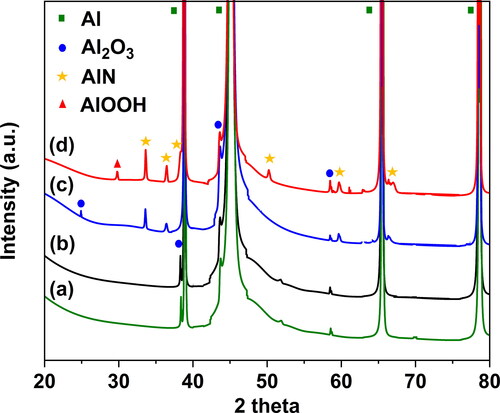
To further investigate the composition and micro-structure of the electrode face hit by the sparks, we carried out offline analysis including XRD, optical microscopy, and SEM/EDS on the Al disks mounted at the face of the electrodes as described in Section 2 (cf. also Section S2 in the SI). The XRD results from the Al disks before (i.e., as received), and after ablation in Ar and N2 are shown in . All X-ray diffractograms have high intensity peaks at 38.4°, 44.8°, 65.0°, and 78.2° 2θ angles, which are associated to metallic Al (JCPDS No. 01-072-3440). Peaks observed at 37.8°, 43.8°, and 57.4° on the Al disks before and after ablation for 2 h in Ar (cf. diffractograms a and b in ) indicate the presence of α-Al2O3 (JCPDS No. 88-0826). The XRD results from the Al disks after ablation in N2 (diffractograms c and d in ) show additional peaks at 33.2°, 36.0°, 37.9°, 49.8°, 59.3°, and 66.1°, corresponding to AlN (JCPDS No. 00-025-1133). These results corroborate our speculation that the high variability in the concentration of the resulting NPs is due to the formation of AlN over the electrode face. Under high-energy conditions in N2 (diffractogram d in ), the XRD spectrum peaks of AlN exhibit higher intensity compared to those under low-energy (i.e., reference conditions; cf. diffractogram c in ), indicating that nitriding of the electrodes has happened to a greater extent.
Figure 7. XRD spectra of Al disk (a) as received, and after ablation over a 2-h period in SDG under (b) reference conditions in Ar, (c) reference conditions in N2, and (d) high-energy/low-flow conditions in N2.
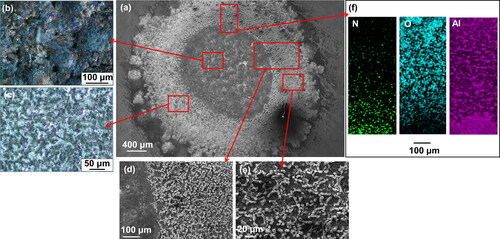
shows optical microscopy and SEM/EDS images, including chemical mapping for N, O and Al of the Al disk obtained for the electrodes ablated under reference experimental conditions (i.e., low-energy/high-flow conditions). The SEM image () shows that a circle of ca. 2.0 mm in diameter and a ring having thickness of 1.0 mm were formed on the 5-mm in diameter Al disk, which was positioned opposite a 3-mm electrode in the SDG (cf. associated discussion in Section 2, and Figure S2 in the SI). The inner circle includes hills, holes, and valleys having yellow-brown, black and silver colors, while the ring has shiny areas with silver coloration and white crystals (). EDS analysis () indicates that the circle has high abundancy in nitrogen, and the ring in oxygen. According to the results from the SEM/EDS and XRD analyses, it is evident that AlN was formed within the inner circle, whereas Al2O3 in the surrounding ring. We should also note that the surface of the ring was elevated with respect to both the inner circle and the rest of Al disk, indicating that a good fraction of Al particles was deposited in that area and oxidized either by the trace amounts of oxygen in the N2 carrier gas passed through the SDG, or when exposed to ambient air after the experiment. A similar assemble of images is provided in the SI (cf. Figure S7), but in this case the Al disk was ablated under high-energy/low-flow experimental conditions; i.e., the N2 flow rate was set to 2 L/min, the voltage was 1.0 kV and the capacitance was 20 nF, leading to an energy of 22.5 mJ, whereas the sparking frequency was 100 Hz. Interestingly, the holes in the inner circle were more pronounced in that case, indicating that ablation at high-energy conditions is more violent compared to the low-energy conditions (Figure S7 in the SI).
Figure 8. Assemble of microscopy images and chemical maps of an Al disk attached on the face of an Al electrode (cf. associated discussion in Section 2, and Figure S2 in the SI) after ablating it over a period of 2 h, including (a) SEM image of the entire Al disk, optical microscopy images of (b) the circle and (c) ring of the Al disk, SEM image of (d) circle-ring and (e) ring area, and (f) chemical mapping for N, O, and Al of the Al disk. We used N2 with a flow rate of 6 L/min, a voltage of 0.5 kV and a capacitance of 20 nF, leading to an energy of 5.6 mJ, while the sparking frequency was 100 Hz.
The fluctuations in the size distributions (i.e., both concentration and size of the NPs) observed for Mg and Al produced in N2, are most likely due to random changes in the morphology of the nitride layer. Under low-energy and/or low-flow conditions, the balance between the removal and the formation of the nitride parts on the electrode face by sparking leads to a higher average layer thickness and a more complete coverage. As a result, by the formation of the nitride layer, which is a dielectric, the electric field is weakened, and consequently the spark gap is automatically reduced by the generator (i.e., an inherent feature of the system employed in this work) in order to increase the field to a value that enables spark formation for the chosen value of Vd. This temporarily allows nitride ablation, until a new crater in the nitride layer leads to metal ablation again. Section S7 in the SI gives a more detailed picture about the plausible evolution of this layer.
Considering that the melting point of AlN (2200 °C) is much higher compared to that of pure Al (660 °C), it is quite likely that less material is ablated from the electrodes when the sparks hit the nitridated areas on the electrode face, consequently leading to lower production rates and thus to lower concentrations of the produced NPs. Based on this argumentation, one would expect that the lower the difference in the melting point between the different regions formed on the face of the electrodes, the higher the stability of NP production by spark ablation. This is in line with our observation when ablating Mg electrodes in N2, which form a region of Mg3N2 having a melting point (1500 °C) that is 850 °C higher compared to that of pure Mg (650 °C), adding validity to our explanation.
The reason why the stability of NP production increases when increasing the input energy can then be explained by the stronger removal of nitride by the spark, which leads to more nitride-free areas (cf. Figure S8 in the SI) allowing stable ablation. The decreasing trend in the concentrations of the Mg and Al NPs produced under N2 can be attributed to the time the face of the electrodes need to reach a balance between nitride formation and nitride removal by the sparks. This is supported by the fact that the decreasing trends are faster when we decrease the flow, resulting in a higher temperature of the electrodes and a higher nitrogen radical concentration, both of which promote the nitriding process ().
4. Conclusions
We have investigated the stability of NP production by spark ablation for different electrode materials and carrier gases. Our results show that for materials that do not react with N2 (i.e., Pd and Ni) the production of NPs is stable. Materials that react with N2 and can produce nitride species (e.g., Al and Mg) form a nitride layer at the surfaces being ablated. NP concentration and size fluctuate, and therewith mass production rate also fluctuates and decreases significantly over time. The operating conditions of the SDG also affect the stability of NP production in N2 for electrode materials that form nitride species. In particular, faster nitriding occurs under low-flow conditions, which causes a significant decrease in the production of NPs that needs more than 10 h of continuous operation to stabilize. Optical microscopy, SEM-EDS, and XRD analysis of the face surface of the electrodes where the sparks hit, showed regions with different compositions, suggesting that the fluctuations and decreasing trends in NP production from materials that are prone to nitriding (i.e., Al and Mg tested in this study) are attributed to chemical transformation of the face of the electrodes from a pure metal to a nitride. NP production evidently reaches a stationary state, under which formation and removal of the nitride layer by the sparks balance each other. Using Ar as a carrier gas for these materials improved substantially the NP production stability, at levels that were similar to those observed for elements that do not interact with N2 (e.g., Pd and Ni), and is therefore suggested for stable production of Al NPs by atmospheric-pressure spark ablation.
Supplemental Material
Download PDF (844.3 KB)Disclosure statement
No potential conflict of interest was reported by the author(s).
Additional information
Funding
References
- Anastasopol, A., T. V. Pfeiffer, J. Middelkoop, U. Lafont, R. J. Canales-Perez, A. Schmidt-Ott, F. M. Mulder, and S. W. H. Eijt. 2013. Reduced enthalpy of metal hydride formation for Mg–Ti nanocomposites produced by spark discharge generation. J. Am. Chem. Soc. 135 (21):7891–900. doi: 10.1021/ja3123416.
- Chen, H. Y., H. R. Stock, and P. Mayr. 1994. Plasma-assisted nitriding of aluminum. Surf. Coat. Technol. 64 (3):139–47. doi: 10.1016/0257-8972(94)90100-7.
- Dupre, B., and R. Streiff. 1970. The kinetics of magnesium nitriding by pure nitrogen. Oxid. Met. 2 (2):155–60. doi: 10.1007/BF00603654.
- Efimov, A. A., P. V. Arsenov, V. I. Borisov, A. I. Buchnev, A. A. Lizunova, D. V. Kornyushin, S. S. Tikhonov, A. G. Musaev, M. N. Urazov, M. I. Shcherbakov, et al. 2021. Synthesis of nanoparticles by spark discharge as a facile and versatile technique of preparing highly conductive Pt nano-ink for printed electronics. Nanomaterials (Basel)11 (1):234. doi: 10.3390/nano11010234.
- Efimov, A. A., I. A. Volkov, V. V. Ivanov, A. A. Vasiliev, A. E. Varfolomeev, A. V. Pislyakov, A. S. Lagutin, and T. Maeder. 2016a. Spark discharge synthesis of semiconductor nanoparticles for thick-film metal oxide gas sensors. Proc. Eng. 168:1036–9. doi: 10.1016/j.proeng.2016.11.334.
- Efimov, A. A., A. A. Lizunova, I. A. Volkov, D. A. Mylnikov, P. V. Arsenov, and V. V. Ivanov. 2016b. A new approach to the high-yield synthesis of nanoparticles by spark discharge. J. Phys. Conf. Ser. 741:012035. doi: 10.1088/1742-6596/741/1/012035.
- Feng, J., G. Biskos, and A. Schmidt-Ott. 2015. Toward industrial scale synthesis of ultrapure singlet nanoparticles with controllable sizes in a continuous gas-phase process. Sci. Rep. 5 (1):15788. doi: 10.1038/srep15788.
- Feng, J., X. Guo, N. Ramlawi, T. V. Pfeiffer, R. Geutjens, S. Basak, H. Nirschl, G. Biskos, H. W. Zandbergen, A. Schmidt-Ott, et al. 2016. Green manufacturing of metallic nanoparticles: A facile and universal approach to scaling up. J. Mater. Chem. A 4 (29):11222–7. doi: 10.1039/C6TA03221D.
- Hallberg, R. T., L. Ludvigsson, C. Preger, B. O. Meuller, K. A. Dick, and M. E. Messing. 2018. Hydrogen-assisted spark discharge generated metal nanoparticles to prevent oxide formation. Aerosol Sci. Technol. 52 (3):347–58. doi: 10.1080/02786826.2017.1411580.
- Isaac, N. A., P. Ngene, R. J. Westerwaal, J. Gaury, B. Dam, A. Schmidt-Ott, and G. Biskos. 2015. Optical hydrogen sensing with nanoparticulate Pd–Au films produced by spark ablation. Sens. Actuat. B 221:290–6. doi: 10.1016/j.snb.2015.05.095.
- Isaac, N. A., M. Valenti, A. Schmidt-Ott, and G. Biskos. 2016. Characterization of tungsten oxide thin films produced by spark ablation for NO 2 Gas Sensing. ACS Appl. Mater. Interfaces. 8 (6):3933–9. doi: 10.1021/acsami.5b11078.
- Jang, S., J. Yoon, K. Ha, M. C., Kim, D. H. Kim, S. M. Kim, S. M. Kang, S. J. Park, H. S. Jung, M. Choi, et al. 2016. Facile fabrication of three-dimensional TiO 2 structures for highly efficient perovskite solar cells. Nano Energy 22:499–506. doi: 10.1016/j.nanoen.2016.02.050.
- Kohut, A., A. Kéri, V. Horváth, J. Kopniczky, T. Ajtai, B. Hopp, G. Galbács, and Z. Geretovszky. 2020. Facile and versatile substrate fabrication for surface enhanced Raman spectroscopy using spark discharge generation of Au/Ag nanoparticles. Appl. Surf. Sci. 531:147268. doi: 10.1016/j.apsusc.2020.147268.
- Lu, J., J. Guo, S. Song, G. Yu, H. Liu, X. Yang, and Z. Lu. 2020. Preparation of Ag nanoparticles by spark ablation in gas as catalysts for electrocatalytic hydrogen production. RSC Adv. 10 (63):38583–7. doi: 10.1039/D0RA06682F.
- Maisser, A., K. Barmpounis, M. B. Attoui, G. Biskos, and A. Schmidt-Ott. 2015. Atomic cluster generation with an atmospheric pressure spark discharge generator. Aerosol Sci. Technol. 49 (10):886–94. doi: 10.1080/02786826.2015.1080812.
- Meuller, B. O., M. E. Messing, D. L. J. Engberg, A. M. Jansson, L. I. M. Johansson, S. M. Norlén, N. Tureson, and K. Deppert. 2012. Review of spark discharge generators for production of nanoparticle aerosols. Aerosol. Sci. Technol. 46 (11):1256–70. doi: 10.1080/02786826.2012.705448.
- Muntean, A., M. Wagner, J. Meyer, and M. Seipenbusch. 2016. Generation of copper, nickel, and CuNi alloy nanoparticles by spark discharge. J. Nanopart. Res. 18 (8):229. doi: 10.1007/s11051-016-3547-2.
- Němec, T., J. Šonský, J. Gruber, E. de Prado, J. Kupčík, and M. Klementová. 2020. Platinum and platinum oxide nanoparticles generated by unipolar spark discharge. J. Aerosol Sci. 141:105502. doi: 10.1016/j.jaerosci.2019.105502.
- Petallidou, K. C., P. Ternero, M. E. Messing, A. Schmidt-Ott, and G. Biskos. 2023. Tuning atomic-scale mixing of nanoparticles produced by atmospheric-pressure spark ablation. Nanoscale Adv. 5 (24):6880–6. doi: 10.1039/D3NA00152K.
- Preger, C., C. Bulbucan, B. O. Meuller, L. Ludvigsson, A. Kostanyan, M. Muntwiler, K. Deppert, R. Westerström, and M. E. Messing. 2019. Controlled oxidation and self-passivation of bimetallic mMagnetic FeCr and FeMn aerosol nanoparticles. J. Phys. Chem. C 123 (26):16083–90. doi: 10.1021/acs.jpcc.9b01678.
- Sapountzi, F. M., M. Lavorenti, W. Vrijburg, S. Dimitriadou, B. Tyburska-Pueschel, P. Thüne, H. Niemantsverdriet, T. V. Pfeiffer, and M. N. Tsampas. 2022. Spark ablation for the fabrication of PEM water electrolysis catalyst-coated membranes. Catalysts 12 (11):1343. doi: 10.3390/catal12111343.
- Schmidt-Ott, A. (ed) 2020. Spark ablation: Building blocks for nanotechnology. Singapore: Jenny Stanford Publishing.
- Schwyn, S., E. Garwin, and A. Schmidt-Ott. 1988. Aerosol generation by spark discharge. J. Aerosol Sci. 19 (5):639–42. doi: 10.1016/0021-8502(88)90215-7.
- Snellman, M., N. Eom, M. Ek, M. E. Messing, and K. Deppert. 2021. Continuous gas-phase synthesis of core–shell nanoparticles via surface segregation. Nanoscale Adv. 3 (11):3041–52. doi: 10.1039/D0NA01061H.
- Tabrizi, N. S., Q. Xu, N. M. van der Pers, U. Lafont, and A. Schmidt-Ott. 2009. Synthesis of mixed metallic nanoparticles by spark discharge. J. Nanopart. Res. 11 (5):1209–18. doi: 10.1007/s11051-008-9568-8.
- Tabrizi, N. S., Q. Xu, N. M. van der Pers, and A. Schmidt-Ott. 2010. Generation of mixed metallic nanoparticles from immiscible metals by spark discharge. J. Nanopart. Res. 12 (1):247–59. doi: 10.1007/s11051-009-9603-4.
- Ternero, P., M. Sedrpooshan, D. Wahlqvist, B. O. Meuller, M. Ek, J.-M. Hübner, R. Westerström, and M. E. Messing. 2023. Effect of the carrier gas on the structure and composition of Co–Ni bimetallic nanoparticles generated by spark ablation. J. Aerosol Sci. 170:106146. doi: 10.1016/j.jaerosci.2023.106146.
- Villy, L. P., A. Kohut, A. Kéri, Á. Bélteki, G. Radnóczi, Z. Fogarassy, G. Z. Radnóczi, G. Galbács, and Z. Geretovszky. 2022. Continuous spark plasma synthesis of Au/Co binary nanoparticles with tunable properties. Sci. Rep. 12 (1):18560. doi: 10.1038/s41598-022-22928-0.
- Vons, V. A., A. Anastasopol, W. J. Legerstee, F. M. Mulder, S. W. H. Eijt, and A. Schmidt-Ott. 2011. Low-temperature hydrogen desorption and the structural properties of spark discharge generated Mg nanoparticles. Acta Mater. 59 (8):3070–80. doi: 10.1016/j.actamat.2011.01.047.
- Wondergem, C. S., J. J. G. Kromwijk, M. Slagter, W. L. Vrijburg, E. J. M. Hensen, M. Monai, C. Vogt, and B. M. Weckhuysen. 2020. In Situ shell‐isolated nanoparticle‐enhanced Raman spectroscopy of nickel‐catalyzed hydrogenation reactions. Chemphyschem 21 (7):625–32. doi: 10.1002/cphc.201901162.