
 ?Mathematical formulae have been encoded as MathML and are displayed in this HTML version using MathJax in order to improve their display. Uncheck the box to turn MathJax off. This feature requires Javascript. Click on a formula to zoom.
Abstract
Combustion and air-pollution aerosol particles often contain a substantial mass fraction of carbon. In biomass or residual-fuel smoke, this carbon may span a continuum of molecular sizes and physical properties, from macromolecular black carbon (BC) and tarballs to smaller molecules of organic particulate matter (OM). The quantification of these materials presents a metrological challenge which rapid temperature programmed oxidation instruments (RTPOs) may address. RTPOs collect particles on filters, which are then rapidly heated (> 700 K/min) in ambient or synthetic air while CO2 in the emitted gases is quantified either with (e.g. the “FATCAT” instrument) or without (e.g., “TCA08”) first passing gases over an oxidation catalyst. Both RTPOs monitor CO2 concentrations in real time to provide thermograms; both report total carbon mass by reference to baseline-subtracted CO2 thermograms. In this study, we investigated the response of these instruments to a variety of laboratory samples. Integrated carbon mass from the FATCAT and TCA08 agreed with one another, and with reference measurements, for both mature, fully graphitized soot (OC/TC < 0.1) and young, partially formed soot (OC/TC = 0.6 after denuding at 350 °C). However, due to its lack of an oxidation catalyst, the TCA08 CO2 measurements were Equation1(1)
(1) 0-fold lower than reference measurements for two model OM compounds (dioctyl sebacate and sucrose). Since a previous atmospheric study has observed consistency between a TCA08 and a reference instrument, our data imply a large difference in the evaporation kinetics of these surrogates and atmospheric OM, as expected for highly-viscous (glassy) atmospheric OM. Finally, we discuss the thermograms of nebulized BC surrogates (C60, graphene, graphite), which showed two peaks at lower and higher temperatures, even after denuding at 350 °C.
Graphical Abstract
Editor:
Introduction
Background
Carbon is the major element in many combustion, biogenic, biological, medical, and synthetic aerosols. These aerosols have significant effects on climate and air quality even at extremely low concentrations of particulate matter (PM), and therefore represent a significant metrological challenge. For atmospheric sampling, this challenge is often addressed using high-volume filter samplers collecting over long periods, up to Equation2(2)
(2) 4 h. For the direct sampling of low-emission engines, such long sampling periods are not only inconvenient but often economically infeasible due to fuel and personnel costs. For example, the emission rates of modern natural-gas powered marine engines are low enough that half an hour of filter sampling resulted in black carbon (BC) mass loadings only ten times the background organic PM (OM) signal (Corbin et al. Citation2020b), when applying the common technique of thermal–optical analysis (TOA). Similarly, a recent study on aviation engines (Corbin et al. Citation2022) did not report any TOA data due to signal-to-noise limitations.
TOA is often the simplest and most economical tool available for carbonaceous PM quantification, but numerous other methods exist. These include infrared spectroscopy, mass spectrometry, electron microscopy, and temperature-programmed desorption (TPD) or oxidation (TPO). A complete characterization of a PM sample might combine all of these techniques, as they each have distinct strengths and weaknesses. Infrared spectroscopy allows the quantification of functional groups in a PM filter sample (Weakley, Takahama, and Dillner Citation2018). However, it suffers from a low signal-to-noise ratio, and signal overlap from different carbon species (Herold et al. Citation2022). Electron microscopy can provide both compositional and morphological information (e.g., Adachi, Chung, and Buseck Citation2010; Adachi et al. Citation2019; Gagné et al. Citation2021; Sipkens et al. Citation2023), but is only capable of measuring low-volatility PM and produces relatively limited sampling statistics. Finally, aerosol mass spectrometry provides information on the molecular structure, elemental composition, and total mass of the PM (Bell et al. Citation2023; Canagaratna et al. Citation2015; Jimenez et al. Citation2009; Nash, Baer, and Johnston Citation2006; Onasch et al. Citation2015; Onasch et al. Citation2012), and is not limited to carbon measurement; however, mass spectrometry requires substantial capital investment, expert operators, and careful calibration and analysis, in both its advanced and simplified (Ng et al. Citation2011) forms. Electron microscopy and mass spectrometry also require substantially more capital investment than is desirable at many emissions-testing or pollution-monitoring sites.
Temperature-programmed desorption (TPD) and oxidation (TPO)
Relative to all of the above techniques except TOA, TPD and TPO are simple and valuable techniques (Herold et al. Citation2022). These techniques may be used to quantify the carbon mass evolved during a controlled temperature–time protocol, typically averaging heating rates of Equation1(1)
(1) 0 K min−1, either in an inert (for TPD) or oxidizing (for TPO) atmosphere. TPD and TPO may be hyphenated with infrared spectroscopy, mass spectrometry, or simple gas detectors.
The TOA technique mentioned above is essentially equivalent to a combination of TPD and TPO into a single, two-step technique. TOA typically uses discontinuous, stepwise temperature protocols (Cavalli et al. Citation2010) in contrast to the continuously increasing temperature protocols often used with TPD and TPO (Düngen, Schlögl, and Heumann Citation2018). The major practical differences between TPD/TPO and TOA are the use of much smaller quantities of sample in TOA, and, of course, the optical component of TOA. This optical component comprises an additional optical detector intended to correct for the pyrolysis and carbonization of thermally-unstable samples (Huntzicker et al. Citation1982; Watson, Chow, and Chen Citation2005), and was introduced to divide carbon measurements into the operationally defined categories of “organic carbon” (OC) and “elemental carbon” (EC). These categories are meaningful for dichotomous mixtures of highly volatile (e.g., lubrication oil) and highly refractory carbon materials (e.g., diesel soot). However, for complex mixtures such as biomass burning smoke (Watson, Chow, and Chen Citation2005) or samples containing metal catalysts (Aakko-Saksa et al. Citation2018; Watson, Chow, and Chen Citation2005), these categories are ill-defined. Moreover, TOA measures high EC/TC ratios for certain non-graphitic materials such as asphaltenes (Corbin et al. Citation2019) and amorphous-carbon tarballs (Corbin et al. Citation2019). This is largely because these materials form carbonized residues during the TPD heating stage, for which the optical correction is inaccurate (Corbin et al. Citation2020a; Karanasiou et al. Citation2011; Rigler et al. Citation2020; Watson, Chow, and Chen Citation2005). These issues have been discussed in detail in a recent review (Corbin et al. Citation2020a), and, overall, imply that caution is warranted before interpreting TOA OC as an accurate measurement of the carbon in OM.
During pyrolysis in TPD and TOA-OC analysis (where smaller molecules form via the breakage of covalent bonds; (Muller Citation1994)), direct measurements have shown that samples release organic compounds (Corbin et al. Citation2019; Nespor et al. Citation2021; Streibel et al. Citation2017), as well as CO and CO2 (Düngen, Schlögl, and Heumann Citation2018; Matuschek et al. Citation2007). The CO and CO2 forms from the decomposition of surface functional groups at temperatures as low as 400 K. Pyrolysis-generated molecules have been observed for soot BC using standard TPD heating rates of Equation1(1)
(1) 0 K min−1 (Matuschek et al. Citation2007) as well as using extremely rapid heating rates (≫ Equation1
(1)
(1) 000 K s−1) under vacuum conditions in a laser-vaporizer mass spectrometer (Corbin et al. Citation2015). The latter observation demonstrates that the CO and CO2 do not form via reaction of the PM with traces of gas-phase O2. However, we note that such traces of O2 have been identified as responsible for the loss of BC during the TPD (inert gas) stage of TOA instruments (Chow et al. Citation2007; Subramanian, Khlystov, and Robinson Citation2006).
TPO techniques (including the EC stage of TOA) lead to heterogeneous oxidation of solid carbons to produce CO and CO2 (Li and Brown Citation2001; Niessner Citation2014). For soot BC, the oxidation rate during TPO is initially governed by diffusion into the bulk of the soot, while surface oxidation takes precedence at temperatures above 900 K (Kelesidis and Pratsinis Citation2019; Ma, Zangmeister, and Zachariah Citation2013). In contrast, organics are likely to evaporate upon heating, potentially undergoing subsequent gas-phase oxidation to smaller organics, CO, or CO2.
All three of these temperature-programmed techniques (TPD, TPO, and TOA) produce thermograms – i.e., temporal profiles of the gaseous carbon evolved during the temperature program – which provide insights into the volatility and reactivity of the carbon sample. TPO and TPD data are routinely interpreted in terms of surface functional groups and sample reactivity (Herold et al. Citation2022; Niessner Citation2014) while TOA data are routinely interpreted in terms of sample volatility (Watson, Chow, and Chen Citation2005). This difference in routine interpretation does not reflect a physical difference between the instruments, but rather between the types of sample commonly analyzed: even though BC surfaces often contain a substantial mass fraction of functional groups (Corbin et al. Citation2015; Matuschek et al. Citation2007), the absolute mass of those functional groups is normally small relative to the absolute mass of OM internally mixed with BC, whether co-emitted or formed during secondary environmental processes. This relative mass of OM to BC varies by orders of magnitude between combustion sources (Bond et al. Citation2013; Bond et al. Citation2004).
Rapid TPO (RTPO)
Overall, temperature-programmed techniques provide a valuable and practical tool for the analysis of carbonaceous PM. However, the above-mentioned standard techniques require a mass of sample that is too large (for TPD and TPO, approximately Equation1(1)
(1) 0 mg; for TOA, approximately Equation2
(2)
(2) 0 µg of carbon loaded onto each cm2 of filter area; or 0.24 mg of total sample mass for the exposed area of a 47 mm Ø filter) for many environmental applications, as noted above. In addition, the separate stages of sample collection and analysis increase the financial costs of TOA. Both of these limitations are overcome by two recently developed carbon analyzers that perform rapid TPO (RTPO) on accelerated timescales, heating samples at > 700 K min−1 rather than Equation1
(1)
(1) 0 K min−1, and automating the aerosol collection and analysis stages (Keller et al. Citation2023; Rigler et al. Citation2020). Both of these RTPOs recommend the use of a charcoal denuder upstream of the instrument to limit the uptake of gas-phase organics onto the sampling filter. Although automated TOA sampling and analysis, including a denuder, has been developed (Bauer et al. Citation2009), the sample mass required for automated TOA is still much larger than the mass required by RTPO instruments.
RTPO instruments aim to measure total carbon (TC), rather than to identify distinct surface functional groups, as in TPO, or to separately quantify OM and BC, as in TOA. The manufacturer of the TCA08 has proposed that it may be combined with a light-absorption instrument that obtains optically equivalent BC mass concentrations (eBC), leading to a new operational definition of equivalent OC (eOC) as TC minus eBC (Rigler et al. Citation2020), which must be interpreted with caution since eBC light absorption is enhanced by the internal mixing of BC with OC (Cappa et al. Citation2019; Fuller and Kreidenweis Citation1999). It has also been proposed that a detailed analysis of RTPO data may allow for a separation of carbon species according to their thermograms (Keller et al. Citation2023).
Study scope
In this study, we explore a new application of RTPO instruments. Specifically, we explore the use of RTPOs to measure nonvolatile TC (nvTC) after a preconditioning stage, such as a 350 °C catalytic stripper, removes OM. This definition of nvTC is distinct from the operational definition of EC or TC in TOA: it is expected that the EC/TC of nvTC is about 0.9 (Corbin et al. Citation2020a). Instead, nvTC as defined is consistent with regulations in the automotive and aviation industries which focus on nonvolatile PM (Giechaskiel et al. Citation2014; Lobo et al. Citation2020) and could prove valuable for future regulations of marine engines and residential wood-burning appliances, which may produce nonvolatile tarballs that are distinct from soot BC and therefore would not be measured accurately by some techniques (Corbin et al. Citation2019).
The response factors of the two RTPOs (FATCAT and TCA08) to both nvTC and OM were herein evaluated. Initial observations of a low sensitivity for the TCA08 to OM prompted additional experiments. Various carbonaceous materials were explored. Considering the potential application of the nvTC approach to marine engines and wood burning emissions, we measured carbons covering a range of degrees of graphitization (i.e., graphite, graphene, flame soot, quenched-combustion flame soot) and molecular structures (i.e., fullerenes, nigrosine, sucrose, alkanes). We also measured lubricating oil surrogates (dioctyl sebacate and hexadecane). Finally, we investigated the relationship between RTPO thermograms and molecular structure. Equation1(1)
(1) summarizes the various acronyms used herein.
Table Equation1(1)
(1) . Acronyms used in this manuscript.
Methods
RTPOs: fast thermal carbon totalizer (FATCAT) and total carbon analyzer (TCA08)
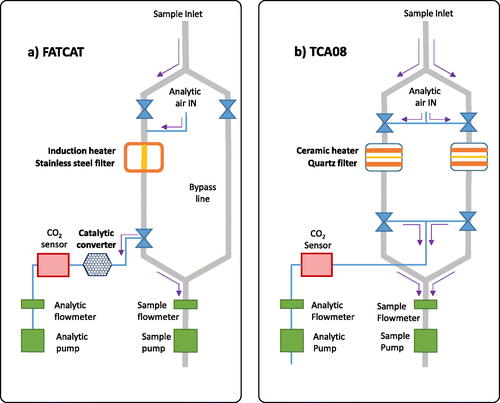
The two RTPOs used in this study, the FATCAT (Fast Carbon Totalizer, produced by the University of Northwestern Switzerland) and TCA08 (Total Carbon Analyzer, Aerosol Magee Scientific), are described in detail by their producers in Keller et al. (Citation2023) and Rigler et al. (Citation2020), respectively. For the purposes of our study, it is sufficient to note the key components of these devices, as shown in . In particular, each device first collects particulate on a filter during a sampling period, then switches to an analysis period to heat that filter and release carbon from PM (the valves shown in are schematic only). In the FATCAT, this filter is stainless-steel and is heated by induction. In the TCA08, this filter is quartz and is heated by nearby resistive coils. The released carbon may be CO2, CO, or organics, and is transported by a continuous gas flow to a non-dispersive infrared CO2 detector. In the FATCAT, the CO2 detector is preceded by a heated catalyst to convert all carbonaceous gases to CO2. In the TCA08, no catalyst is used for simplicity. Any organic gases or CO emitted from the sample is therefore not detected in the TCA08.
Figure 1. Schematic diagrams of the (a) FATCAT and (b) TCA08 rapid thermal carbon analyzers. The FATCAT model used has an internal oxidation catalyst (to convert sample gases to CO2), a stainless-steel filter, and heats inductively. The TCA08 model has no oxidation catalyst, dual sample chambers, utilizes quartz filters, and heats its filters using nearby resistive heaters. All other components are similar.
The sampling period in both devices is user configurable and is typically about Equation2(2)
(2) 0 min. Typical flow rates are Equation1
(1)
(1) 0 to Equation1
(1)
(1) 5 L min−1. The analysis period is much faster, about Equation1
(1)
(1) min. After the heating period, about Equation1
(1)
(1) 5 min are required for sample chamber cooling, before initiating the next sampling period. During this period, the TCA08 actively cooled its sampling chamber while the FATCAT cooling was passive. Although the TCA08 features dual sampling chambers to avoid instrument down-time during this cooling stage, we discarded all TCA08 data from the second chamber so that our TCA08 and FATCAT data sets were harmonized in time.
Following the recommendations of each instrument manufacturer, the TCA08 was operated using laboratory air for combustion while the FATCAT was operated using a synthetic-air cylinder. Therefore, a single baseline measurement was obtained and applied for all FATCAT data in this study, while the TCA08 measured a baseline for each sample and performed an automated polynomial fit (Rigler et al. Citation2020). A sensitivity test using a second FATCAT baseline at the end of the study indicated a negligible influence on our reported results. Frequent comparisons with blank samples, taken with the aerosol source off, ensured that these baselines were applied effectively.
RTPO sample conditioning
The manufacturers of both RTPOs recommend the use of an activated charcoal denuder upstream of the device, since neither RTPO uses backer filters to quantify gas-phase organics, as is necessary to account for semivolatile aerosols (Subramanian et al. Citation2004). However, the use of a charcoal denuder introduces the potential for a time-dependent bias in the RTPO data, since such denuders slowly become saturated. It also requires expert judgment or special calibration to establish when the denuder capacity has been reached, since this is a function of the organic concentrations to which the RTPO is exposed.
Instead of using a denuder, we chose to condition our samples using a catalytic stripper (CS10 or CS15, Catalytic Instruments GmbH, Germany) operated at a temperature of 350 °C and placed before entry to the FATCAT and TCA08 to remove OM via evaporation (and subsequent oxidation to volatile gases such as CO2) prior to sampling. We note that the RTPOs would not detect any CO2 produced by the stripper, since that CO2 would pass through the RTPO collection filter and would not be present when the RTPOs switch to their combustion modes. The CS10 was placed in front of the FATCAT, operated at Equation1(1)
(1) 0 L/min. The CS15 was placed in front of the TCA08, operated at Equation1
(1)
(1) 6.7 L/min. This small excess flow beyond the Equation1
(1)
(1) 5 L/min design flow of the CS15 is not expected to make any difference to its performance at our dilution levels (personal communication, Catalytic Instruments GmbH, Equation2
(2)
(2) 022). Moreover, the TCA08 was shown below to be relatively insensitive to organics even without the stripper.
Sunset Laboratories carbon analyzer for thermal–optical analysis (TOA)
We collected quartz-behind-quartz and quartz-behind-teflon filter samples during some RTPO runs. These filter samples were used to obtain thermograms by thermal–optical analysis (TOA) using a Sunset Laboratories Carbon Analyzer (Model 5 L) (Birch and Cary Citation1996). However, because the target filter loading in the RTPOs was much lower than that of TOA, our TOA analysis results could not be used to quantify elemental carbon (EC) and total carbon (TC) in all cases. Specifically, if the Equation1(1)
(1) 0 µg m−3 target concentration routinely used in our laboratory for TOA sampling was reached, the RTPO signals did not always return to baseline during their Equation1
(1)
(1) -min heating cycles (e.g., the Aquadag thermograms discussed below). We therefore used our TOA data for qualitative interpretation in most cases, with the exception of the sucrose calibrations of the TCA08. When necessary, we supplemented our measurements with literature measurements of the EC/TC ratio for the miniCAST combustion standard by Malmborg et al. (Citation2019).
Experimental setup
Our experimental setup is illustrated in Figure S1. We generated aerosols using a nebulizer (ATM Equation2(2)
(2) 26, Topas GmbH, Germany), a miniature combustion aerosol standard (Jing miniCAST 5201 C, Jing Ltd., Switzerland), or a miniature inverted soot generator (MISG, IB-1, Argonaut Scientific, Canada). For mature soot, the results from the miniCAST and MISG soot generators were similar. However, the MISG only produces mature soot (highly graphitic soot), so we used the miniCAST to generate the refractory, non-graphitic nanoparticles (also known as “young soot”; Michelsen et al. [Citation2020]) that have been discussed in detail by Maricq (Citation2014). These young soot particles have been referred to as “high-OC soot” or by other names in previous publications.
We nebulized various carbon materials using the nebulizer. Using water as a dispersing medium, we nebulized Aquadag (G303, Acheson Inc., USA), nigrosine (Sigma Aldrich cat. #198285, Lot #SHBL0637), and sucrose. We switched to ethanol for the water-immiscible powders of few-layer graphene (produced at the University of Duisburg and described in detail in our previous work; Musikhin et al. [Citation2021]) and buckminsterfullerene (C60, 99.5%, Sigma-Aldrich cat. #379646). We nebulized two organic liquids without dispersant: dioctyl sebacate (DOS, Sigma-Aldrich cat. #84822), and hexadecane (Sigma Aldrich cat. #296317) were nebulized and passed through a capsule filter with a small hole drilled through it, to reduce their number concentrations. The size distributions of hexadecane and DOS had geometric mean diameters (GMDs) of Equation1(1)
(1) 5 nm and 35 nm, respectively, and geometric standard deviations (GSDs) of Equation1
(1)
(1) .7 and Equation1
(1)
(1) .4. The material properties of each material in Equation2
(2)
(2) were retrieved from ChemSpider.com and the literature (Bond et al. Citation2013; Schönherr, Matsumoto, and Freiberg Citation1999).
Table Equation2(2)
(2) . Carbon materials analyzed in this study.
All generated aerosols were diluted immediately after production (within Equation1(1)
(1) m of a 6 mm dia. sampling line) with a high flow of laboratory-grade compressed air, to produce approximately 60 L/min total flow. The diluted aerosols were passed through a cyclone rated at Equation1
(1)
(1) µm aerodynamic diameter at 50 L/min before being homogenized with a static mixer (Model 3/8-40-3-12-2, Koflo Corporation, IL, USA). Excess flow was vented before the flow was divided between the scanning mobility particle sizer (SMPS; Models 3081, 3082, 3776, TSI Inc.) and a high-flow line. The high-flow line was split in two, with each half going to one RTPO and one set of filter samples. Wye splitters were used in all cases to avoid flow-splitting artifacts. The SMPS was used to monitor size distributions during the nebulizer and soot experiments. In some experiments, the SMPS was replaced by a laser-induced incandescence (Artium Technologies LII 300) instrument to obtain rBC mass concentrations.
In addition, we performed a set of special experiments using sucrose dispensed from a syringe, as a bulk powder, and as an aerosol, and explored the effects of a humidification cycle on the aerosol-phase sucrose.
Results and discussion
Linearity
shows thermograms from the TCA08 and FATCAT at a variety of soot concentrations, prior to baseline subtraction. Baselines are shown as blue dotted lines and sample signals (i.e., sample plus baseline) are shown as black lines. All other data presented in this work were baseline subtracted (blue curves subtracted from black curves).
Figure 2. TCA08 (a) and FATCAT (b) thermograms of MISG soot after a catalytic stripper, at varying filter loadings. Filter loadings were varied by opening a sample valve to a Dekati eductor dilutor for a certain period of time, with no other changes to the system. The soot concentration used to load each filter is labeled on the figure. Note that both instruments’ heating durations are customizable and were not optimized for this experiment; the FATCAT heater was switched off before all carbon had evolved. Dilution-air measurements (blue dotted lines) were subtracted from subsequent data. The TCA08 baseline is lower due to the response factor difference shown in .
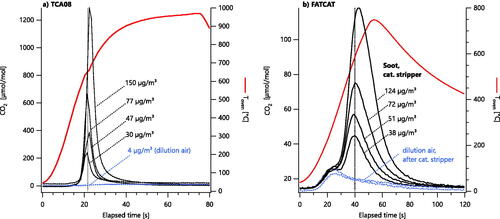
The baselines shown in are sample blanks: the entire system was operated as usual, but with the soot generator flows off. Blank signals are attributable to gas-phase organics present in the dilution air (filtered laboratory compressed air line) or from contaminants evaporating from contamination of the sampling lines (i.e., from previous studies in our laboratory). The TCA08 blank signal appears to be much smaller than the FATCAT blank signal, which we will show () is due to the lower response factor of the TCA08 to organic samples. Although we employed a catalytic stripper (recently serviced by the manufacturer) to minimize organic contamination, it is very difficult to completely remove all organics, and the fact that some organics were still measured on the sampled filters is consistent with our earlier work (which also used a recently serviced stripper) (Corbin et al. Citation2020a).
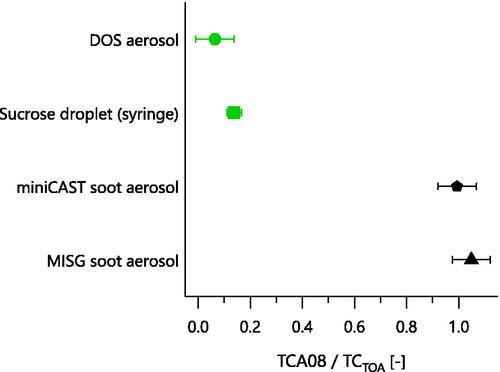
Figure 3. Response factor of the TCA08 relative to TOA TC, for various samples. Differences are due to the lack of a CO2 oxidation catalyst in the TCA08. All samples were measured from laboratory aerosols, except the sucrose droplet. The sucrose droplet was placed directly onto the filter using a syringe, following standard TOA calibration procedures. All aerosol-based TC concentrations were corrected for gas-phase organics. Aerosol error bars show the 7.8% TC repeatability reported by Sipkens et al. Citation2024 (accepted); sucrose error bars show the repeatability of 3% obtained in our laboratory.
Significantly, the thermograms in do not change shape with sample loading. This indicates that the thermograms observed in both instruments are both indicative of the rate of oxidation of the sample and not the mass transfer of oxygen to the particles on the filters (Song et al. Citation2006). We note that the CO2 signal had not returned to baseline by the end of the FATCAT heating period, and therefore returned to baseline more slowly than it would otherwise have done. This caused a “broader” peak that could nevertheless be integrated to yield total carbon from the filter. In future studies, the duration of the heating period could be extended to accommodate higher sample loadings, or simply left unchanged, as broader peaks may assist with distinguishing different sample materials.
Calibration and response factors
FATCAT
The FATCAT was calibrated by comparing the readings of its internal LI-COR 840 A CO2 analyzer to reference cylinders containing 0, 8000, and Equation1(1)
(1) 6,000 µmol/mol CO2.
TCA08
The TCA08 was calibrated differently to the FATCAT because its removable quartz filters allowed us to mimic our laboratory calibration procedure for TOA with the TCA08. That procedure uses a known volume of a sucrose solution of known mass, dispensed from an analytical syringe and is described further below. We also performed calibrations by collecting DOS and soot aerosols (both MISG and miniCAST) on filters samples for both the TOA and TCA08.
The TCA08 response factor for a reference substance
was calculated by reference to TOA TC as
(1)
(1)
shows that for the TCA08, the measured sucrose response factor was approximately 0.1 for sucrose and DOS, while it was approximately Equation1(1)
(1) .0 for soot from two laboratory propane flames (MISG and miniCAST). Additional experiments showed that the TCA08 response factor was similar for solid sucrose aerosols, liquid sucrose aerosols, and bulk sucrose solution (described further in the supplementary information and shown in Figure S2), and that the soot response factor did not change for bulk soot (scraped from the wall of the miniCAST exhaust lines) vs. soot aerosol. The observed differences are therefore due to the materials involved, not differences in the sampling procedures.
We have high confidence in our TOA measurements for multiple reasons: (i) our laboratory is ISO/IEC Equation1(1)
(1) 7025:2017 compliant; (ii) TOA TC is not subject to any of the artifacts noted in the introduction regarding TOA EC and TOA OC; (iii) we have previously obtained TOA results in good agreement with the consensus value of an inter-laboratory comparison (Sipkens et al. Citation2024); and (iv) we have recently demonstrated closure between TOA and an independent, traceable measurement of total PM mass (Corbin et al. Citation2020a). We have also recently obtained consistent results between our TOA EC and multiple BC measurement techniques for diesel soot (Corbin et al. Citation2020b).
The variable response factors of the TCA08 for sucrose and DOS were observed because these substances do not form CO2 upon heating, but rather thermally decompose into organics or CO (e.g., Zhou et al. Citation2014) or evaporate (DOS boils at Equation2(2)
(2) 56 °C; Equation2
(2)
(2) ) upon heating. While the FATCAT contains an oxidation catalyst to convert these gases to CO2, the TCA08 does not and therefore misses their contribution to the total carbon. Therefore, the ratio TCTCA08/TCTOA or TCTCA08/TCFATCAT approximately quantifies the fraction of CO2 which resulted from heating these substances at >700 K min−1, which was about Equation1
(1)
(1) 5% for DOS and Equation2
(2)
(2) 0% for sucrose.
It is not surprising that the TCA08 response factor was closer to Equation1(1)
(1) .0 for soot than for the organic substances, since the oxidation of soot leads primarily to CO and CO2 production via heterogeneous reaction, with relatively more CO2 produced at higher temperatures (Li and Brown Citation2001). Since the TCA08 response factor was close to Equation1
(1)
(1) .0, our data suggest negligible production of CO, or any other carbonaceous gases, during RTPO within the TCA08. This is in contrast to the data of Bladt et al. (Citation2012), who reported a [CO]/[CO2] ratio of 0.65 for propane soot using standard TPO at 5 K min−1. Our data rule out the possibility of such a high relative production of CO. The difference is most likely due to our faster heating rates, as the [CO]/[CO2] ratio falls with increasing temperature (Li and Brown Citation2001).
Comparison of the laboratory TCA08 response factor to atmospheric observations from literature
shows the measurement bias observed for TCTCA08 and for TCFATCAT for a external mixtures of OM (dioctyl sebacate) and soot, in varying proportions. TCFATCAT is independent of the OM/soot ratio, while TCTCA08 decreases linearly with an increasing OM/soot ratio, for this sample, due to the lack of an oxidation catalyst in the TCA08.
Figure 4. Reported FATCAT and TCA08 signals for various mixtures of liquid organics (dioctyl sebacate) and soot. Error bars represent propagated standard errors. The organics and soot were loaded sequentially onto the filters, so the observed trend is attributable to the difference in sensitivity of the TCA08 to soot and organics (), and not to mixing state effects. Also show are atmospheric PM data from an urban site (Rigler et al. Citation2020), which do not follow the liquid-organic trend, implying a significant difference in physical properties, such as viscosity.
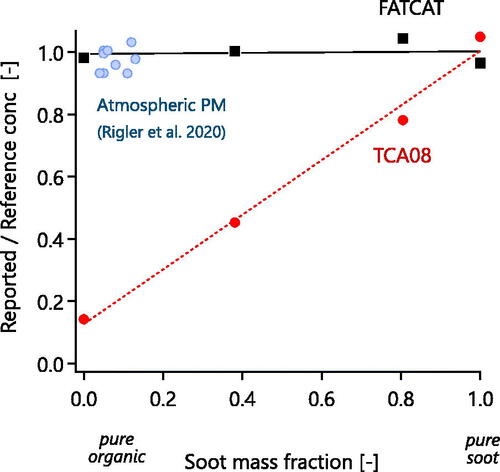
The linear trend observed in was not reported for atmospheric samples in a recent study by Rigler et al. (Citation2020). Those authors compared TCTCA08 with TCTOA for Equation2(2)
(2) 4-h-integrated filter samples from an urban background site in Ljubljana, Slovenia. Agreement between their two Equation2
(2)
(2) 4-h data sets was excellent overall, with a TCTCA08/TCTOA ratio of Equation1
(1)
(1) .00 ± 0.02 (mean ± st. dev.) for samples with EC/TC of 0.17 ± 0.07 (mean ± st. dev.Footnote1).
The TCTCA08/TCTOA and EC/TCTOA from Rigler et al. (Citation2020) are plotted in for cases where their TCTOA concentration was above 5 µg m−3. At lower concentrations, their TCTCA08/TCTOA became biased due to organic adsorption onto the TCA08 filter, according to the discussion of Rigler et al. (Citation2020). shows that Rigler et al. (Citation2020) saw good agreement between TCA08 and TOA (TCTCA08/TCTOA close to Equation1(1)
(1) .0) at soot mass fractions for which our own data show large biases. This inconsistency indicates a substantial difference between the physico-chemical properties of the ambient OM in Ljubljana compared with our two laboratory surrogates, sucrose and hexadecane.
Potential causes of the difference in TCA08 response factors between laboratory and atmospheric OM
Our laboratory surrogates represent two extremes of organic composition, one being highly oxygenated, and the other being a saturated hydrocarbon. While sucrose is a good proxy for water-soluble organic carbon (e.g., Pratap et al. Citation2021) alkanes like hexadecane are surrogates for a large fraction of e.g. diesel-exhaust compounds (e.g., Lim et al. Citation2015) or for aerosols from cooking (Abdullahi, Delgado-Saborit, and Harrison Citation2013). While sucrose is solid at room temperature, hexadecane is liquid; so, the difference cannot be attributed to any influence of phase during filter sampling. Also, we showed in Section S1.1 that phase and size effects were minor.
Instead, the difference may be due to a difference in volatility or viscosity of the atmospheric OM. We assume that the Ljubljana OM was secondary, considering the “urban background” nature of the site. Extractive electrospray mass spectrometry indicates molecules masses of about Equation2(2)
(2) 00 amu for α-pinene secondary OM (often called secondary organic aerosol; SOA) (Lee et al. Citation2020), which is comparable with the mass of hexadecane (226.445 amu). Therefore, the difference must be related to chemical properties, such as vapor pressure. However, heating secondary OM in a thermodenuder results in its almost complete evaporation below Equation2
(2)
(2) 00 °C (Salo et al. Citation2011), which is below the boiling point of hexadecane (287 °C).
We therefore hypothesize that the formation of an metastable highly viscous (glassy) (Reid et al. Citation2018), potentially oligomerized phase of SOA, slowed its evaporation in the TCA08, for the Ljublana atmospheric OM. This resulted in a very high fraction of heterogeneous combustion, which led to a high production of CO2 (as noted above) and a TCA08 response factor close to Equation1(1)
(1) .0. Heterogeneous combustion is required to explain our results because it is extremely unlikely that the gas-phase oxidation of the organics produced by heating SOA is much slower than the same oxidation of organics produced by heating sucrose (which will contain some pyrolysis products).
These observations suggest that future RTPO studies on SOA should explore slower cooling rates, and explore the possibility that thermograms obtained at different rates may contain useful physical information.
Response factors for soot with varying degree of graphitization (maturity)
shows the ratio TCTCA08/TCAFATCAT for miniCAST soot produced at varying setpoints. Circles show TCTCA08/TCAFATCAT with no sample conditioning. Squares show conditioning with a catalytic stripper, representing nvTCTCA08/nvTCFATCAT. Both data sets show consistent results for all miniCAST setpoints, with some variability due to uncertainty in the measurements.
Figure 5. FATCAT/TCA08 mass concentration ratio for various miniCAST setpoints. The miniCAST setpoints, defined elsewhere (Malmborg et al. Citation2019), correspond to soot at various stages of maturity: higher OCTOA/TCTOA (grey bars) indicates a lower maturity. This figure shows the TCA08 and FATCAT remaining in good agreement even at OCTOA/TCTOA of 0.6 (circles and diamonds), in contrast to . Therefore, the TCA08 response factor differs between pyrolysis-generated OCTOA and organic-related OCTOA. The blue triangles and blue lines illustrate TCA08 response factors of 0.1 (dotted) and Equation1(1)
(1) .0 (solid) for OCTOA, respectively (EquationEquation (2
(2)
(2) ), with shading showing ± 0.1 uncertainty.
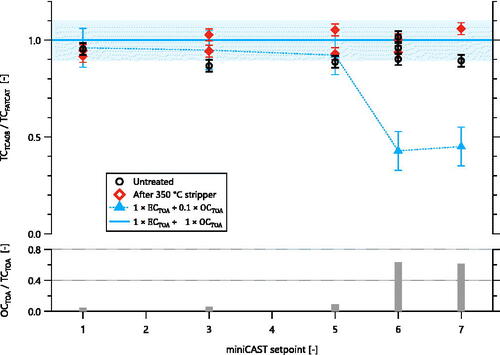
The observed TCTCA08/TCAFATCAT of Equation1(1)
(1) .0 for all miniCAST setpoints stands in contrast to the OC/TC ratio measured by TOA for these setpoints (Malmborg et al. Citation2019), shown by the grey bars in . According to the low sensitivity of the TCA08 to organics shown in and , it would have been predicted that the TCTCA08/TCAFATCAT ratio would drop to about 0.4 for miniCAST setpoint 7, since that setpoint had an OCTOA/TCTOA ratio of 0.6, and since the response factors
from would result in the following weighting of the TCA08 signal:
(2)
(2)
Where and
from . This prediction is shown with blue diamonds in and does not agree with the data. However, assuming
results in excellent agreement with the results. This suggests that the fraction of the miniCAST particles associated with OCTOA is a material closer to solid carbon than organic matter, as corroborated by the thermograms discussed below ().
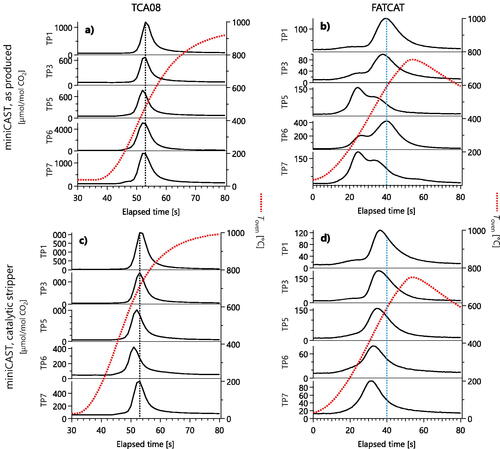
Figure 6. Thermograms of various miniCAST setpoints measured with the TCA08 (a,c) and FATCAT (b,d), without catalytic stripper (a,b) and with (c,d). Absolute signals varied due partly to varying mass concentrations of the sample. The TCA08 data for untreated soot do not show organic peaks because the TCA08 response factor to organics is an order of magnitude smaller. Vertical lines are reproduced in to facilitate comparison.
Since the OCTOA/TCTOA ratio of 0.6 was measured after organic removal in the catalytic stripper, it is clear that OCTOA in represents volatile compounds formed within the TOA instrument via the pyrolysis of young (partially graphitized) soot particle, and not preexisting organics condensed on the particle surface (i.e., OM). These pyrolytic compounds would have formed from the decomposition of the soot particle itself (Corbin et al. Citation2015 and references therein; Matuschek et al. Citation2007). They could not have formed from the pyrolysis of low-volatility organics (i.e., organics that were not removed at 350 °C) because the sample OC/TC > 0.6 would correspond to an organic mass fraction close to 50% of the particle volume, which would correspond to a core-shell morphology that was not observed in electron micrograph of miniCAST soot (Malmborg et al. Citation2019). Therefore, the observed OC must represent the pyrolysis of a material that is solid but does not produce EC during TOA analysis.
Our interpretation is corroborated by previous studies, where the OC observed in tarball-containing samples with negligible OM content (organics were removed by solvent extraction) was shown via mass spectrometry to correspond to smaller molecules, and therefore was formed via pyrolysis (Corbin et al. Citation2019). Pyrolysis can be inferred when smaller molecules are observed at higher TOA heating temperatures because larger molecules would have been expected if vapourization of inert compounds was occurring (Nespor et al. Citation2021; Sapcariu et al. Citation2016). Our conclusions are consistent with previous work using laser-vapourizer mass spectrometry, high-resolution TEM, and measurements of the wavelength dependence of light-absorption (Corbin et al. Citation2014; Malmborg et al. Citation2019; Maricq Citation2014; Ngo et al. Citation2020; Schnaiter et al. Citation2006; Török et al. Citation2018).
Thermograms of miniCAST nanoparticles
shows thermograms of the miniCAST nanoparticles discussed in the preceding subsection. For “as produced” samples (no conditioning except for dilution), the FATCAT data () show either one or two peaks, with two peaks being more prominent for the high OC/TC miniCAST setpoints TP6 and TP7. The lower-temperature FATCAT peaks are likely due to OM. This OM was likely comprised of polyaromatic hydrocarbons, as measured by previous mass spectrometry studies on soot from quenched flames (Slowik et al. Citation2004). After the catalytic stripper (), the OM peaks disappear, confirming that they were volatile below 350 °C.
In the corresponding TCA08 data () only a single peak is visible, except at setpoint 7 where a very small left shoulder appears next to the main peak. This is consistent with the low TCA08 response factor to OM (). The presence of a first peak in the FATCAT data, but not the TCA08 data therefore re-confirms our interpretation of that peak as representing OM. After the catalytic stripper (), the TCA08 data show a negligible change, and the small left shoulder at TP 7 disappears.
These thermograms confirm the physical interpretation described in the previous section. That is, the FATCAT response to OM and nonvolatile carbon is similar, while the TCA08 response to OM is negligible. Therefore, the FATCAT sees a lower-temperature peak for miniCAST setpoints TP5, TP6, TP7 due to OM, which the TCA08 does not see. In contrast, the TCA08 sees similar thermograms to the FATCAT for post-stripper samples, even though their OCTOA/TCTOA ratio for the nonvolatile fraction of this sample is >0.5, because the “OC” and “EC” components of nonvolatile miniCAST PM do not represent a two-component system with two different volatilities. Rather, the OCTOA of miniCAST PM would represent the partial pyrolysis of young soot (defined above), which may yield substantial pyrolyzed carbon during the inert phase of TOA without increasing the sample’s light absorption sufficiently for the “optical” correction of TOA to account for.
Thermograms of liquid carbons
summarizes experiments designed to investigate whether RTPO thermograms display systematic trends with molecular structure. The figure shows thermograms for a range of carbonaceous aerosols, selected to represent a range of thermal stabilities and degrees of carbonization. All of the samples in were sampled from the aerosol phase. We aimed to sample a similar total mass of each material (i.e., to produce similar maximum CO2 signals at the detector), though this was not always possible. The properties of each material are summarized in Equation2(2)
(2) , and will be discussed below.
Figure 7. Thermograms of various materials measured with the TCA08 (a) and FATCAT (b). The differences in profiles relate to the physical differences between the instruments (conductive vs inductive heating, quartz vs metal filter, and no-catalyst vs catalyst, for TCA08 and FATCAT respectively). Vertical axes in (b) specify the solvent, if any, as H2O (water), or EtOH (ethanol), or none (the pure liquid was nebulized). Note that not all vertical axes are identical; exceptions are highlighted in blue. Dashed line represents a measurement with a cold oxidation catalyst.
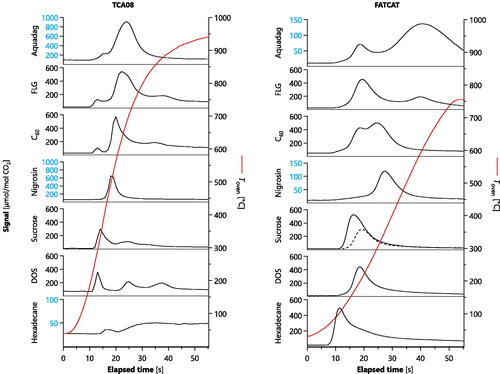
Four of the samples shown in are organic substances. Hexadecane and dioctyl sebacate (DOS) are thermally stable compounds. Hexadecane is a non-polar alkane, DOS is a weakly polar diester; minimal pyrolysis is expected for both. In contrast, substantial pyrolysis is expected upon heating of sucrose (Zhou et al. Citation2014) and nigrosine (Sedlacek et al. Citation2018), both of which contain a substantial mole fraction of oxygen.
The FATCAT thermogram of DOS (boiling point Equation2(2)
(2) 56 °C) shows a single peak later in time than hexadecane (boiling point Equation2
(2)
(2) 87 °C), which is inverse to their order of boiling points. We hypothesize that this reflects a higher surface-area-to-volume ratio for hexadecane relative to DOS, due to our nebulizer producing Equation1
(1)
(1) 5 nm particles for hexadecane (surface-area-to-volume = 0.40) versus 35 nm particles for DOS (0.17). The possibility of different penetration depths into the filter for each liquid is ruled out, since the smaller hexadecane particles would have diffused deeper into the filter and their thermograms should then have peaked later, not earlier, if this was a limiting factor.
The FATCAT thermogram of sucrose also shows a single peak, in spite of the fact that sucrose pyrolyzes easily upon heating. We suggest that this is due to the rapid and homogeneous heating afforded by the inductive heater of the FATCAT, in contrast to the time needed for heat to diffuse through the sample in the TCA08. This trend is consistent with our observations for miniCAST soot discussed above, which produces large OC signals during TOA due to pyrolysis.
We also obtained a FATCAT thermogram for sucrose with the oxidation catalyst switched off (dashed line in ). This resulted in a lower CO2 signal initially, but similar CO2 signals once temperatures exceeded Equation2(2)
(2) 00 °C. The lower initial signal is expected, as the cold catalyst would have allowed OM or CO from the sample to reach the detector before being converted to CO2. The similarity of the two thermograms at high temperatures indicates that, at high temperatures, most carbon was already leaving the filter as CO2 and did not need catalytic oxidation. This would have occurred, for example, if the latter half of the sucrose thermogram reflected the oxidation of carbonized residues after initial pyrolysis. We note that the catalyst may have been partially active even without heating.
The FATCAT thermogram of nigrosine occurs at a much higher temperature than the thermogram of sucrose, which is consistent with a continuous-wave laser-induced incandescence study showing that nigrosine can carbonize to form highly refractory material (Sedlacek et al. Citation2018).
The TCA08 thermograms of DOS and hexadecane do not display single peaks, in spite of being (nominally) pure substances. The same is true of the TCA08 thermogram of sucrose, which is less surprising, since sucrose pyrolyzes easily. The two peaks shown by sucrose may reflect an initial pyrolysis stage (where a large amount of OM was produced but only a small fraction was transformed to CO2) followed by heterogeneous oxidation of the carbonized residues produced by pyrolysis (where heterogeneous oxidation led to a high fraction of CO2, as discussed above). This continuous process would lead to the appearance of two peaks for sucrose.
Hexadecane produced negligible signals in the TCA08 as the oxygen-free alkane molecules appear to have evaporated before reaction with gas-phase oxygen could produce CO2. For DOS and sucrose, the preexisting oxygen content of the molecules would have allowed for intramolecular oxidation. Note that hexadecane was plotted on an axis with an order-of-magnitude smaller scale in .
The three peaks shown by DOS might be hypothesized to also reflect an initial and secondary stage of pyrolysis, followed by heterogeneous oxidation of any residues. This hypothesis is consistent with the concepts behind the optical correction in TOA. However, TOA measurements on concurrent samples did not display a substantial darkening during the inert phase.
Moreover, we disproved the DOS-pyrolysis hypothesis by measuring DOS sampled in bulk, rather than in the aerosol phase. The bulk sample was prepared by placing a few drops of DOS onto a pre-fired quartz filter, then dabbing a second pre-fired filter onto the first. (The dabbing procedure was necessary to avoid overloading the instrument.) The resulting bulk-DOS thermogram showed a single peak at the same location as the first aerosol-DOS peak, at a similar intensity. This rules out the possibility that the multiple aerosol-phase peaks were due to pyrolysis. Instead, this difference between phases may reflect differences in mass transfer rates due to differences in the physical dispersion of the material. Specifically, the bulk phase may have formed an even coating on the quartz filter leading to one peak, whereas the aerosol phase may have formed multiple structures, including a wetting of the filter (by some aerosol particles) for the peak coincident with the bulk phase and a deeper penetration of the filter (by other aerosol particles), leading to a delayed heating by the conductive heater of the TCA08. This proposed mechanism also explains why the FATCAT only observed a single DOS peak, since its inductive heater would not lead to such a delayed heating mechanism, but rather heat all DOS in contact with the filter simultaneously.
Thermograms of solid carbons
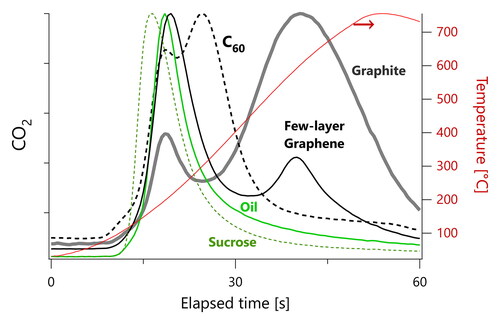
The upper 3 panels in show RTPO thermograms for C60 crystals and few-layer graphene (FLG), both suspended in high-purity ethanol, as well as Aquadag (colloidal graphite containing several mass percent of tannic acids) diluted with deionized water.
The TCA08 thermograms show peaks for Aquadag, C60, and FLG earlier than for soot; the soot thermograms in all contained a single peak at elapsed times of 55 s (TCA08) or 35 s (FATCAT). In , these three substances show a primary peak at about Equation2(2)
(2) 5 s for the TCA08. In contrast, the FATCAT shows dual peaks for Aquadag and FLG at about Equation2
(2)
(2) 0 s and 40 s. The FATCAT C60 thermogram also shows dual peaks, but at about Equation2
(2)
(2) 0 s and Equation2
(2)
(2) 5 s.
We interpret any peak seen by the FATCAT but not the TCA08 as due to OM, as demonstrated above for three types of OM: DOS, sucrose, and miniCAST-produced organics. Therefore, in our “solid carbon” samples, the OM signals may reflect (i) adsorption of residual OM from our sampling lines onto the solid carbons’ surfaces, (ii) solvent residues from the nebulization process, (iii) impurities from the production of each material, or (iv) surface functional groups. Although we used a catalytic stripper to minimize issues (i) to (iii), we have found in previous work that the complete removal of OM is difficult to achieve, as discussed above.
Implications and conclusions
In-instrument oxidation catalyst and pre-sampling catalytic stripper
The TCA08 and FATCAT employ similar rapid heating (RTPO) methods, while possessing significant design differences, particularly in the heating method (radiative and conductive heating versus inductive heating in the TCA08 and FATCAT, respectively) and choice of oxidation catalyst (present in the FATCAT only). The absence of an oxidation catalyst in the TCA08 was shown to leave this instrument approximately Equation1(1)
(1) 0-fold less sensitive to OM for three different OM samples in Section “Calibration and response factors” (DOS; sucrose; and miniCAST propane-flame organics, which are likely polyaromatic hydrocarbons). This lowered sensitivity could be an advantage when the TCA08 is employed for the detection of nvTC, as intended in this study, in which case OM is considered an unwanted contaminant. However, care should be taken with this approach, since some nvTC may generate CO in addition to CO2, which may go undetected.
Alternatively, the FATCAT can be used in combination with a catalytic stripper to remove OM. When organic signals are of interest, for example, when measuring TC, the FATCAT may be used without a catalytic stripper. However, without a catalytic stripper, the activated-carbon denuder recommended by the FATCAT manufacturer should be used to minimize gas-phase-organic artifacts (Keller et al. Citation2023).
In summary, the TCA08 is most suited for measuring the TC content of nonvolatile samples such as soot, whereas the FATCAT is suitable for a broad range of soot and OM samples, including complex mixtures. An important caveat is the potential for atmospheric OM to behave differently in the TCA08 than our laboratory OM samples (Sections “Comparison of the laboratory TCA08 response factor to atmospheric observations from literature” and “Potential causes of the difference in TCA08 response factors between laboratory and atmospheric OM”).
Utility of RTPO thermograms
For our samples of known, pure materials, we obtained relatively complex RTPO thermograms. The TCA08 thermograms of pure organic liquids contained multiple peaks, which were due to the temperature-dependent competition between carbon evaporating as OM and carbon combusting (most likely heterogeneously) to form CO2. The FATCAT thermograms of pure organic liquids contained single peaks that were not in order of boiling point and may have been influenced by particle size. Finally, the FATCAT thermograms of nebulized solid-carbon nanoparticles showed a very high adsorption of OM due to their high surface area.
Overall, demonstrates the ability of both the FATCAT and the TCA08 to resolve materials of different chemical structure according to their thermograms, consistent with the TPO literature reviewed in the introduction. Future work will be needed to establish whether quantitative analyses of these thermograms can aid in the differentiation of carbon PM obtained from different sources. A key question is the reproducibility of these thermograms, which, if sufficient, would allow the thermograms of unknown samples to be related statistically to different sources of carbonaceous PM.
Scientific insights from RTPO thermograms
A number of scientific insights were gained from the analysis of RTPO thermograms for different materials:
The rapid heating of liquid aerosols may not result in desorption according to boiling point, but according to particle size (section “Thermograms of liquid carbons”).
The rapid heating of organic aerosols of very different composition (DOS, sucrose, and polyaromatic hydrocarbons) produced mainly OM rather than CO2, yet the rapid heating of atmospheric OM from an urban background site produced mainly CO2. This indicates that the atmospheric OM had a very low evaporation rate, likely due to a high viscosity, such that heterogeneous oxidation could take place (section “Comparison of the laboratory TCA08 response factor to atmospheric observations from literature”).
Young soot particles (produced by a miniCAST quenched-propane flame and denuded at 350 °C) have a high OC/TC (i.e., OCTOA/TCTOA) ratio because the slow heating during TOA allows adequate time for pyrolysis, not because of low-volatility organics (section “Thermograms of miniCAST nanoparticles”).
Author contributions
Conceptualization – JCC; Investigation – DC, JCC; Formal analysis – DC, JCC; Methodology – JCC, DC, GJS; Writing original draft – JCC; Writing review and editing – JCC, GJS.
Supplemental Material
Download MS Word (4 MB)Acknowledgements
This article is dedicated to our late colleague Daniel Clavel, who, in his own words, “thoroughly enjoyed” obtaining the measurements. We are grateful to Pacwill Environmental (Canada) for the loan of the TCA08, Aerosol d.o.o. (Slovenia) for technical support for the TCA08, and Alejandro Keller (University of Northwestern Switzerland) for the loan and for technical support of the FATCAT. We thank Brett Smith (National Research Council Canada) for technical assistance.
Disclosure statement
No potential conflict of interest was reported by the authors.
Additional information
Funding
Notes
1 We obtained these EC/TC values, and the distributions plotted in our , by re-analyzing the data published in of Rigler et al. (Citation2020). In Figure 6, we calculated the soot mass fraction using an EC/soot ratio of 0.9, representing the mass fraction of carbon in soot (Corbin et al., Equation2(2)
(2) 020) and an OM/OC ratio of Equation1
(1)
(1) .8 (calculated using the data of Rigler et al. Citation2020).
References
- Aakko-Saksa, P., P. Koponen, M. Aurela, H. Vesala, P. Piimäkorpi, T. Murtonen, O. Sippula, H. Koponen, P. Karjalainen, N. Kuittinen, et al. 2018. Considerations in analysing elemental carbon from marine engine exhaust using residual, distillate and biofuels. J. Aerosol Sci. 126:191–204. doi: 10.1016/j.jaerosci.2018.09.005.
- Abdullahi, K. L., J. M. Delgado-Saborit, and R. M. Harrison. 2013. Emissions and indoor concentrations of particulate matter and its specific chemical components from cooking: A review. Atmos. Environ. 71:260–94. doi: 10.1016/j.atmosenv.2013.01.061.
- Adachi, K., A. J. Sedlacek, L. Kleinman, S. R. Springston, J. Wang, D. Chand, J. M. Hubbe, J. E. Shilling, T. B. Onasch, T. Kinase, et al. 2019. Spherical tarball particles form through rapid chemical and physical changes of organic matter in biomass-burning smoke. Proc. Natl. Acad. Sci. U.S.A. 116 (39):19336–41. doi: 10.1073/pnas.1900129116.
- Adachi, K., S. H. Chung, and P. R. Buseck. 2010. Shapes of soot aerosol particles and implications for their effects on climate. J. Geophys. Res. 115 (D15):D15206. doi: 10.1029/2009JD012868.
- Bauer, J. J., X.-Y. Yu, R. Cary, N. Laulainen, and C. Berkowitz. 2009. Characterization of the Sunset semi-continuous carbon aerosol analyzer. J. Air Waste Manag. Assoc. 59 (7):826–33. doi: 10.3155/1047-3289.59.7.826.
- Bell, D. M., J. Zhang, J. Top, S. Bogler, M. Surdu, J. G. Slowik, A. S. H. Prevot, and I. El Haddad. 2023. Sensitivity constraints of extractive electrospray for a model system and secondary organic aerosol. Anal. Chem. 95 (37):13788–95. doi: 10.1021/acs.analchem.3c00441.
- Birch, M. E., and R. A. Cary. 1996. Elemental carbon-based method for monitoring occupational exposures to particulate diesel exhaust. Aerosol Sci. Technol. 25 (3):221–41. doi: 10.1080/02786829608965393.
- Bladt, H., J. Schmid, E. D. Kireeva, O. B. Popovicheva, N. M. Perseantseva, M. A. Timofeev, K. Heister, J. Uihlein, N. P. Ivleva, and R. Niessner. 2012. Impact of Fe content in laboratory-produced soot aerosol on its composition, structure, and thermo-chemical properties. Aerosol Sci. Technol. 46 (12):1337–48. doi: 10.1080/02786826.2012.711917.
- Bond, T. C., D. G. Streets, K. F. Yarber, S. M. Nelson, J.-H. Woo, and Z. Klimont. 2004. A technology-based global inventory of black and organic carbon emissions from combustion. J. Geophys. Res. 109 (D14):D14203–D14203. doi: 10.1029/2003JD003697.
- Bond, T. C., S. J. Doherty, D. W. Fahey, P. M. Forster, T. Berntsen, B. J. DeAngelo, M. G. Flanner, S. Ghan, B. Kärcher, D. Koch, et al. 2013. Bounding the role of black carbon in the climate system: A scientific assessment. JGR Atmospheres 118 (11):5380–552. doi: 10.1002/jgrd.50171.
- Canagaratna, M. R., J. L. Jimenez, J. H. Kroll, Q. Chen, S. H. Kessler, P. Massoli, L. Hildebrandt Ruiz, E. Fortner, L. R. Williams, K. R. Wilson, et al. 2015. Elemental ratio measurements of organic compounds using aerosol mass spectrometry: Characterization, improved calibration, and implications. Atmos. Chem. Phys. 15 (1):253–72. doi: 10.5194/acp-15-253-2015.
- Cappa, C. D., X. Zhang, L. M. Russell, S. Collier, A. K. Y. Lee, C.-L. Chen, R. Betha, S. Chen, J. Liu, D. J. Price, et al. 2019. Light absorption by ambient black and brown carbon and its dependence on black carbon coating state for two california, USA, cities in winter and summer. JGR. Atmospheres 124 (3):1550–77. doi: 10.1029/2018JD029501.
- Cavalli, F., M. Viana, K. E. Yttri, J. Genberg, and J. P. Putaud. 2010. Toward a standardised thermal-optical protocol for measuring atmospheric organic and elemental carbon: The EUSAAR protocol. Atmos. Meas. Tech. 3 (1):79–89. doi: 10.5194/amt-3-79-2010.
- Chow, J. C., J. G. Watson, L. W. A. Chen, M. C. O. Chang, N. F. Robinson, D. Trimble, and S. Kohl. 2007. The improve_a temperature protocol for thermal/optical carbon analysis: Maintaining consistency with a long-term database. J. Air Waste Manag. Assoc. 57 (9):1014–23. doi: 10.3155/1047-3289.57.9.1014.
- Corbin, J. C., A. Moallemi, F. Liu, S. Gagné, J. S. Olfert, G. J. Smallwood, and P. Lobo. 2020a. Closure between particulate matter concentrations measured ex situ by thermal–optical analysis and in situ by the CPMA–electrometer reference mass system. Aerosol Sci. Technol. 54 (11):1293–309. doi: 10.1080/02786826.2020.1788710.
- Corbin, J. C., B. Sierau, M. Gysel, M. Laborde, A. Keller, J. Kim, A. Petzold, T. B. Onasch, U. Lohmann, and A. A. Mensah. 2014. Mass spectrometry of refractory black carbon particles from six sources: Carbon-cluster and oxygenated ions. Atmos. Chem. Phys. 14 (5):2591–603. doi: 10.5194/acp-14-2591-2014.
- Corbin, J. C., H. Czech, D. Massabò, F. B. de Mongeot, G. Jakobi, F. Liu, P. Lobo, C. Mennucci, A. A. Mensah, J. Orasche, et al. 2019. Infrared-absorbing carbonaceous tar can dominate light absorption by marine-engine exhaust. NPJ Clim. Atmos. Sci. 2:12. doi: 10.1038/s41612-019-0069-5.
- Corbin, J. C., T. Schripp, B. E. Anderson, G. J. Smallwood, P. LeClercq, E. C. Crosbie, S. Achterberg, P. D. Whitefield, R. C. Miake-Lye, Z. Yu, et al. 2022. Aircraft-engine particulate matter emissions from conventional and sustainable aviation fuel combustion: Comparison of measurement techniques for mass, number, and size. Atmos. Meas. Tech. 15 (10):3223–42. doi: 10.5194/amt-15-3223-2022.
- Corbin, J. C., U. Lohmann, B. Sierau, A. Keller, H. Burtscher, and A. A. Mensah. 2015. Black carbon surface oxidation and organic composition of beech-wood soot aerosols. Atmos. Chem. Phys. 15 (20):11885–907. doi: 10.5194/acp-15-11885-2015.
- Corbin, J. C., W. Peng, J. Yang, D. E. Sommer, U. Trivanovic, P. Kirchen, J. W. Miller, S. N. Rogak, D. R. Cocker, G. J. Smallwood, et al. 2020b. Characterization of particulate matter emitted by a marine engine operated with liquefied natural gas and diesel fuels. Atmos. Environ. 220:117030. doi: 10.1016/j.atmosenv.2019.117030.
- Düngen, P., R. Schlögl, and S. Heumann. 2018. Non-linear thermogravimetric mass spectrometry of carbon materials providing direct speciation separation of oxygen functional groups. Carbon 130:614–22. doi: 10.1016/j.carbon.2018.01.047.
- Fuller, K. A., and S. M. Kreidenweis. 1999. Effects of mixing on extinction by carbonaceous particles. JGR Atmospheres 104 (D13):15941–54. doi: 10.1029/1998JD100069.
- Gagné, S., M. Couillard, Z. Gajdosechova, A. Momenimovahed, G. Smallwood, Z. Mester, K. Thomson, P. Lobo, and J. C. Corbin. 2021. Ash-decorated and ash-painted soot from residual and distillate-fuel combustion in four marine engines and one aviation engine. Environ. Sci. Technol. 55 (10):6584–93. doi: 10.1021/acs.est.0c07130.
- Giechaskiel, B., M. Maricq, L. Ntziachristos, C. Dardiotis, X. Wang, H. Axmann, A. Bergmann, and W. Schindler. 2014. Review of motor vehicle particulate emissions sampling and measurement: From smoke and filter mass to particle number. J. Aerosol Sci. 67:48–86. doi: 10.1016/j.jaerosci.2013.09.003.
- Herold, F., J. Gläsel, B. J. M. Etzold, and M. Rønning. 2022. Can temperature-programmed techniques provide the gold standard for carbon surface characterization? Chem. Mater. 34 (19):8490–516. doi: 10.1021/acs.chemmater.2c02449.
- Huntzicker, J. J., R. L. Johnson, J. J. Shah, and R. A. Cary. 1982. Analysis of organic and elemental carbon in ambient aerosols by a thermal-optical method. In Particulate carbon, 79–88. Boston, MA: Springer US.
- Jimenez, J. L., M. R. Canagaratna, N. M. Donahue, A. S. H. Prevot, Q. Zhang, J. H. Kroll, P. F. DeCarlo, J. D. Allan, H. Coe, N. L. Ng, et al. 2009. Evolution of organic aerosols in the atmosphere. Science 326 (5959):1525–9. doi: 10.1126/science.1180353.
- Karanasiou, A., E. Diapouli, F. Cavalli, K. Eleftheriadis, M. Viana, A. Alastuey, X. Querol, and C. Reche. 2011. On the quantification of atmospheric carbonate carbon by thermal/optical analysis protocols. Atmos. Meas. Tech. 4 (11):2409–19. doi: 10.5194/amt-4-2409-2011.
- Kelesidis, G. A., and S. E. Pratsinis. 2019. Estimating the internal and surface oxidation of soot agglomerates. Combust. Flame 209:493–9. doi: 10.1016/j.combustflame.2019.08.001.
- Keller, A., P. Specht, P. Steigmeier, and E. Weingartner. 2023. A novel measurement system for unattended, in-situ characterisation of carbonaceous aerosols. Aerosol Research 1 (1):65–79. doi: 10.5194/ar-1-65-2023.
- Lee, C. P., M. Riva, D. Wang, S. Tomaz, D. Li, S. Perrier, J. G. Slowik, F. Bourgain, J. Schmale, A. S. H. Prevot, et al. 2020. Online aerosol chemical characterization by extractive electrospray ionization–ultrahigh-resolution mass spectrometry (EESI-Orbitrap). Environ. Sci. Technol. 54 (7):3871–80. doi: 10.1021/acs.est.9b07090.
- Li, C. E., and T. C. Brown. 2001. Carbon oxidation kinetics from evolved carbon oxide analysis during temperature-programmed oxidation. Carbon 39 (5):725–32. doi: 10.1016/s0008-6223(00)00189-5.
- Lim, J., C. Lim, S. Kim, and J. Hong. 2015. Characterizations of organic compounds in diesel exhaust particulates. J. Environ. Sci. (China) 34:171–83. doi: 10.1016/j.jes.2015.03.013.
- Lobo, P., L. Durdina, B. T. Brem, A. P. Crayford, M. P. Johnson, G. J. Smallwood, F. Siegerist, P. I. Williams, E. A. Black, A. Llamedo, et al. 2020. Comparison of standardized sampling and measurement reference systems for aircraft engine non-volatile particulate matter emissions. J. Aerosol Sci. 145:105557. doi: 10.1016/j.jaerosci.2020.105557.
- Ma, X., C. D. Zangmeister, and M. R. Zachariah. 2013. Soot oxidation kinetics: A comparison study of two tandem ion-mobility methods. J. Phys. Chem. C 117 (20):10723–9. doi: 10.1021/jp400477v.
- Malmborg, V. B., A. C. Eriksson, S. Török, Y. Zhang, K. Kling, J. Martinsson, E. C. Fortner, L. Gren, S. Kook, T. B. Onasch, et al. 2019. Relating aerosol mass spectra to composition and nanostructure of soot particles. Carbon 142:535–46. doi: 10.1016/j.carbon.2018.10.072.
- Maricq, M. M. 2014. Examining the relationship between black carbon and soot in flames and engine exhaust. Aerosol Sci. Technol. 48 (6):620–9. doi: 10.1080/02786826.2014.904961.
- Matuschek, G., E. Karg, A. Schröppel, H. Schulz, and O. Schmid. 2007. Chemical investigation of eight different types of carbonaceous particles using thermoanalytical techniques. Environ. Sci. Technol. 41 (24):8406–11. doi: 10.1021/es062660v.
- Michelsen, H. A., M. B. Colket, P.-E. Bengtsson, A. D'Anna, P. Desgroux, B. S. Haynes, J. H. Miller, G. J. Nathan, H. Pitsch, and H. Wang. 2020. A review of terminology used to describe soot formation and evolution under combustion and pyrolytic conditions. ACS Nano. 14 (10):12470–90. doi: 10.1021/acsnano.0c06226.
- Muller, P. 1994. Glossary of terms used in physical organic chemistry (IUPAC Recommendations 1994). Pure Appl. Chem. 66 (5):1077–184. doi: 10.1351/pac199466051077.
- Musikhin, S., S. Talebi-Moghaddam, J. C. Corbin, G. J. Smallwood, C. Schulz, and K. J. Daun. 2021. Crumpled few-layer graphene: Connection between morphology and optical properties. Carbon 182:677–90. doi: 10.1016/j.carbon.2021.06.052.
- Nash, D. G., T. Baer, and M. V. Johnston. 2006. Aerosol mass spectrometry: An introductory review. Int. J. Mass Spectrom. 258 (1–3):2–12. doi: 10.1016/j.ijms.2006.09.017.
- Nespor, B., R. Cochran, H. Jeong, F. Bowman, D. Delene, E. Kozliak, and A. Kubátová. 2021. Occurrence of both nonvolatile and semivolatile carbonaceous air particulate markers using thermal desorption-pyrolysis-gas chromatography-mass spectrometry. Atmos. Environ. 246:118058. doi: 10.1016/j.atmosenv.2020.118058.
- Ng, N. L., S. C. Herndon, A. Trimborn, M. R. Canagaratna, P. L. Croteau, T. B. Onasch, D. Sueper, D. R. Worsnop, Q. Zhang, Y. L. Sun, et al. 2011. An aerosol chemical speciation monitor (ACSM) for routine monitoring of the composition and mass concentrations of ambient aerosol. Aerosol Sci. Technol. 45 (7):780–94. doi: 10.1080/02786826.2011.560211.
- Ngo, L. D., D. Duca, Y. Carpentier, J. A. Noble, R. Ikhenazene, M. Vojkovic, C. Irimiea, I. K. Ortega, G. Lefevre, J. Yon, et al. 2020. Chemical discrimination of the particulate and gas phases of miniCAST exhausts using a two-filter collection method. Atmos. Meas. Tech. 13 (2):951–67. doi: 10.5194/amt-13-951-2020.
- Niessner, R. 2014. The many faces of soot: Characterization of soot nanoparticles produced by engines. Angew. Chem. Int. Ed. Engl. 53 (46):12366–79. doi: 10.1002/anie.201402812.
- Onasch, T. B., A. Trimborn, E. C. Fortner, J. T. Jayne, G. L. Kok, L. R. Williams, P. Davidovits, and D. R. Worsnop. 2012. Soot particle aerosol mass spectrometer: Development, validation, and initial application. Aerosol Sci. Technol. 46 (7):804–17. doi: 10.1080/02786826.2012.663948.
- Onasch, T. B., E. C. Fortner, A. M. Trimborn, A. T. Lambe, A. J. Tiwari, L. C. Marr, J. C. Corbin, A. A. Mensah, L. R. Williams, P. Davidovits, et al. 2015. Investigations of SP-AMS carbon ion distributions as a function of refractory black carbon particle type. Aerosol Sci. Technol. 49 (6):409–22. doi: 10.1080/02786826.2015.1039959.
- Pratap, V., A. E. Christiansen, A. G. Carlton, S. Lance, P. Casson, J. Dukett, H. Hassan, J. J. Schwab, and C. J. Hennigan. 2021. Investigating the evolution of water-soluble organic carbon in evaporating cloud water. Environ. Sci: Atmos. 1 (1):21–30. doi: 10.1039/D0EA00005A.
- Reid, J. P., A. K. Bertram, D. O. Topping, A. Laskin, S. T. Martin, M. D. Petters, F. D. Pope, and G. Rovelli. 2018. The viscosity of atmospherically relevant organic particles. Nat. Commun. 9 (1):956. doi: 10.1038/s41467-018-03027-z.
- Rigler, M., L. Drinovec, G. Lavrič, A. Vlachou, A. S. H. Prévôt, J. L. Jaffrezo, I. Stavroulas, J. Sciare, J. Burger, I. Kranjc, et al. 2020. The new instrument using a TC–BC (total carbon–black carbon) method for the online measurement of carbonaceous aerosols. Atmos. Meas. Tech. 13 (8):4333–51. doi: 10.5194/amt-13-4333-2020.
- Salo, K., M. Hallquist, Å. M. Jonsson, H. Saathoff, K.-H. Naumann, C. Spindler, R. Tillmann, H. Fuchs, B. Bohn, F. Rubach, et al. 2011. Volatility of secondary organic aerosol during OH radical induced ageing. Atmos. Chem. Phys. 11 (21):11055–67. doi: 10.5194/acp-11-11055-2011.
- Sapcariu, S. C., T. Kanashova, M. Dilger, S. Diabaté, S. Oeder, J. Passig, C. Radischat, J. Buters, O. Sippula, T. Streibel, et al. 2016. Metabolic profiling as well as stable isotope assisted metabolic and proteomic analysis of RAW 264.7 macrophages exposed to ship engine aerosol emissions: Different effects of heavy fuel oil and refined diesel fuel. PLoS One 11 (6):e0157964. doi: 10.1371/journal.pone.0157964.
- Schnaiter, M., M. Gimmler, I. Llamas, C. Linke, C. Jäger, and H. Mutschke. 2006. Strong spectral dependence of light absorption by organic carbon particles formed by propane combustion. Atmos. Chem. Phys. 6 (10):2981–90. doi: 10.5194/acp-6-2981-2006.
- Schönherr, E., K. Matsumoto, and M. Freiberg. 1999. On the evaporation of C60 in vacuum and inert gases at temperatures between 830 K and 1050 K. Fullerene Sci. Technol. 7 (3):455–66. doi: 10.1080/10641229909350294.
- Sedlacek, A. J., T. B. Onasch, L. Nichman, E. R. Lewis, P. Davidovits, A. Freedman, and L. Williams. 2018. Formation of refractory black carbon by SP2-induced charring of organic aerosol. Aerosol Sci. Technol. 52 (12):1345–50. doi: 10.1080/02786826.2018.1531107.
- Sipkens, T. A., A. Boies, J. C. Corbin, R. K. Chakrabarty, J. Olfert, and S. N. Rogak. 2023. Overview of methods to characterize the mass, size, and morphology of soot. J. Aerosol Sci. 173:106211. doi: 10.1016/j.jaerosci.2023.106211.
- Sipkens, T., J. Corbin, B. Smith, S. Gagné, P. Lobo, B. Brem, M. Johnson, and G. Smallwood. 2024. Quantifying the uncertainties in thermal-optical analysis of aviation emissions: An interlaboratory study. Atmos. Meas. Tech. doi: 10.5194/amt-2024-1.
- Slowik, J. G., K. Stainken, P. Davidovits, L. R. Williams, J. T. Jayne, C. E. Kolb, D. R. Worsnop, Y. Rudich, P. F. DeCarlo, and J. L. Jimenez. 2004. Particle morphology and density characterization by combined mobility and aerodynamic diameter measurements. Part 2: Application to combustion-generated soot aerosols as a function of fuel equivalence ratio. Aerosol Sci. Technol. 38 (12):1206–1222. doi: 10.1080/027868290903916.
- Song, Q., B. He, Q. Yao, Z. Meng, and C. Chen. 2006. Influence of diffusion on thermogravimetric analysis of carbon black oxidation. Energy Fuels 20 (5):1895–900. doi: 10.1021/ef0600659.
- Streibel, T., J. Schnelle-Kreis, H. Czech, H. Harndorf, G. Jakobi, J. Jokiniemi, E. Karg, J. Lintelmann, G. Matuschek, B. Michalke, et al. 2017. Aerosol emissions of a ship diesel engine operated with diesel fuel or heavy fuel oil. Environ. Sci. Pollut. Res. Int. 24 (12):10976–91. doi: 10.1007/s11356-016-6724-z.
- Subramanian, R., A. Khlystov, and A. Robinson. 2006. Effect of peak inert-mode temperature on elemental carbon measured using thermal-optical analysis. Aerosol Sci. Technol. 40 (10):763–80. doi: 10.1080/02786820600714403.
- Subramanian, R., A. Y. Khlystov, J. C. Cabada, and A. L. Robinson. 2004. Positive and negative artifacts in particulate organic carbon measurements with denuded and undenuded sampler configurations: Special issue of Aerosol Science and Technology on findings from the fine particulate matter supersites program. Aerosol Sci. Technol. 38 (sup1):27–48. doi: 10.1080/02786820390229354.
- Török, S., V. B. Malmborg, J. Simonsson, A. Eriksson, J. Martinsson, M. Mannazhi, J. Pagels, and P. E. Bengtsson. 2018. Investigation of the absorption Ångström exponent and its relation to physicochemical properties for mini-CAST soot. Aerosol Sci. Technol. 52 (7):757–67. doi: 10.1080/02786826.2018.1457767.
- Watson, J. G., J. C. Chow, and L. W. A. Chen. 2005. Summary of organic and elemental carbon/black carbon analysis methods and intercomparisons. Aerosol Air Qual. Res. 5 (1):65–102. doi: 10.4209/aaqr.2005.06.0006.
- Weakley, A. T., S. Takahama, and A. M. Dillner. 2018. Thermal/optical reflectance equivalent organic and elemental carbon determined from federal reference and equivalent method fine particulate matter samples using Fourier transform infrared spectrometry. Aerosol Sci. Technol. 52 (9):1048–58. doi: 10.1080/02786826.2018.1504161.
- Zhou, X., M. W. Nolte, H. B. Mayes, B. H. Shanks, and L. J. Broadbelt. 2014. Experimental and mechanistic modeling of fast pyrolysis of neat glucose-based carbohydrates. 1. Experiments and development of a detailed mechanistic model. Ind. Eng. Chem. Res. 53 (34):13274–89. doi: 10.1021/ie502259w.