
 ?Mathematical formulae have been encoded as MathML and are displayed in this HTML version using MathJax in order to improve their display. Uncheck the box to turn MathJax off. This feature requires Javascript. Click on a formula to zoom.
Abstract
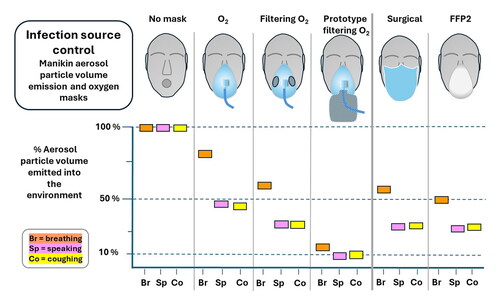
Hospital patients with infectious respiratory diseases frequently require oxygen which may be delivered by a face mask, and the quantitative effect of such masks on the emission of infectious respiratory aerosol is relevant to hospital acquired respiratory infections. This article reports the evaluation of the efficiency of aerosol particle volume reduction by oxygen face masks with and without exhalation filtering capability, for a medium concentration, high concentration non-rebreather and a venturi mask. The masks include two prototype filtering oxygen masks, and also type IIR surgical and FFP2 masks for reference. The evaluation was with a breathing and coughing manikin, measuring the relative volume of aerosol particles transmitted to the environment with and without a mask in place. Mask efficiency fraction indices, MEF, and relative performance factors, RPF, were calculated by a model which included the particle size spectrum arising from human breathing, speaking and coughing to produce indices for each of these activities. In this manikin model non-filtering medium and high concentration oxygen face masks reduced aerosol emission, with fractional efficiencies between 0.12 on breath and 0.65 on cough. Compared to non-filtering masks, currently available filtering oxygen masks reduced aerosol particle volume emission by factors up to 1.2 on breath and 2.4 on cough, and with prototype filtering masks reduction was up to a factor of 6.1 for breathing and 5.1 for cough. Validation in humans and modeling of the clinical environment is required to estimate the effect of such reductions in aerosol emission on healthcare acquired infections.
Graphical Abstract
EDITOR:
Introduction
Source control is recognized as the leading priority in the pyramid of risk control in infection transmission (Centre for Disease Control Citation2023). Source control face masks are used to reduce the emission of respiratory particles into the air from a person with an infectious respiratory disease, and the medical face mask is an example of such masks (MacIntyre et al. Citation2016). The benefits of source control have been modeled for community and healthcare settings (Cheng et al. Citation2021; Liang et al. Citation2020). Hospital acquired infections, known as nosocomial infections, are of concern since hospital patients are more likely to become infected and to have poor outcomes due to other health deficits (Ponsford et al. Citation2021). Respiratory nosocomial infections are common and have significant impacts on health and healthcare resources as reported by Guest (Citation2020) with an estimated 1.5 million additional hospital bed days per annum in the English NHS. Such concerns have been reinforced by the hospital experience of the SARS-Cov2 pandemic (Leal et al. Citation2023; Wee et al. Citation2023) and also are of concern for seasonal and pandemic influenza (Horcajada et al. Citation2003; Osorio-López et al. Citation2022; Zhan et al. Citation2021) and Tuberculosis (Escombe et al. Citation2019).
Many hospital patients with the respiratory disease require supplemental oxygen, the majority with simple nasal canulae delivery, with oxygen face masks typically used for flow rates above 6 L/min. There has been an evaluation of aerosol emission when using simple oxygen masks (Hui et al. Citation2007; Ip et al. Citation2007), with both studies evaluating the range of aerosol spread of the exhaled plume from the mask but not evaluating the aerosol mass emitted. Aerosol emission has been measured from high flow nasal cannulae and CPAP sealed facemask devices (Gaeckle et al. Citation2020; Hamilton et al. Citation2021; Hamada et al. Citation2021; Wilson et al. Citation2021), and there is a semi-quantitative assessment of aerosol emission from a high concentration non-rebreather mask (Mardimae et al. Citation2006).
There are two simple oxygen masks with exhaust filtration in clinical use, for medium and high concentration oxygen, but there is no available evaluation of their performance for aerosol removal.
An important feature of some respiratory diseases is the presence of cough, with rapid air flow and peak rates in the range 4–12 L/s (Gupta, Lin, and Chen Citation2009). Cough also produces many more particles than breathing so even occasional coughs can release significant particle numbers (Dhand and Li Citation2020), though the continuous nature of breathing is sufficient to release enough infectious material for disease transmission (Gupta, Lin, and Chen Citation2009; Patterson and Wood Citation2019; Scheuch Citation2020). Masks can be used to reduce cough aerosol emission (Bourouiba, Dehandschoewercker, and Bush Citation2014; Lindsley et al. Citation2012, Citation2021), but the very high flow rate produces pressure under the mask and a tendency to dislodge the mask, thereby increasing any leak gaps and potentially increasing transfer of aerosol to the environment.
Given the above background of nosocomial respiratory infection risk it is desirable to have aerosol removal when patients use oxygen face masks, and also to have a mask that is not dislodged by cough. We have developed two prototype filtering oxygen masks, a medium concentration and a high concentration non-rebreather mask. These prototypes have a low resistance to high fluid flow rates on cough, achieved by large area filtration material (Britten Citation2023).
This work presents measurements of the aerosol emission reducing performance of clinically used oxygen masks, including those with exhalation filters, and the two new prototype masks, together with measurements of a type IIR surgical and FFP2 mask. Measurements were made with a breathing and coughing manikin, chamber collection system and particle spectrometer, measuring total particle volume emitted to the environment with and without a mask. The analysis method calculates a performance index that uses modeling of the human respiratory aerosol particle size spectrum for breathing, speaking and cough in order to make the performance index as relevant as possible to mask performance when worn by a human (Britten and Chilcott Citation2021; Leith, L’Orange, and Volckens Citation2021). We report sensitivity analysis of the calculated performance indices to changes in the respiratory aerosol particle size spectrum used in the modeling. The sensitivity analysis also investigates an index of relative mask performance in order to see if relative performance is less sensitive to model parameter values than absolute mask efficiency, and so more reliable to assess relative mask performance.
Materials and methods
The masks evaluated are listed in , forming three groups: (1) Medium concentration oxygen masks MCO, MCOF, VMCO and PMCOF; (2) High concentration non-rebreather masks HCO, HCOF, PHCOF; (3) No oxygen delivery SM surgical mask type IIR, and FFP2. In these acronyms MCO and HCO indicate a medium and high concentration oxygen mask respectively, V indicates a venturi mask, P is a prototype and F indicates a mask with exhaust filtration. All masks are in current clinical use apart from the prototype PMCOF and PHCOF masks. Specific manufacturers and models are anonymised since the methods presented here are under development and not established enough to lead to a change in any clinical practice, but the commercial masks are considered to be high quality examples of their type with a good edge seal.
Table 1. List of acronyms, variables and definitions.
This article treats all masks as consumer products to be used following manufacturers instruction, without concern for the construction or design features. The prototype masks PMCOF and PHCOF were designed to have low resistance to fluid flow, particularly for cough, and for more details of the basis of the prototype masks see Britten (Citation2023).
All masks were positioned on the manikin by the same operator as if fitting to a human following the manufacturer’s instructions, setting the straps to a tightness judged to be similar to that for human use. The operator looked carefully to identify any obvious mask-face gaps and adjusted the mask to minimize these. Masks were removed and repositioned between repeat measurements in order to include variations in repositioning.
Air flow to the masks was used as a surrogate for oxygen, delivered at the flow rates of 8 L/min and 12 L/min for medium and high concentration oxygen masks respectively.
Measurement system
The breathing and coughing system BCS (Ph6 Ltd, UK) has a NIOSH defined medium size 3D hard plastic printed head (NIOSH Citation2020), and computer controlled pneumatic cylinder moving a bellows to produce an exhaled volume of 1 L in 1.5 s for breathing. For cough a 2.1 L volume was used with a peak flow rate of 7 L/s at about 0.2 s from cough initiation and a total cough duration of about 0.8 s. A schematic diagram and key operational details are given in the online supplementary information (SI).
A normal saline aerosol was provided by a jet nebulizer, either a Cirrus 2 (Intersurgical Ltd, UK) or a Beurer IH58 (Beurer GmbH, Germany). The method and analysis is insensitive to the particle spectrum used, but is limited by the number of larger particles produced, and the Beurer has a greater yield above 3 µm. Further details of the nebulizer spectra are given in SI. At least three evaluation runs were performed per mask, with at least two with each nebulizer for most masks.
Aerosol collection and sampling
The collecting chamber volume was sampled for 20 min with 240 × 5 s data points stored by the particle spectrometer (APS3321, TSI inc) into 42 aerodynamic diameter size bins in the range 0.542 to 10.37 µm. Further details are given in the SI.
Data analysis
Spectrometer data from the 20 min following breathing or cough was copied to a spreadsheet, background corrected and summed to give the total particle numbers per size bin, C(d). The values of C(d) with a mask were divided by those without a mask to give the transfer fraction per bin TF(d), representing the fraction of aerosol at diameter d transferred to the environment either by flow through the mask or leak around the edges. TF(d) values from all runs for a given mask were averaged, and the efficiency of particle reduction at each diameter was calculated as EF(d) = 1 – TF(d). Further details of the analysis are in the SI. The average relative humidity RH was 63% in the bellows before exhalation and 49% in the collection chamber, with an estimated 8.3% diameter reduction due to this RH change (Walker et al. Citation2021). An evaporation correction was applied by multiplying the bin diameters by1.09 so that they are an estimate of the particle sizes on the upstream side of the mask leaving the manikin mouth, and all reported diameters are of the particle sizes after this correction. For convenience in this text the APS3321 bin sizes and all other particle sizes are rounded to one decimal place unless otherwise noted.
Maximum usable particle diameter
We define the maximum usable particle diameter dmax as the largest diameter with a standard deviation of EF(d) of less than 0.14, set so that the standard error in the mean of 3 or more runs is under 0.10. Repeated measurements, including data from both nebulizers, was used to calculate the standard deviations of EF(d) values, to identify a dmax to be applied to data from runs with either of the nebulizers.
Extrapolation of EF(d)
Initial measurements showed that the number of particles collected above 4 µm was very low, sufficient to estimate the mask effect on aerosol from human breath since the reported peak of the human particle volume spectrum is in the range from 1 to 3 µm, but speech and cough have a much higher upper diameter (Chao et al. Citation2009; Cheng et al. Citation2021; Johnson et al. Citation2011). We therefore considered if we could obtain estimates of performance above the measured particle size range by extrapolation of EF(d). Previously Leith, L’Orange, and Volckens (Citation2021) reported the filtration efficiency of mask material which we have linearly fitted from 2 µm to 5 µm up to the maximum efficiency, with R2 values from 0.82 to 0.95, and Lindsley et al. (Citation2023) report mask efficiency fractions which we have linearly fitted from 3.01 µm to 9.02 µm with R2 values from 0.88 to 0.97, both works supporting an approximately linear change of EF(d) with diameter.
The EF(d) vs d curves from each mask were therefore reviewed to see if they were approximately linear up until dmax and then extrapolated to a maximum efficiency of 0.95, this limit set to reflect the highest level of performance expected from any non-fitted mask, and deliberately set high to avoid positive bias toward the prototype masks. The extrapolated EF(d) curves were then used to calculate mask performance indices described below for breathing, speech and cough.
Single diameter efficiency fractions
Personal Protective Equipment, PPE, mask performance may be reported at the maximum penetrating particle size, MPPS, taken as 0.3 µm for many filtering materials, (Rengasamy et al. Citation2017). For source control masks without high performance seals to the face, leaks through air gaps are at least as important as penetration through the filtering material (Schmitt and Wang Citation2021) so the performance at the MPPS is of less relevance. Though we have calculated an overall index of mask performance modeled with human emission spectra, see the next section, measures of efficiency at one or more diameters EF(d) are simple and free from any uncertainties in the chosen parameterization of the human respiratory particle spectrum. We therefore report the EF(d) values at 0.6, 1, 2 and dmax µm and compare these with the modeled mask efficiency fraction now introduced.
Mask efficiency fraction MEF
We define a mask efficiency fraction MEF as the fraction of the human exhaled respiratory particle volume that is stopped from reaching the environment. The overall efficiency of the mask to reduce the emission of respiratory aerosols will depend upon the size spectrum of particles in the exhalation, so we take a representative particle spectrum for a human population and multiply the particle volume at each diameter by the measured mask efficiency at that diameter, divided by the volume emitted without the mask, to give the mask efficiency fraction, EquationEquation (1)(1)
(1) :
(1)
(1)
Where V(d) is the particle volume at size d from a human exhaled particle spectrum and EF(d) is the efficiency with which that volume is blocked by the mask. Particle volume or mass is used in such indices since they are taken as proportional to the pathogen content, but this can be replaced by a figure representing pathogen content probability at a given particle size if this is known for a given disease. There are several studies of particle size and pathogen content, but the data is limited (Fennelly Citation2020; Milton et al. Citation2013). We use volume weighting rather than mass since we specify the diameter and the density cancels out in the ratio in EquationEquation (1)(1)
(1) . The summation is from dmin set by the minimum spectrometer bin diameter 0.591 µm and du as the upper limit, chosen as the maximum usable diameter dmax for measured EF(d) values, or for values above dmax when using extrapolated EF(d) values. The literature contains a number of reports of the particle spectra for different populations and respiratory conditions (Chao et al. Citation2009; Cheng et al. Citation2021; Johnson et al. Citation2011; Pöhlker et al. Citation2023) and we have used the parameterization reported by Johnson, see Figure S3, since it covers breathing, speech and cough, and the specification of these activities is defined in the SI.
The MEF index therefore quantifies the fraction of the total exhaled aerosol particle volume from the source that is blocked from reaching the environment when a mask is worn, with separate indices calculated for breathing, speaking and coughing.
Comparing mask performance
The aim of the source control mask is to reduce the transfer of infectious aerosol to the environment where it may be available to be inhaled by a bystander. The fraction of the exhaled aerosol that reaches the environment we define as the mask transfer fraction MTF, the volume of aerosol particles reaching the environment divided by the total volume of particles exhaled, and from the definition of the mask efficiency fraction above we have MTF = 1 – MEF. The ratio of MTF values from two different masks will give their relative performance in reducing or increasing the volume of aerosol particles reaching the environment, so we define a relative performance factor
(2)
(2)
We choose that the reference mask is the mask with better performance, lower MTF. RPF is then the factor by which the respiratory aerosol particle volume reaching the environment is reduced when the reference mask is used instead of mask A.
The relative performance factors were calculated from the MEF(du) values measured without extrapolation, MEF(dmax), and also for MEF(5.5) and MEF(10.5) from the extrapolated EF(d) values to investigate how relative performance may change with larger particle size ranges. We choose to calculate MEF at 5.5 and 10.5 µm since 5 µm has previously been taken as an upper limit to define a “fine fraction” when studying aerosols and masks, and 10.4 µm is the highest bin size on the spectrometer. The 10.4 µm bin size corresponds to 11.3 µm at the mouth unevaporated, but we use the next lowest bin size for comparability with other work.
Error analysis
The variability of the efficiency fractions EF(d) at each diameter bin was assessed by calculating the standard deviation of EF(d) from repeat runs, with the mask removed and repositioned between runs. The variability in EF(d) was used to select the maximum usable particle size. For masks where we had six or more repeat runs the EF(d) values from each run were also used to calculate the mask efficiency fraction index MEF from each run, and the standard deviation of MEF calculated.
Sensitivity analysis
The sensitivity of the MEF calculation to the modeled respiratory spectra was investigated, considering the shape of the particle spectrum, the maximum value of the EF(d) in the extrapolation and the upper diameter limit du for the summation of the total particle volume. The sensitivity of the relative performance factor RPF to the model was also checked, being the ratio between two MEF values.
The respiratory particle size spectrum was modeled following the publication by Johnson et al. (Citation2011), and the shape of the spectrum was changed by varying the factor that describes the evaporation from the mouth to ambient relative humidity. Johnson used an evaporation factor of 0.5 producing a breathing particle volume peak at 2 µm, and others have reported a factor of around 0.35 for evaporation of lung fluid (Walker et al. Citation2021) giving a peak of 2.9 µm, whilst Cheng et al. (Citation2021) report a breathing peak at 1 µm. We therefore performed repeated MEF calculations with the evaporation factor set to give volume spectra peaks for breathing at 1, 2 and 2.9 µm with evaporation factors 0.96, 0.5 and 0.35 respectively in Johnson’s parameterization. A 2 µm peak is used for the final reported MEF values.
We also looked at the effect of the maximum value in the extrapolation of EF(d) by calculating MEF indices with the EFmax set to 0.7, 0.85, 0.9 and 0.95 to investigate the sensitivity of MEF values to an EF(d) maximum below the 0.95 value used for the final reported MEF values.
For assessment of the effects of varying the upper particle diameter du in the summation in EquationEquation (1)(1)
(1) , the MEF(du) values for each mask and each respiratory mode were calculated with du set to dmax, 5.5 and 10.5 µm giving the indices MEF(dmax), MEF(5.5), MEF(10.5) which are then compared.
Results
Errors and the maximum usable particle diameter
The variability of the EF(d) values was used to define an acceptable maximum usable particle diameter dmax for the measurements, for breath and cough. For 8 out of the 9 masks the standard deviation of EF(d) up to 3.8 µm is below 0.12 on breathing, and below 0.1 for coughing. For each mask EF(d) values from 3 or more runs were averaged resulting in a standard error in the mean of each EF(d) point up to 3.8 µm of < = 0.085 for breathing and < = 0.070 for cough.
In addition to the above variability analysis, visual inspection of the EF(d) versus d curves showed that the curves are smooth up until around 4.1 µm, but rapidly falling nebulizer output and increasing mask efficiency produced larger variability above this diameter. We therefore set dmax to 3.8 µm, being the next bin below 4.1 µm.
To assess the variability of the calculated MEF values we looked at data from four masks with 6 or more repeated runs: PHCOF breathing and cough, MCOF breathing and MCOF cough. For these masks the calculated MEF indices range from 0.4 to 0.9 so that we have from relatively high to relatively low particle numbers with the mask in place. The standard deviation of the repeated runs was between 0.04 and 0.1, so we take the upper value 0.1 as an estimate of the standard deviation of repeat runs. For all masks at least three runs were taken, so the standard error of the averaged MEF values is estimated as 0.07 or lower.
Extrapolation of EF(d)
The maximum usable diameter dmax was set by the error analysis above at 3.8 µm, and the EF(d) versus d relationship for all masks is smooth and approximately linear between 2.7 and 3.8 µm, see , in agreement with other published work discussed in the methods section for extrapolation. The EF(d) curves were therefore linearly fitted from 2.7 µm to 3.8 µm and extrapolated till EF(d) reached 0.95. The largest diameter at which EF(d) reached 0.95 was 9.1 µm for the HCO on breathing. Only two masks approach their maximum EF at 3.8 µm diameter, with PMCOF and PHCOF with efficiencies of 0.91 and 0.94 respectively on breath and both 0.95 on cough.
Figure 1. Efficiency Fraction EF(d) averages for the medium concentration oxygen masks. Points were measured up to the dashed line at 3.8 µm and linearly extrapolated from 3.8 µm to a maximum EF(d) of 0.95. (a) Breathing, (b) coughing.
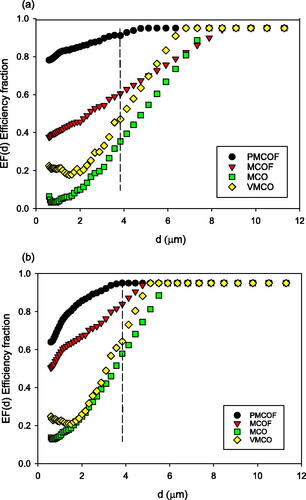
Figure 2. Efficiency Fraction EF(d) averages for the high concentration non-rebreather oxygen masks. Points were measured up to the dashed line at 3.8 µm and linearly extrapolated from 3.8 µm to a maximum EF(d) of 0.95. (a) Breathing; (b) coughing.
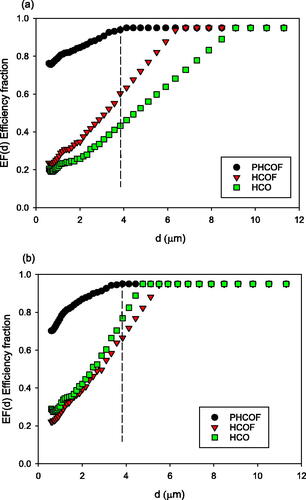
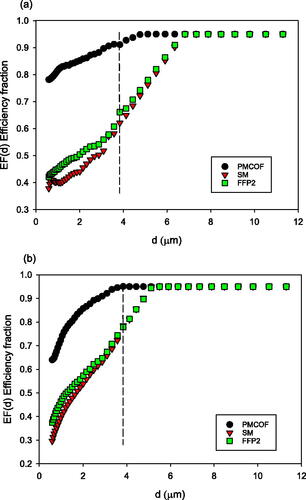
Figure 3. Efficiency Fraction EF(d) averages for SM and FFP2 non-oxygen masks, with the PMCOF mask for comparison. Points were measured up to the dashed line at 3.8 µm and linearly extrapolated from 3.8 µm to a maximum EF(d) of 0.95. (a) Breathing; (b) coughing.
Sensitivity analysis
The sensitivity analysis showed that the summation of particle numbers up to 3.8 µm is sufficient for calculating mask efficiency fractions MEF for breathing spectra with mass peaks ranging from 1, 2 and 2.9 µm, with variation under 10%. Speech and cough performance requires the use transfer fractions TF(d) that covers the range of significant respiratory emissions during speech and cough, both of which have more than 10% of their mass output above 6.5 µm, giving a significant difference between calculating MEF up to either 3.8, 5.5 or 10.5 µm. We therefore use MEF(10.5) values in all subsequent analysis in order to better represent mask effects for speech and cough. The indices calculated for the prototype masks showed little sensitivity to the variations in modeling parameter values since they reached their maximum efficiency at particle diameters under 4.5 µm.
RPF showed a total sensitivity to the model changes of 18%, about half the observed MEF variations, likely due to the RPF factor being a ratio of two MEF values which change in similar senses with changes in the model parameter values. Full details of the sensitivity analysis are given in the SI.
Efficiency fractions EF(d)
The efficiency fraction curves EF(d) versus d for each mask are given in , for breathing and coughing, where the figures show the measured and extrapolated data points. We see that there is a wide range of efficiency fractions between masks across the particle size range, and that even the non-filtering masks have efficiencies above zero. The EF(d) values are generally higher for coughing than breathing. The filtering masks have higher EF(d) values than the non-filtering oxygen masks, with the PMCOF and PHCOF masks being highest on both breath and cough. The EF(d) values reach a maximum at the lowest diameters for the prototype masks, between 3.6 and 3.8 µm on cough for the PHCOF and PMCOF respectively, with other masks reaching maxima at 4.7 µm–5.9 µm on cough. Maximum EF(d) are reached for breathing by the prototype masks at 4.1 and 4.8 µm for the PHCOF and PMCOF respectively, and all other masks achieve maxima between 6.8 and 9.1 µm.
The EF(d) values for breathing and coughing at the diameters 0.6 µm, 1 µm, 2 µm and 3.8 µm are given in SI Tables S4 and S5, showing the increase in efficiency with increasing particle size, and the higher efficiency of the filtering oxygen masks (MCOF, HCOF, PMCOF and PHCOF) compared to the non-filtering masks (MCO, HCO and VMCO). We note that the non-filtering HCO oxygen mask has an EF(d) value of 0.43 on breathing and EF(d) of 0.77 on cough at 3.8 µm, showing that even non-filtering masks may have relatively high efficiencies at higher diameters.
Mask efficiency fractions MEF
The mask efficiency fraction indices, MEF(10.5) are given in .
Table 2. Mask efficiency fractions MEF(10.5) for the medium concentration oxygen masks.
Table 3. Mask efficiency fractions MEF(10.5) for the high concentration non-rebreather oxygen masks.
Table 4. Mask efficiency fractions MEF(10.5) for SM, FFP2 masks.
For the medium concentration oxygen masks in we see that the two filtering masks, MCOF and PMCOF have the highest efficiency. The MCO and VMCO non-filtering masks have MEF(10.5) between 0.12 and 0.61, showing particle removal in the fluid flow out of the mask even without exhaust filtration.
The high concentration oxygen masks in show a similar pattern to the medium concentration masks, with the non-filtering HCO mask with efficiency 0.27 to 0.65 despite having no exhalation filter, with the highest efficiency on the cough. Efficiency increases from breath to cough for all masks.
Simple surgical and FFP2 masks were measured with approximately equal MEF(10.5) at each respiratory condition, between 0.45 and 0.73, again with higher efficiency on cough, . The PMCOF MEF values are also shown in for comparison.
also show the average of the measured single point EF(d) values given in SI Tables S4 and S5. The breathing MEF values are less than 10% % different to the average EF(d) values, but the MEF cough values are up to 58% higher. If we drop the EF(3.8 µm) value from the average of EF(d) the breathing MEF is up to 1.6 times larger, and the cough up to 2.6 times larger than the EF(d) average, showing that the selection of single efficiency points to average makes a large difference on whether single point values can represent the mask efficiency.
Relative mask performance
For the current commercial oxygen masks we compare the relative mask performance factor RPF in going from a medium concentration oxygen non-filtering mask, MCO and VMCO, to the filtering MCOF mask as reference, with full results in SI Tables S6 and S7. The RPF improvement factor is lowest for speech at 1.2, and highest at 2.4 for cough. For the high concentration non-rebreather mask HCO the HCOF filtering mask gives a modest improvement factor of 1.2 on breath and speech and is under 1 for cough, Table S7. On cough we observed in the experiments that the HCOF mask consistently moved away from the face under pressure from the high flow rate, so creating an additional leak which may explain this low cough performance.
The prototype PMCOF and PHCOF masks are the highest efficiency in their groups, and the RPF values are given in and . The lowest improvement is on cough at 2.2 compared to the MCOF filtering mask, rising to 6.1 for the PMCOF mask compared to the medium oxygen concentration mask, and 6.1 for the PHCOF compared to the HCO on speech.
Table 5. Relative Performance Factors RPF, with PMCOF as reference mask.
Table 6. Relative Performance Factors RPF, with PHCOF as reference mask.
RPF values for the PMCOF mask as reference for the non-oxygen masks, SM and FFP2, are in SI Table S8, with improvement factors from 2.9 to 3.8. For all masks we see that the RPF factors are generally lower for cough and speech than breathing, since cough and speech have higher diameter particle emissions and all mask performance increases with particle size
Discussion
This work has used a manikin model of aerosol exhalation at breathing and coughing rates to assess and compare the performance of filtering and non-filtering oxygen masks to remove aerosol particles. We are interested in the benefits of filtering oxygen masks to reduce the emission of respiratory aerosol particles from patients with infectious airborne diseases, to reduce the inhalation of infective particles by other patients and healthcare workers. We have only found one study (Mardimae et al. Citation2006) that has carried out some semi-quantitative assessment of aerosol emission from a commercial and a prototype high concentration non-rebreather oxygen mask, but with no measurement of efficiency. Other work on oxygen delivery devices has been for high flow nasal oxygen and CPAP noninvasive ventilation masks, with human measurements focussed on the concerns that these devices may generate aerosol, and not for comparative mask evaluation (Gaeckle et al. Citation2020; Hamilton et al. Citation2021; Hamada et al. Citation2021; Wilson et al. Citation2021). Our work has focussed on applying methods of evaluation that aim to give a realistic estimate of the effect of a source control mask on the volume of aerosol particle emission, as important information related to infection risk and also as a means of comparing the relative performance of masks to inform mask development and clinical selection. We found that for oxygen masks currently in clinical use the relative performance RPF factors show that using a currently available filtering oxygen mask can reduce emitted particle volume, up to a factor of 1.2 on breathing and 2.4 on cough. The increased efficiency of the prototype filtering oxygen masks gives emitted aerosol volumes that are reduced by factors up to 6.1, compared to the non-filtering masks in current clinical use, and factors up to 4.4 compared to the current filtering mask. These performance factors reflect the efficiency fractions of the prototype masks which reach an efficiency fraction of 0.95 at lower diameter than the other masks.
The efficiency of the oxygen masks without exhaust filtration was higher than we expected, and we consider that the impaction of particles onto the mask body is the likely particle removal mechanism. The exhalation air flow passes through relatively small vents in the mask body, and through leaks between the face and mask. We note that the high concentration non-filtering mask has the highest efficiency of the non-filtering masks and also has the most restricted vents for exhaust flow. The increase in efficiency with particle size and with increasing flow rate from breath to cough also suggests that impaction is the mechanism. There is a possibility with aerosol sampling systems that the collection efficiency of the system changes between the no-mask and mask runs, since the aerosol is blown forward toward the exhaust when there is no mask, and blown up and sideways with a mask in place. This may increase the effects of settling, leak from the collecting system or impaction on the chamber walls (Wilson et al. Citation2021), and so make mask efficiencies artificially high. We have checked the efficiency of our chamber for these different flows and the variation is under 5%, though further work is needed to establish these chamber validation methods.
Though non-filtering oxygen masks have some beneficial effect in removing aerosol particles in the manikin model, in clinical practice the aerosol removal efficiencies are likely to be lower due to jaw movement increasing edge leaks. Until verified on clinical patients the potential benefits of aerosol reduction from current clinical masks, and prototype masks, should be treated with caution.
The mask efficiency fraction MEF and relative performance factor RPF indices are based upon weighting by human respiratory aerosol emission, so we have also reported measured single diameter efficiencies. The relative ranking of the masks from these values is the same as for the mask efficiency index MEF values, but the magnitude of performance difference is poorly evaluated by averages of single point values, and is very sensitive to the actual size points chosen, more so for speech and cough assessment than for breathing. In view of this we consider that it is necessary to include modeling of human respiratory particle size spectra for source control mask evaluation to estimate the magnitude of difference on emitted particle volume in human use, and to quantify the relative performance factor between two masks. Further studies with humans are needed to support this assertion.
One of the limitations of this work is that we could only make reliable measurements for all masks up to 3.8 µm aerodynamic diameter, with too few particles above that. This is sufficient for assessing mask efficiency for breathing, but significantly underestimates the performance of the masks for speech and cough for masks that are still increasing their efficiency above 3.8 µm. Extrapolating the EF(d) data was not ideal, but the smooth and approximately linear nature of our data and the previously reported approximately linear EF(d) curves (Leith, L’Orange, and Volckens Citation2021; Lindsley et al. Citation2021) shows that this extrapolation is reasonable.
One weakness of the approach is that the calculated MEF efficiencies are dependent upon the respiratory spectrum used, and there is currently not a good consensus on human respiratory particle output. This is partly because there are so many population variables that can affect output, as well as variables during measurements such as volume of breath, loudness of speech and rate of cough (Asadi et al. Citation2019, Citation2020; Alsved et al. Citation2020). Our sensitivity analysis considered this variability and showed that with modeled human spectra varying by a factor of 3 in size the variations in speech and cough MEF performance indices were 30% or more for the poorer performing masks, but the relative performance factor RPF had a lower variability of 18% and is therefore more reliable.
Manikin studies offer the potential to make reproducible measurements of aerosol particle transfer from a mask wearing manikin to the environment, with some limitations. We have used a standard NIOSH sized head (NIOSH Citation2020), and though the relative proportions were obtained from a large survey it only represents part of one given population. The hard plastic is likely to produce a poorer fit compared to human soft tissue, and there is no jaw movement that is likely to introduce variable leaks with human use. Manikins with soft skin have been developed (Bergman et al. Citation2014), with no jaw movement, but are still subject to the limitations of size and shape unless a range of head forms are used to represent different populations. Flow rates on breathing and cough also affect mask performance, and we have chosen values that are in the human range from published data. Measurements on humans can be considered to be ideal, but they also include all of the difficulties of head size and shape variability, plus the issues of reproducibility in part due to the very low particle emission rate of many people. In view of these issues, we consider that manikin-based evaluations of comparative mask performance will have a continuing role and, if combined with analysis to include human respiratory weighting to calculate efficiencies, such measurements will provide an estimate of performance in humans, though this has yet to be proven.
The ultimate aim of assessing source control mask performance is to estimate the impact on infection transmission risks. The MEF index uses weighting of the exhaled particle volume, and the approach can also include other weighting factors such as the likelihood of deposition in the bystander’s respiratory tract, or the probability of pathogens in a particle of a given diameter. As noted above, there is limited information on pathogen content as a function of particle size for a given disease, and without this information we cannot estimate the change to pathogen dose due to mask use. Further studies on particle size and pathogen content would be valuable in order to estimate pathogen dose reduction.
Conclusions
In conclusion, measurements of aerosol emission on a manikin breathing and coughing system has shown that non-filtering oxygen masks in current clinical use reduce the emission of respiratory aerosols to the environment, more so for cough compared to breath. A range of single point efficiency values may be used to rank masks, but simple modeling analysis including the human respiratory aerosol size spectrum is required to quantify the likely mask efficiency in human use, and to quantify the relative reduction in aerosol particle volume when using one mask compared to another.
Replacement of non-filtering medium and high concentration non-rebreather oxygen masks with currently available filtering oxygen masks can reduce aerosol volume emission by factors of between 1.2 and 2.4, with two prototype filtering oxygen masks having double this performance. These are bench manikin measurements, and validation of these potential improvements with measurements on humans is required.
Supplemental Information
Download MS Word (474 KB)Acknowledgements
Thanks to Professor Chilcott of the University of Hertfordshire for use of laboratories and encouragement, and to Professor Reid of the University of Bristol for use of equipment and helpful discussions. I am grateful to the Radiological Protection Centre at St George’s Hospital London for use of laboratory space, and to St Georges clinicians Dr Adrian Draper, Dr Ean Ong and Sara Parsons for helpful discussions, and Jonathan Silver for assistance. I also thank manufacturers for the provision of masks, and I acknowledge helpful conversations with the members of the ASTM working group on total outward mask leakage.
Data availability statement
See the supplementary information.
Disclosure statement
Alan Britten is a Director of Ph6 Ltd and stands to benefit from the development of source control face masks.
Additional information
Funding
References
- Alsved, M., A. Matamis, R. Bohlin, M. Richter, P. E. Bengtsson, C. J. Fraenkel, P. Medstrand, and J. Löndahl. 2020. Exhaled respiratory particles during singing and talking. Aerosol Sci. Technol. 54 (11):1245–8. doi: 10.1080/02786826.2020.1812502.
- Asadi, S., A. S. Wexler, C. D. Cappa, S. Barreda, N. M. Bouvier, and W. D. Ristenpart. 2019. Aerosol emission and superemission during human speech increase with voice loudness. Sci. Rep. 9 (1):2348. doi: 10.1038/s41598-019-38808-z.
- Asadi, S., C. D. Cappa, S. Barreda, A. S. Wexler, N. M. Bouvier, and W. D. Ristenpart. 2020. Efficacy of masks and face coverings in controlling outward aerosol particle emission from expiratory activities. Sci. Rep. 10 (1):15665. doi: 10.1038/s41598-020-72798-7.
- Bergman, M. S., Z. Zhuang, D. Hanson, B. K. Heimbuch, M. J. McDonald, A. J. Palmiero, R. E. Shaffer, D. Harnish, M. Husband, and J. D. Wander. 2014. Development of an advanced respirator fit-test headform. Journal of Occupational and Environmental Hygiene 11 (2):117–125. doi: 10.1080/15459624.2013.816434.
- Bourouiba, L., E. Dehandschoewercker, and J. W. M. Bush. 2014. Violent expiratory events: On coughing and sneezing. J. Fluid Mech. 745:537–63. doi: 10.1017/jfm.2014.88.
- Britten, A. 2023. GB2594343 - Face mask and system. UK Intellectual Property Office, GB2594343. https://www.ipo.gov.uk/p-ipsum/Case/PublicationNumber/GB2594343.
- Britten, A., and R. Chilcott. 2021. An index of face mask performance derived by modelling transferred pathogen load. European Aerosol Conference. https://phaidra.univie.ac.at/o:1415084, p209.
- Centre for Disease Control. 2023. Hierarchy of risk controls. https://www.cdc.gov/niosh/topics/hierarchy/default.html
- Chao, C. Y. H., M. P. Wan, L. Morawska, G. R. Johnson, Z. D. Ristovski, M. Hargreaves, K. Mengersen, S. Corbett, Y. Li, X. Xie, et al. 2009. Characterization of expiration air jets and droplet size distributions immediately at the mouth opening. J. Aerosol Sci. 40 (2):122–33. doi: 10.1016/j.jaerosci.2008.10.003.
- Cheng, Y., N. Ma, C. Witt, S. Rapp, P. S. Wild, M. O. Andreae, U. Pöschl, and H. Su. 2021. Face masks effectively limit the probability of SARS-CoV-2 transmission. Science. 372 (6549):1439–43. doi: 10.1126/science.abg6296.
- Dhand, R., and J. Li. 2020. Coughs and sneezes: Their Role in transmission of respiratory viral infections, including SARS-CoV-2. Am. J. Respir. Crit. Care Med. 202 (5):651–9. doi: 10.1164/rccm.202004-1263PP.
- Escombe, A. R., E. Ticona, V. Chávez-Pérez, M. Espinoza, and D. A. J. Moore. 2019. Improving natural ventilation in hospital waiting and consulting rooms to reduce nosocomial tuberculosis transmission risk in a low resource setting. BMC Infect. Dis. 19 (1):88. doi: 10.1186/s12879-019-3717-9.
- Fennelly, K. P. 2020. Particle sizes of infectious aerosols: Implications for infection control. Lancet Respir. Med. 8 (9):914–24. doi: 10.1016/S2213-2600(20)30323-4.
- Gaeckle, N. T., J. Lee, Y. Park, G. Kreykes, M. D. Evans, and C. J. Hogan. 2020. Aerosol generation from the respiratory tract with various modes of oxygen delivery. Am. J. Respir. Crit. Care Med. 202 (8):1115–24. doi: 10.1164/rccm.202006-2309OC.
- Guest, J. F.,T. Keating,D. Gould, andN. Wigglesworth. 2020. Modelling the annual NHS costs and outcomes attributable to healthcare-associated infections in England. BMJ Open. 10 (1):e033367. doi: 10.1136/bmjopen-2019-033367.
- Gupta, J. K., C. H. Lin, and Q. Chen. 2009. Flow dynamics and characterization of a cough. Indoor Air 19 (6):517–25. doi: 10.1111/j.1600-0668.2009.00619.x.
- Hamada, S., N. Tanabe, H. Inoue, and T. Hirai. 2021. Is high-flow nasal cannula oxygen therapy an aerosol-generating medical procedure? Archivos de Bronconeumologia 57 (9):601–2. doi: 10.1016/j.arbres.2021.01.011.
- Hamilton, F., F. Gregson, D. Arnold, S. Sheikh, K. Ward, J. Brown, E. Moran, C. White, A. Morley, B. Bzdek, et al. 2021. Aerosol emission from the respiratory tract: An analysis of relative risks from oxygen delivery systems. Thorax 77 (3):276–282. doi: 10.1101/2021.01.29.21250552.
- Horcajada, J. P., T. Pumarola, J. A. Martínez, G. Tapias, J. M. Bayas, M. de la Prada, F. García, C. Codina, J. M. Gatell, and M. T. Jiménez de Anta. 2003. A nosocomial outbreak of influenza during a period without influenza epidemic activity. Eur. Respir. J. 21 (2):303–7. doi: 10.1183/09031936.03.00040503.
- Hui, D. S., S. D. Hall, M. T. V. Chan, B. K. Chow, S. S. Ng, T. Gin, and J. J. Y. Sung. 2007. Exhaled air dispersion during oxygen delivery via a simple oxygen mask. Chest 132 (2):540–6. doi: 10.1378/chest.07-0636.
- Ip, M., J. W. Tang, D. S. C. Hui, A. L. N. Wong, M. T. V. Chan, G. M. Joynt, A. T. P. So, S. D. Hall, P. K. S. Chan, and J. J. Y. Sung. 2007. Airflow and droplet spreading around oxygen masks: A simulation model for infection control research. Am. J. Infect. Control 35 (10):684–9. doi: 10.1016/j.ajic.2007.05.007.
- Johnson, G. R., L. Morawska, Z. D. Ristovski, M. Hargreaves, K. Mengersen, C. Y. H. Chao, M. P. Wan, Y. Li, X. Xie, D. Katoshevski, et al. 2011. Modality of human expired aerosol size distributions. J. Aerosol Sci. 42 (12):839–51. doi: 10.1016/j.jaerosci.2011.07.009.
- Leal, J., H. M. O’Grady, L. Armstrong, D. Dixit, Z. Khawaja, K. Snedeker, J. Ellison, J. Erebor, P. Jamieson, A. Weiss, et al. 2023. Patient and ward related risk factors in a multi-ward nosocomial outbreak of COVID-19: Outbreak investigation and matched case–control study. Antimicrob. Resist. Infect. Control 12 (1):21. doi: 10.1186/s13756-023-01215-1.
- Leith, D., C. L’Orange, and J. Volckens. 2021. Quantitative protection factors for common masks and face coverings. Environ. Sci. Technol. 55 (5):3136–43. doi: 10.1021/acs.est.0c07291.
- Liang, M., L. Gao, C. Cheng, Q. Zhou, J. P. Uy, K. Heiner, and C. Sun. 2020. Efficacy of face mask in preventing respiratory virus transmission: A systematic review and meta-analysis. Travel Med. Infect. Dis. 36:101751. doi: 10.1016/j.tmaid.2020.101751.
- Lindsley, W. G., F. M. Blachere, B. F. Law, D. H. Beezhold, and J. D. Noti. 2021. Efficacy of face masks, neck gaiters and face shields for reducing the expulsion of simulated cough-generated aerosols. Aerosol Sci. Technol. 55 (4):449–57. doi: 10.1080/02786826.2020.1862409.
- Lindsley, W. G., F. M. Blachere, R. C. Derk, T. Boots, M. G. Duling, B. Boutin, D. H. Beezhold, and J. D. Noti. 2023. Constant vs. cyclic flow when testing face masks and respirators as source control devices for simulated respiratory aerosols. Aerosol Sci. Technol. 57 (3):215–32. doi: 10.1080/02786826.2023.2165898.
- Lindsley, W. G.,W. P. King,R. E. Thewlis,J. S. Reynolds,K. Panday,G. Cao, andJ. V. Szalajda. 2012. Dispersion and exposure to a cough-generated aerosol in a simulated medical examination room. J. Occup. Environ. Hyg. 9 (12):681–90. doi: 10.1080/15459624.2012.725986.
- MacIntyre, C., Y. Zhang, A. Ahmad Chughtai, H. Seale, D. Zhang, Y. Chu, H. Zhang, B. Rahman, and Q. Wang. 2016. Cluster randomised controlled trial to examine medical mask use as source control for people with respiratory illness. BMJ Open 6 (12):e012330. doi: 10.1136/bmjopen-2016.
- Mardimae, A., M. Slessarev, J. Han, H. Sasano, N. Sasano, T. Azami, L. Fedorko, T. Savage, R. Fowler, and J. A. Fisher. 2006. Modified N95 mask delivers high inspired oxygen concentrations while effectively filtering aerosolized microparticles. Ann. Emerg. Med. 48 (4):391–9.e2. doi: 10.1016/j.annemergmed.2006.06.039.
- Milton, D. K., M. P. Fabian, B. J. Cowling, M. L. Grantham, and J. J. McDevitt. 2013. Influenza virus aerosols in human exhaled breath: Particle size, culturability, and effect of surgical masks. PLOS Pathog. 9 (3):e1003205. doi: 10.1371/journal.ppat.1003205.
- NIOSH. 2020. NIOSH Anthropometric Data and ISO Digital Headforms. Accessed June 10, 2021. https://www.cdc.gov/niosh/npptl/topics/respirators/headforms/default.html.
- Osorio-López, E. A., F. Rivera-Buendía, J. Nevárez-Luján, E. Rivas-Pichon, and D. Vilar-Compte. 2022. Nosocomial influenza in patients with cancer before the coronavirus disease 2019 (COVID-19) era and one year after the pandemic: Can we do any better in hospitals? Infect. Control Hosp. Epidemiol. 43:1723–5. doi: 10.1017/ice.2021.337.
- Patterson, B., and R. Wood. 2019. Is cough really necessary for TB transmission? Tuberculosis 117:31–5. doi: 10.1016/j.tube.2019.05.003.
- Pöhlker, M. L.,C. Pöhlker,O. Krüger,J. D. Förster,T. Berkemeier, andW. Elbert. 2023. Respiratory aerosols and droplets in the transmission of infectious diseases. Rev. Mod. Phys. 95 (4):045001. doi: 10.1103/RevModPhys.95.045001.
- Ponsford, M. J., T. J. C. Ward, S. M. Stoneham, C. M. Dallimore, D. Sham, K. Osman, S. M. Barry, S. Jolles, I. R. Humphreys, and D. Farewell. 2021. A systematic review and meta-analysis of inpatient mortality associated with nosocomial and community COVID-19 exposes the vulnerability of immunosuppressed adults. Front. Immunol. 12:744696. doi: 10.3389/fimmu.2021.744696.
- Rengasamy, S., R. Shaffer, B. Williams, and S. Smit. 2017. A comparison of facemask and respirator filtration test methods. J. Occup. Environ. Hyg. 14 (2):92–103. doi: 10.1080/15459624.2016.1225157.
- Scheuch, G. 2020. Breathing is enough: For the spread of influenza virus and SARS-CoV-2 by breathing only. J. Aerosol Med. Pulm. Drug Deliv. 33 (4):230–4. doi: 10.1089/jamp.2020.1616.
- Schmitt, J., and J. Wang. 2021. Modelling the impact of facemasks on the airborne transmission of SARS-CoV-2. European Aerosol Congress. https://phaidra.univie.ac.at/o:1415084, p846.
- Walker, J. S., J. Archer, F. K. A. Gregson, S. E. S. Michel, B. R. Bzdek, and J. P. Reid. 2021. Accurate representations of the microphysical processes occurring during the transport of exhaled aerosols and droplets. ACS Cent. Sci. 7 (1):200–9. doi: 10.1021/acscentsci.0c01522.
- Wee, L. E., E. P. Conceicao, M. K. Aung, M. O. Aung, Y. Yang, S. Arora, K. K. K. Ko, and I. Venkatachalam. 2023. Nosocomial SARS-CoV-2 transmission in multi-bedded hospital cubicles over successive pandemic waves: Lower mortality but wider spread with Omicron despite enhanced infection-prevention measures. Infect. Dis. Health. 28 (2):81–7. doi: 10.1016/j.idh.2022.09.003.
- Wilson, N. M., G. B. Marks, A. Eckhardt, A. M. Clarke, F. P. Young, F. L. Garden, W. Stewart, T. M. Cook, and E. R. Tovey. 2021. The effect of respiratory activity, non-invasive respiratory support and facemasks on aerosol generation and its relevance to COVID-19. Anaesthesia 76 (11):1465–74. doi: 10.1111/anae.15475.
- Zhan, Y., X. Chen, W. Guan, W. Guan, C. Yang, S. Pan, S. S. Wong, R. Chen, and F. Ye. 2021. Clinical impact of nosocomial infection with pandemic influenza A (H1N1) 2009 in a respiratory ward in Guangzhou. J. Thorac. Dis. 13 (10):5851–62. doi: 10.21037/jtd-21-897.