Abstract
Titania (TiO2) nanoparticles with primary diameters of less than 30 nm were produced by the thermal decomposition of TTIP and by the oxidation of TiCl4 in a cylindrical furnace reactor at 1200°C. Particle size, crystalline phase, and phase transformation were investigated as a function of precursor concentration and total flow rate by TEM, a DMA/CNC system, XRD, and TG-DTA. The results show that both particle size and number concentration were increased with increasing precursor concentration, and that the primary size could be controlled by changing the operating conditions. An anatase-to-rutile phase transformation occurred at TTIP concentrations above 7.68 × 10⁻⁶ mol/l and this was enhanced with increasing precursor concentration. It is noteworthy that the transformation is independent of grain size but appears to be related to the presence of carbon impurities in the nanoparticles.
INTRODUCTION
Titanium dioxide (TiO2), or titania, is an important material widely used in novel electronics, ceramics, catalysis, and the pigment industries because of its optical and catalytic properties, which originate from a quantum size effect. A variety of methods can be used to produce titania nanoparticles, including the classic sulfate process, the chloride route, the sol-gel method, flame synthesis, and chemical vapor deposition (CVD). However, the particle sizes and crystal structures of the resulting TiO2 vary considerably depending on the preparation method used (CitationKim et al. 2004).
A large amount of data are available regarding the chemical and physical behavior of TiO2 nanoparticles prepared by the CVD method because of its advantages in controlling particle size, crystal structure and purity (CitationJang and Jeong 1995). However, the mechanisms by which particles are produced and the nature of the phase transformation have not been fully evaluated despite intense research over the past several decades. It is particularly noteworthy that phase transformation of titania nanoparticles prepared by the thermal decomposition of titanium isopropoxide (TTIP) has not been fully evaluated.
Titania exists in three polymorphs: brookite, anatase, and rutile. Rutile is the only stable phase, whereas anatase and brookite are both metastable at all temperatures (CitationSun et al. 2001). The structures of anatase and rutile have their own stabilization temperature ranges and can be controlled by heat treatment (CitationXia et al. 1999). It has been reported that titania normally undergoes an anatase-to-rutile phase transformation in the range from 600–700°C. A smaller particle size and large surface area have been proposed to favor this transformation (CitationHu et al. 2003). In addition, the transformation may be affected by factors such as the conditions used for its preparation, precursors, impurities, oxygen vacancies, and the primary particle sizes of the anatase particles and so on (CitationXia et al. 1999).
In our previous studies, the preparation of TiO2 nanoparticles by a CVD method were described. The sintering behavior (CitationSeto et al. 1995), the overall CVD process (CitationNakaso et al. 2001), the effect of reactor temperature (CitationNakaso et al. 2003), and an investigation of particle nucleation (CitationKim et al. 2004) were evaluated experimentally and theoretically. Based on these studies, we concluded that the chemical reaction rate was one of the most important factors in controlling the size and morphology of the resulting nanoparticles, and the study proposed the primary phenomena of nucleation from gas-phase precursors, the initial stage of particle generation. These results suggest the necessity of a more complete examination of the effect of operating conditions on particle size, crystallinity, and transformation.
In this study, the particle sizes and crystal structures are characterized under various preparation conditions, including precursor concentrations and total carrier gas flow rates, using two different precursors (TTIP and TiCl4). Particle size, morphology, and crystallinity were characterized using a variety of techniques, such as transmission electron microscopy (TEM), electrical mobility analyzer (DMA), X-ray diffraction (XRD), and thermogravimetry-differential thermal analysis (TG-DTA).
EXPERIMENTAL SYSTEM
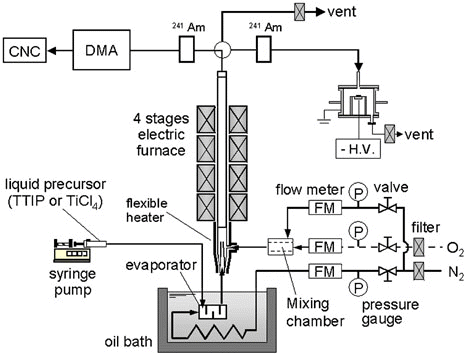
The experimental apparatus used in this study is shown in . Titania nanoparticles were produced by the thermal decomposition of titanium isopropoxide (TTIP) and the oxidation of titanium tetrachloride (TiCl4) in a tubular hot-wall reactor. The liquid precursors were fed into the evaporator by means of a syringe pump (Model PHD 2000, Harvard Inc., Holliston, Massachusetts). The evaporator was in an oil bath, the temperature of which was maintained at 80°C. The liquid precursors were evaporated in the evaporator and then introduced into a vertical quartz tube with an inner diameter of 13 mm and a length of 550 mm. The vapor concentration of the precursor was calculated by assuming that the carrier gas through the evaporator was completely saturated. For the oxidation of TiCl4, oxygen gas was introduced at flow rate of 0.5 l/min under atmospheric temperature and pressure. The total gas flow rate was maintained at 2 l/min, resulting in a residence time of about 2.2 s in the reactor for all runs. The particles produced in the reactor were collected directly on a TEM grid using an electrostatic sampler (CitationDeppert et al. 1996), to which a high voltage of about 6.0 kV was applied. The nanoparticles were examined by transmission electron microscopy (TEM, HF-2000, Hitachi, Japan) and thermogravimetry-differential thermal analysis (TG-DTA, EXSTAR6000 TG-DTA, Seiko, Japan). The average size and geometrical standard deviation of the primary particles were determined by observing 300 randomly sampled particles in TEM photographs. TG-DTA was conducted in air from 20°C to 1000°C at a heating rate of 10°C/min. The particle size distributions of the TiO2 nanoparticles were measured using a differential mobility analyzer (DMA)-condensation nucleus counter (CNC) system. The titania particles acquired a bipolar charge distribution in an Am-241 α-ray source and were subsequently classified by DMA (TSI model 3071). The aerosol stream was passed through the shortest length of tubing so as to reduce the loss of particles by diffusion up to the particle detection points. In addition, the monodisperse particle stream was sent to a CNC (TSI model 3022A) to measure the particle number concentration. Excessive aerosol flow was purged. The TTIP and TiCl4 precursor concentrations were varied from 7.68 × 10− 8 to 1.54 × 10− 4 mol/l and from 7.59 × 10− 7 to 1.52 × 10− 4 mol/l, respectively, at a constant total flow rate of 2 l/min. To determine the effect of particle sizes on crystallinity, the total flow rate was changed from 0.25 to 10 l/min at a constant TTIP precursor concentration of 7.68 × 10− 7 mol/l.
FIG. 1 Schematic diagram of the experimental system.
RESULTS AND DISCUSSION
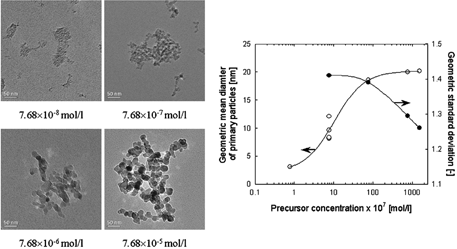
TiO2 nanoparticles produced by both the thermal decomposition of TTIP and the oxidation of TiCl4 have an anatase crystal structure at reaction temperatures above 1200°C, as reported in our previous study (CitationNakaso et al. 2003; CitationKim et al. 2004). Thus, to investigate the effects of TTIP precursor concentration on particle size and crystallinity, the molecular concentration of the precursor was varied from 7.68 × 10− 8 to 1.54 × 10− 4 mol/l at a constant total flow rate of 2 l/min and a reactor temperature of 1200°C. shows TEM images of titania nanoparticles produced by the thermal decomposition of TTIP at different precursor concentrations. The primary particle diameter and the geometric standard deviation were obtained from TEM images as a function of precursor concentration. Primary particles generated at a low precursor concentration were small and agglomerated. The primary particle size was 3.1 nm at a precursor concentration of 7.68 × 10− 8 mol/l. As the precursor concentration was increased, the primary particle sizes increased, and the morphology of particles also changed. At a precursor concentration greater than 7.68 × 10− 5 mol/l, the primary particle size showed a constant value. The geometric standard deviation decreased with precursor concentration, indicating that larger particles with narrow size distributions are produced with an increase in the mole fraction of TTIP. This is due to enhanced coagulation and sintering resulting from the large concentration of TiO2 nuclei generated at high TTIP precursor concentrations (CitationJang and Jeong 1995). Surface reactions are expected to affect the produced particles, leading to the production of larger nuclei, since such reactions are important during the early stages of the particle generation process at higher precursor concentrations (CitationTsantilis et al. 2002).
FIG. 2 TEM images of TiO2 nanoparticles prepared by the thermal decomposition of TTIP under various precursor concentrations. Change in primary particle diameter and geometric mean diameter obtained from TEM images with precursor concentration.
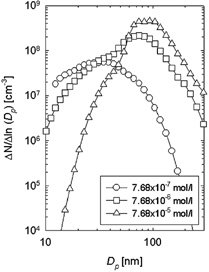
To more clearly show the change in particle size distributions, a DMA-CNC system was used. The DMA technique permits the precise on-line measurement of particle size distribution free from sampling artifacts or artifacts introduced during sample preparation. shows the particle size distributions for TiO2 nanoparticles prepared at various TTIP precursor concentrations using a DMA-CNC system. Total flow rate and the reactor temperature were maintained at 2 l/min and 1200°C, respectively. The particle number concentrations and the peak particle diameter increased with increasing precursor concentration. As a result, the shape of the particle size distribution was changed. In particular, the particle size distribution was narrowed at precursor concentration of 7.68 × 10− 5 mol/l. This corresponds to a decrease in the geometric standard deviation from TEM results. DMA measures the size distribution of particles ranging from single particles to agglomerates as shown in while TEM determines the distribution of primary particles. From the results shown in , it is clear that, as the precursor concentration is increased, the primary particle size, agglomerate size, and particle number concentration increased.
FIG. 3 Change in particle size distributions as a function of TTIP precursor concentration obtained from DMA/CNC system.
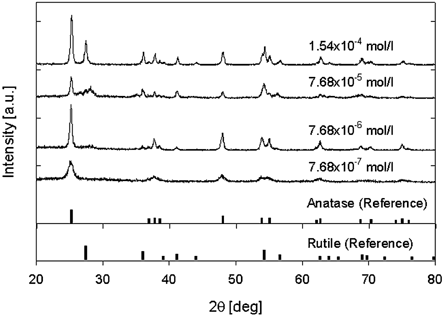
shows X-ray diffraction patterns of TiO2 nanoparticles produced under various precursor concentrations at a reactor temperature of 1200°C. At a precursor concentration of 7.68 × 10− 7 mol/l, the TiO2 particles were in the anatase phase. As the precursor concentration was increased to 10 times, the crystallinity of the anatase was sharply increased, and a transformation from anatase to rutile occurred, even though the prepared particles were nearly completely anatase. The anatase-to-rutile transformation apparently occurred at precursor concentration of 7.68 × 10− 5 mol/l, and the XRD pattern showed peaks corresponding to both anatase and rutile. When the precursor concentration was increased to 1.54 × 10− 4 mol/l, the rutile peak abruptly increased. The crystalline size of particles was calculated using the Scherrer relationship. At precursor molecular concentration of 7.68 × 10− 7 mol/l, 7.68 × 10− 6 mol/l, and 7.68 × 10− 5 mol/l, the crystalline sizes were 10.69 nm, 23.66 nm, and 24.11 nm, respectively. This indicates that the crystalline sizes were similar to the primary particle diameter from TEM images. The fraction of rutile present in the particles was calculated using the following equation (CitationSpurr and Myers 1957):
FIG. 4 X-ray diffraction pattern of titania nanoparticles under various precursor concentrations (source gas: TTIP).
As mentioned above, the transformation may be affected by factors such as the method used in the preparation, the precursors, impurities, oxygen vacancies and the primary particle sizes of anatase, and so on (CitationAkhtar et al. 1992; CitationXia et al. 1999). CitationGribb and Banfield (1997) and CitationZhang and Banfield (1998) reported that the critical size at which anatase begins to transform to rutile is approximately 14 nm, and when the particle size is above 14 nm, rutile is more stable than anatase. In addition, CitationArabi-Katabi and colleagues(2002) reported that the transformation increased with increasing TTIP flow rate by the oxidation of TTIP in flame aerosol synthesis. However, their results did not indicate a grain size dependence for the anatase-to-rutile phase transformation. They also proposed that the presence of carbon in the process may also affect the transformation of anatase to rutile (CitationArabi-Katabi et al. 2001). The findings herein show a particle size dependence for the anatase-to-rutile phase transformation as shown in . Furthermore, TiO2 nanoparticles collected on the filter had gray or black colors at precursor concentrations above 7.68 × 10− 6 mol/l, while the synthesized TiO2 nanoparticles were white at precursor concentrations below 7.68 × 10− 6 mol/l. This suggests an effect by organic carbon on the transformation. In this respect, two factors may be in play, primary particle size and impurity, that may affect the transformation, based on the present experimental results.
In order to more clearly show the effect of primary particle size on the transformation, the residence time was varied at a constant input precursor concentration. The primary particle size of the produced nanoparticles is affected by the coagulation and sintering, and the latter are related to factors such as reaction temperature, residence time, and primary particle size. Previous studies (CitationNakaso et al. 2003; CitationKim et al. 2004) reported on the effect of reaction temperature on both the early and late stages in the particle formation process, leading to a change in particle size distribution, morphology, and crystallinity. To the contrary, the residence time affected the growth of the generated particles. Thus, primary particle size can be controlled by changing the residence time. If the transformation is dependent on grain size, a rutile phase would appear under conditions in which the primary particle diameter was larger than 14 nm.
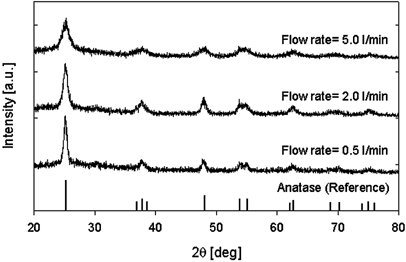
In our experiment, the total flow rate was changed from 0.25 l/min to 10 l/min while the input TTIP precursor concentration was maintained at a constant value at 7.68 × 10− 7 mol/l. The reactor temperature was set at 1200°C. shows TEM images of TiO2 nanoparticles prepared under various total flow rates, and the change in primary particle diameter as a function of total flow rate. In addition, shows X-ray diffraction patterns of TiO2 nanoparticles produced under varioust otal flow rates at reactor temperature of 1200°C. As the total flow rate was decreased—an increase in residence time in the reactor—the primary particle diameter increased. These results suggest that coagulation and sintering are enhanced with an increase in residence time. However, the transformation from anatase to rutile was not observed as shown in , even though the primary particle diameter at a flow rate of 0.5 l/min was larger at a precursor concentration of 1.54 × 10− 4 mol/l as shown in . The XRD patterns show that the prepared TiO2 nanoparticles were in an anatase phase.
FIG. 5 TEM images of TiO2 nanoparticles prepared by the thermal decomposition of TTIP under various total flow rates. Change in primary particle diameter and geometric mean diameter obtained from TEM images with total flow rates.
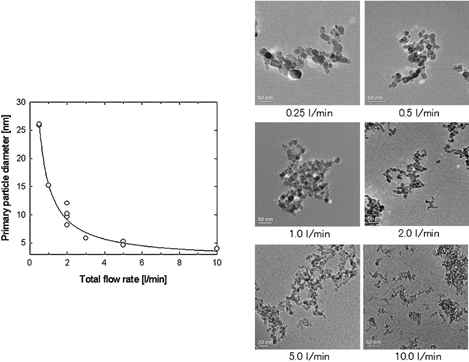
FIG. 6 X-ray diffraction pattern of titania nanoparticles under various total flow rates (source gas: TTIP).
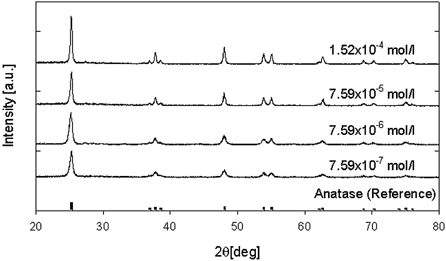
Next the particle sizes and crystallinity of TiO2 nanoparticles produced via the oxidation of TiCl4 were measured to show the effect of particle sizes, impurities, and organic carbons on the transformation. In the oxidation of TiCl4 by a CVD method, organic carbon would not be expected to be produced. shows TEM pictures of collected particles generated by the oxidation of TiCl4 at a furnace temperature of 1200°C. From these images, the average primary particle diameter and the geometric standard deviation as a function of reactor temperature are also plotted in . The molecular concentrations of the precursor were varied from 7.59 × 10− 7 ∼ 7.59 × 10− 5 mol/l at a constant total flow rate of 2 l/min. In , the primary particle diameter increased with increasing precursor concentration. The primary particle size was then over 15 nm at a precursor concentration above 7.59 × 10− 6 mol/l. This result was similar to the tendency of the case of TTIP. However, phase transformation was not detected under any of the experimental conditions used, as shown in . X-ray diffraction patterns show an anatase phase in all TiO2 nanoparticles produced by the oxidation of TiCl4 at different precursor concentrations. This indicates that grain size is independent of the anatase-to-rutile phase transformation.
FIG. 7 TEM images of TiO2 nanoparticles prepared by the oxidation of TiCl4 under various precursor concentrations. Change in primary particle diameter and geometric mean diameter obtained from TEM images with precursor concentration.
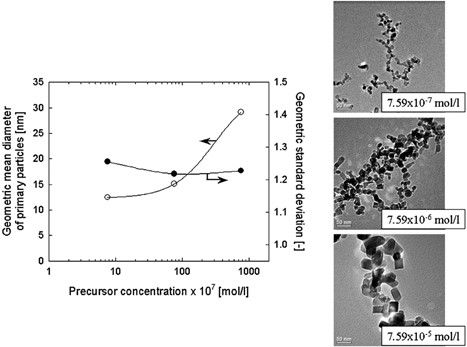
FIG. 8 X-ray diffraction pattern of titania nanoparticles under various total flow rates (source gas: TiCl4).
To illustrate the effects of impurities on the transformation, TiO2 nanoparticles produced at different precursor concentrations were characterized for thermal stability by TG-DTA. shows the results of the TG-DTA for TiO2 produced by the thermal decomposition of TTIP () and the oxidation of TiCl4 (). When the precursor concentration was 7.68 × 10− 7 mol/l, no exothermic peak appeared on the DTA curve, and the total mass loss was 8.75%. This weight loss is attributed to the oxidation of organic residues from the precursor. The weight loss below 200°C is due to adsorbed water as the result of the exposure of the samples to air. At a precursor concentration of 7.68 × 10− 7 mol/l, and a temperature below 200°C, mass loss was much higher than that for concentration of 7.68 × 10− 5 mol/l and 1.54 × 10− 4 mol/l due to the smaller particle size, or larger specific surface area. However, as the precursor concentration was increased to 7.68 × 10− 5 mol/l and 1.54 × 10− 4 mol/l, exothermic peaks were detected at 462°C and 475°C, respectively. In addition, the exothermic peak was in the range of a significant mass loss, which is attributed to the oxidation of organic impurities, such as carbon residue. From the TG-DTA curves and the production rates for TiO2 nanoparticles, the carbon concentration in TiO2 nanoparticles prepared at precursor concentration of 1.54 × 10− 4 mol/l was 1.25 times larger than that of 7.68 × 10− 5 mol/l, assuming that all the weight loss at a temperature above 200°C was due to the oxidation of carbon. This indicates an increase in carbon concentration in TiO2 nanoparticles with increasing TTIP precursor concentrations.
FIG. 9 TG-DTA curves of titania nanoparticles prepared by the thermal decomposition of TTIP (a) and the oxidation of TiCl4 (b) at various precursor concentrations.
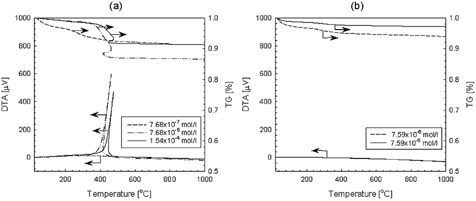
In the DTA curve, an exothermic peak was not observed at temperatures above 480°C, indicating that no crystallization or phase transition occurred in this temperature range. Furthermore, there was no peak on the DTA curve for TiO2 nanoparticles produced by the oxidation of TiCl4. This result, therefore, proves the effect of impurities—organic carbon—on the transformation.
CONCLUSION
The effects of precursor concentration and total flow rate on particle size, crystalline phase, and phase transformation were investigated for titania nanoparticles produced from two precursors (TTIP and TiCl4) using a CVD method. The titania nanoparticles had primary particle sizes of 3–29 nm. TEM and DMA measurements show that the particle sizes increase with increasing precursor concentrations and decreasing total flow rate, which is attributed to an enhancement in coagulation, sintering, and surface reactions. All nanoparticles were in the anatase phase except those produced from TTIP at concentrations above 7.68 × 10− 6 mol/l. The anatase-to-rutile phase transformation is enhanced by increasing TTIP concentrations, especially for concentrations above 7.68 × 10− 6 mol/l. Although many other studies have reported that phase transformation depends on the grain size of TiO2 nanoparticles, this research reveals that residue carbon in the TiO2 nanoparticles is responsible for the transformation, although further mechanistic studies will be needed to verify this.
ACKNOWLEDGMENT
The authors wish thanks Mr. Masatoshi Tomonaga (Nitto Denko Co.) for helping with the experiment. This study was supported (in part) by funds from the Grant-in-Aid for Scientific Research on Priority Areas under Grant No. 14048216 from Ministry of Education, Culture, Sports, Science and Technology, in Japan and a Grant-in-Aid for Scientific Research (B) (No. 15360413) by Japan Society for the Promotion of Science (JSPS). In addition, this work was supported in part by the New Energy and Industrial Technology Development Organization (NEDO)'s “Nanotechnology Materials Program—Nanotechnology Particle Project” based on funds provided by the Ministry of Economy, Trade and Industry, Japan (METI).
REFERENCES
- Akhtar , M. K. , Pratsinis , S. E. and Mastrangelo , S. V. R. 1992 . Dopants in Vapor-Phase Synthesis of Titania Powders . J. Am. Ceram. Soc. , 75 : 3408 – 3416 . http://www.csa.com/htbin/linkabst.cgi?issn=0002-7820&vol=75&iss=&firstpage=3408
- Arabi-Katbi , O. , Pratsinis , S. E. , Morrison , P. W. Jr. and Megaridis , C. M. 2001 . Monitoring the Flame Synthesis of TiO2 Particles by In-situ FTIR Spectroscopy and Thermophoretic Sampling . Combust. Flame , 124 : 560 – 572 . http://dx.doi.org/10.1016%2FS0010-2180%2800%2900227-3
- Arabi-Katbi , O. , Wegner , K. and Pratsinis , S. E. 2002 . Aerosol Synthesis of Titania Nanoparticles: Effect of Flame Orientation and Configuration . Ann. Chim. Sci. Mat. , 27 : 37 – 46 . http://dx.doi.org/10.1016%2FS0151-9107%2802%2990013-9
- Deppert , K. , Schmidt , F. , Krinke , T. , Dixkens , J. and Fissan , H. 1996 . Electrostatic Precipitator for Homogeneous Deposition of Ultrafine Particles to Create Quantum-dot Structures . J. Aerosol Sci. , 27 : S151 – S152 . http://dx.doi.org/10.1016%2F0021-8502%2896%2900148-6
- Gribb , A. A. and Banfield , J. F. 1997 . Particle Size Effects on Transformation Kinetics and Phase Stability in Nanocrystalline TiO2 . Am. Mineral. , 82 : 717 – 728 .
- Jang , H. D. and Jeong , J. 1995 . The Effect of Temperature on Particle Size in Gas-phase Production of TiO2 . Aerosol Sci. Technol. , 23 : 553 – 560 .
- Hu , Y. , Tsai , H. L. and Huang , C. L. 2003 . Phase Transformation of Precipitated TiO2 Nanoparticles . Materials Sci. & Eng. , A344 : 209 – 214 . http://dx.doi.org/10.1016%2FS0921-5093%2802%2900408-2
- Kim , C. S. , Okuyama , K. , Nakaso , K. and Shimada , M. 2004 . Direct Measurement of Nucleation and Growth Modes in Titania Nanoparticles Generation by a CVD Method . J. Chem. Eng. Japan , 37 : 1379 – 1389 . http://dx.doi.org/10.1252%2Fjcej.37.1379
- Nakaso , K. , Okuyama , K. , Shimada , M. and Pratsinis , S. E. 2003 . Effect of Reaction Temperature on CVD-made TiO2 Primary Particle Diameter . Chem. Eng. Sci. , 58 : 3327 – 3335 . http://dx.doi.org/10.1016%2FS0009-2509%2803%2900213-6 http://www.csa.com/htbin/linkabst.cgi?issn=0009-2509&vol=58&iss=&firstpage=3327
- Nakaso , K. , Fujimoto , T. , Seto , T. , Shimada , M. , Okuyama , K. and Lunden , M. M. 2001 . Size Distribution Change of Titania Nano-particle Agglomerates Generated by Gas Phase Reaction . Aerosol Sci. Technol. , 35 : 929 – 947 . http://dx.doi.org/10.1080%2F02786820126857
- Okuyama , K. , Kousaka , Y. , Tohge , N. , Yamamoto , S. , Wu , J. J. , Flagan , R. C. and Seinfeld , J. H. 1986 . Production of Ultrafine Metal Oxide Aerosol Particles by Thermal Decomposition of Metal Alkoxide Vapors . AIChE J. , 32 : 2010 – 2019 . http://dx.doi.org/10.1002%2Faic.690321211
- Seto , T. , Shimada , M. and Okuyama , K. 1995 . Evaluation of Sintering of Nanometer-sized Titania using Aerosol Method . Aerosol Sci. Technol. , 23 : 183 – 200 .
- Spurr , R. A. and Myers , H. 1957 . Quantitative Analysis of Anatase-Rutile Mixture with an X-ray Diffractometer . Anal. Chem. Res. , 29 : 760 – 762 .
- Sun , Y. , Li , A. , Qi , M. , Zhang , L. and Yao , X. 2001 . High Surface Area Anatase Titania Nanoparticles Prepared by MOCVD . Materials Sci. & Eng. , B86 : 185 – 188 . http://dx.doi.org/10.1016%2FS0921-5107%2801%2900697-3
- Tsantilis , S. , Kammler , H. K. and Pratsinis , S. E. 2002 . Population Balance Modeling of Flame Synthesis of Titania Nanoparticles . Chem. Eng. Sci. , 57 : 2139 – 2159 . http://dx.doi.org/10.1016%2FS0009-2509%2802%2900107-0 http://www.csa.com/htbin/linkabst.cgi?issn=0009-2509&vol=57&iss=&firstpage=2139
- Xia , B. , Huang , H. and Xie , Y. 1999 . Heat Treatment on TiO2 Nanoparticles Prepared by Vapor-Phase Hydrolysis . Materials Sci. & Eng. , B57 : 150 – 154 . http://dx.doi.org/10.1016%2FS0921-5107%2898%2900322-5
- Zhang , H. and Banfield , J. F. 1998 . Thermodynamic Analysis of Phase Stability of Nanocrystalline Titania . J. Mater. Chem. , 8 : 2073 – 2076 . http://dx.doi.org/10.1039%2Fa802619j http://www.csa.com/htbin/linkabst.cgi?issn=0959-9428&vol=8&iss=&firstpage=2073