Ammonium nitrate and semivolatile organic compounds (SVOC) are significant components of fine particles in many urban atmospheres. These components, however, are not properly measured by current EPA accepted methods, such as the R&P TEOM monitor, due to loss of semivolatile material (SVM) from particles in the heated environment of the filter during sampling. The accurate determination of semivolatile material is important due to the possible effects of these species on human health, visibility, and global climate change. The concentration and composition of fine particulate material were determined using a combination of continuous and integrated samplers at the Brigham Young University–EPA Environmental Monitoring for Public Access and Community Tracking (BYU–EPA EMPACT) monitoring site in Salt Lake City, Utah over a six–day sampling period (30 January to 4 February) during the winter of 2001. Continuous samples were collected using a RAMS (total PM2.5 mass), a TEOM monitor (nonvolatile PM2.5 mass), an Aethalometer (elemental carbon), a TSI CPC (particle count), and a Nephelometer (light scattering by particles, bsp). Fine particle composition and mass were determined on a three–hour basis using the PC–BOSS diffusion denuder sampler. Total PM2.5 mass–determined with the RAMS agreed with constructed mass determined from the chemical composition measured in collocated PC–BOSS–integrated samples. Results from this study indicate that semivolatile material (ammonium nitrate and semivolatile organic compounds) is a significant component of fine particle mass. Semivolatile organic compounds were the major contributor to light scattering during the six–day sampling period. Semivolatile nitrate, but not organic material, was suggested to be hygroscopic by the nephelometric data. The majority of the SVM observed appeared to be secondary material formed from photochemical reactions of the organic and NOx emissions from mobile sources and wood smoke combustion.
INTRODUCTION
Human health endpoints associated with exposure to airborne particulate matter (PM) include increased mortality and morbidity from respiratory and cardiopulmonary disease (CitationPope 2001a; CitationSchwartz et al. 1996; CitationUSEPA 1996). The observed exacerbation of health problems is believed to be associated with exposure to fine particles (PM2.5). As a result, the US Environmental Protection Agency promulgated annual and 24 h fine PM standards with PM2.5 measured according to the Federal Reference Method (PM2.5 FRM) as the indicator (CitationSchaefer et al. 1997). Ambient fine PM is not a single pollutant but a mixture of many chemical species that are dominated in urban environments by primary and secondary aerosols from combustion emissions (CitationWilson and Suh 1997). Components include sulfate, nitrate, ammonium, and hydrogen ions; trace elements (including toxic and transition metals); organic material; and elemental carbon (EC). Stable species such as sulfate can be accurately measured by single filter samplers such as the PM2.5 FRM (CitationSchaefer et al. 1997; CitationMusick 2000). However, semivolatile fine particulate species such as water, ammonium nitrate, and organic compounds (SVOC) are not accurately determined by single–filter sampling techniques (CitationEatough et al. 1999; CitationHerring et al. 1999; CitationLewtas et al. 2001; CitationPang et al. 1999). Losses of SVM from particles collected on the filter or adsorption of gas–phase organic compounds can occur during sampling and equilibration (CitationEatough et al. 2003a; CitationLong et al. 2002, Citation2003a).
Recent studies at Brigham Young University in which a panel of subjects were exposed to environmental tobacco smoke have shown that the effect of exposure to particulate pollution on autonomic heart function and development of inflammation occurs within the order of hours (CitationPope et al. 2001b, Citationc). Similarly, upon removal from exposure recovery from the above effects is also within hours. Therefore, short–term sampling and characterization may be important for studying the physiological mechanisms related to PM2.5 exposure. In addition, it is reasonable to hypothesize that semivolatile mutagenic material formed in urban atmospheres may also contribute to the exacerbation of adverse health effects. Therefore, advanced sampling methods that determine PM2.5 semivolatile material on a short–term basis are desirable. Regulatory agencies with a mandate to protect public health should consider implementing monitoring networks that will allow for more correct measurement of diurnal variations in total PM2.5 concentration and composition (including semivolatile species). Short–term diurnal characterization of major PM2.5 components will provide information on changes in concentration, air mass movement, and source contributions.
In addition to affecting health, ambient fine particulate material has a direct effect on light extinction. Light extinction processes include scattering and absorption by gases and airborne particles. Components such as ammonium sulfate, ammonium nitrate, and organic material provide a major portion of the aerosol mass in most urban environments, and these particles can effectively scatter the visible wavelengths of light. The scattering of light by these particles can result in visibility impairment and changes in the global radiative balance as well as other climate effects. SVOCs and water are significant components of ambient fine PM. These semivolatile components might also play an important role in the scattering of light by fine PM and must therefore be included in light–scattering calculations.
This article reports on changes in aerosol composition, characteristics, and source contributions during an intensive monitoring program at the Brigham Young University–EPA Environmental Monitoring for Public Access and Community Tracking (BYU–EPA EMPACT) monitoring site in Salt Lake City, Utah. One– and three–hour samples were collected over a six–day period using a combination of continuous and integrated samplers that allow for the determination of fine particle mass, particle count, light scattering by particles, and chemical composition.
EXPERIMENTAL METHODS AND PROCEDURES
Sampling Site
The EPA EMPACT monitoring site is located immediately adjacent to the State of Utah Air Quality Monitoring site at the Hawthorne Elementary School in Salt Lake City, Utah. The site is in a residential area approximately 4 km southeast of the central business district. The population in Salt Lake Valley is approximately 750,000. PM2.5 pollution at the site is expected to be dominated by primary particles from mobile sources and, during the winter, wood smoke from home combustion as well as their secondary formation products. There are no major point sources that are expected to make a significant impact at the Hawthorne site.
Sampling Period
Data were obtained throughout the year from 1999–2002 at the EMPACT Hawthorne site. Data given in this article are taken from samples collected from 30 January 2001 through 4 February 2001.
Sampling Methods
R&P TEOM Monitor
One–hour averaged, nonvolatile PM2.5 mass concentrations were determined using an R&P TEOM monitor operating with a filter temperature of 30°C (CitationPatashnick and Rupprecht 1991). The elevated temperature is required to prevent collection of water (CitationMignacca and Stubbs 1999). However, semivolatile PM will evaporate at 30°C during winter months. This technique is considered to measure nonvolatile PM, i.e., PM that does not volatilize at the stated operating temperature. The extent of volatization is expected to be dependent on the exact operational conditions of the TEOM monitor (CitationLong et al. 2003b).
RAMS
The Real–time total Ambient Mass Sampler (RAMS), based on diffusion denuder, Nafion dryer, and TEOM monitor technologies, was used for the continuous determination of total PM2.5 mass including semivolatile material (SVM: semivolatile ammonium nitrate and SVOC; CitationEatough et al. 1999, Citation2001, Citation2003a; CitationLong et al. 2003a). The RAMS measures total PM2.5 mass with a TEOM monitor using a “sandwich” filter to retain SVM that would be lost from particles in a conventional TEOM monitor. The sandwich filter consists of a Teflon–coated particle collection filter (R&P TX40) followed by a charcoal–impregnated glass fiber filter (CIG, Schleicher and Schuell, Dassel, Germany) to collect any semivolatile compounds lost from the particles during sampling. Care must be taken to remove from the sample stream all gas–phase species that can be absorbed by the CIG filter in order to prevent overdetermination of PM2.5 mass. The configuration and operation of the RAMS as used in the EMPACT study has been previously described (CitationEatough et al. 2001; CitationLong et al. 2000, Citation2001). RAMS data were averaged over 1 and 3 h periods throughout the study period for comparison with TEOM and PC–BOSS data.
Anderson Aethalometer
An Anderson Instruments Inc. (Model RTAA–900) Aethalometer was used for the determination of aerosol EC on a continuous basis. In addition to the EC result, the Aethalometer also provides a continuous UV (350 nm) channel result, indicative of polyaromatic hydrocarbon containing particles, e.g., fresh diesel emissions, and combustion products from sources such as “smoking” spark–ignition vehicles, biomass burning, or cooking (CitationHansen 2002). One– and three–hour EC concentration averages and UV channel results were obtained during the sampling period and compared with the 1 h averaged TEOM and RAMS data and 3 h integrated EC results obtained from the PC–BOSS.
Optec Integrating Nephelometer
An Optec NGN–2 Integrating Nephelometer was used for the measurement of the scattering coefficient of ambient fine PM (bsp). Three–hour averaged bsp results were obtained for comparison with three–hour mass and chemical composition data.
TSI CPC Monitor
A TSI monitor (Model 3022) was used to determine total fine particle number. Total particle number will be dominated by ultrafine particles (<100 nm). It is assumed that results obtained from the TSI condensation particle counter (CPC) will be a measure of ambient ultrafine particles. This instrument is a real–time monitor, and therefore data were averaged over 1 h periods throughout the study.
PC–BOSS
The combination of technologies used in the High–Volume Brigham Young University Organic Sampling System (BIG BOSS) (CitationTang et al. 1994) and the Harvard particle concentrator (CitationSioutas et al. 1994) has resulted in the Particle Concentrator–Brigham Young University Organic Sampling System (PC–BOSS) (CitationDing et al. 2001; CitationEatough et al. 1999; CitationLewtas et al. 2001). The configuration and operation of the PC–BOSS as used in the Salt Lake EMPACT program has been previously described (CitationEatough et al. 2003a; CitationLewtas et al. 2001; CitationLong et al. 2000).
The PC–BOSS was used for sample collection to determine fine particulate mass, trace elements, sulfate, carbonaceous material (EC and organic carbon (OC)), nitrate, semivolatile organic material, and semivolatile nitrate. Samples for the chemical characterization of PM2.5 in the minor flow following a particle concentrator and a BOSS diffusion denuder are collected in a filter pack containing a prefired 47 mm quartz filter (Pallflex) followed by 47 mm charcoal–impregnated glass fiber filter (CIG, Schliecher and Schuell) to determine fine particulate carbonaceous material and nitrate, including semivolatile species lost from the particles during sampling. A second parallel filter pack containing a 47 mm Teflon (Whatman) filter followed by a 47 mm Nylon (Gelman, Nylasorb) filter is used to determine PM2.5 filter retained (nonvolatile) mass, sulfate and nitrate, including any nitrate lost from the particles during sample collection. A side–flow filter pack, prior to the particle concentrator, containing a 47 mm polycarbonate (Corning, Nuclepore, 0.4 m pore size) filter followed by a 47 mm CIG collects particles and gas–phase organic material after the 2.5 m inlet cut. These data are compared to data from the minor flow filters to determine the particle concentrator efficiency (CitationDing et al. 2001; CitationEatough et al. 1999; CitationLewtas et al. 2001). Samples were collected every 3 h for comparison with 3 h averaged continuous monitor data.
Gas Phase Data
Hourly averaged concentrations of CO and NOx were obtained from the State of Utah Department of Environmental Quality. These data were used in combination with hourly PM2.5 data in a source apportionment study to identify the major combustion sources of primary and secondary PM2.5 in the Salt Lake Valley (CitationLong et al. 2003a).
Analytical Methods
Mettler UMT2 Microbalance
A Mettler UMT2 Microbalance was used for the determination of collected fine particle mass on a 47 mm Teflon (Whatman) filter sampled from the PC–BOSS minor flow. Teflon filters were equilibrated according to EPA PM2.5 FRM protocols prior to sample weighing for both pre– and postsampling weights.
TPV Analysis
Temperature programmed volatilization (CitationTang et al. 1994; CitationEllis and Novakov 1982) was used in the analysis of collected samples for total carbonaceous material. In this method, the various sample filters are heated from ambient temperature at a predetermined ramp rate to a predetermined termination temperature. The ramp rate and termination temperatures are dependent on the type of filter being analyzed. Quartz filters are heated to 800°C in an N2/O2 atmosphere. Charcoal–impregnated filters are heated to 400°C in an N2 atmosphere. Carbon in compounds desorbed from the filters during the heating process is catalytically converted to CO2 and detected by nondispersive infrared absorption.
Dionex Ion Chromatograph
A Dionex Model 500 ion chromatograph with a separator column, anion fiber suppressor, and conductivity detector was used for the analysis of collected samples for nitrate and sulfate. Sample filters are ultrasonically extracted, and the concentrations of sulfate and nitrate in the various solutions were determined by peak area measurement and comparison to standards.
PIXE
Proton–induced X–ray emission (PIXE) was used for the determination of trace metals on selected samples collected on nuclepore filters in the PC–BOSS sideflow (CitationMangelson et al. 1979).
RESULTS AND DISCUSSION
Continuous Monitor Results
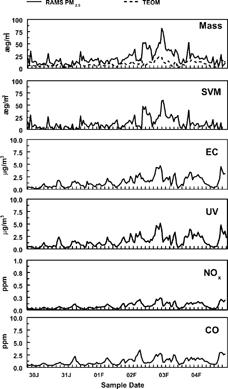
The 1 h average RAMS and TEOM monitor results obtained during the sampling period are given in . This figure illustrates changing PM2.5 concentrations over the six–day period with the formation and breakup of a high pressure system (inversion) over the Salt Lake Valley. RAMS PM2.5 mass measurements are generally equal to or greater than the TEOM PM2.5 mass measurements preceding, during, and following the inversion. The highest PM2.5 concentrations during this study period occurred during 2–3 February 2001, corresponding to the period of heaviest inversion. During this time period, mid–morning and late evening PM2.5 peaks are observed. These peaks are most likely associated with the daily traffic patterns in the Salt Lake area. However, on 3–4 February 2001 these peaks are not readily visible due to these dates being associated with a weekend and the disruption of normal traffic patterns. For the six–day sampling period, the RAMS and TEOM mass averages were 18.8 and 8.4 μg/m3, respectively. The higher RAMS PM2.5 mass, compared to that of the TEOM monitor can be attributed to the presence of semivolatile material, which is measured by the RAMS, but not by the TEOM. The linear regression results of 1 h average RAMS total versus TEOM nonvolatile PM2.5 mass are given in . The low slopes and low R2 values for the comparison are a result of the SVM loss from the heated filter of the TEOM monitor. The 1 h average EC and particle number results obtained during the sampling period are given in , respectively. The EC results tend to agree with both RAMS and TEOM Monitor results with respect to daily trends and diurnal patterns. In contrast, particle number peaks often occur in the absence of a corresponding mass peak (). These particle number peaks indicate the presence of ultrafine particles that will contribute to total particle number but have little effect on mass concentrations.
Figure 1Comparison of A) the one–hour average RAMS and TEOM PM2.5 mass, B) Anderson Aethalometer EC results, and C) TSICPC results at the Salt Lake City EMPACT site from 30 January to 04 February 2001.
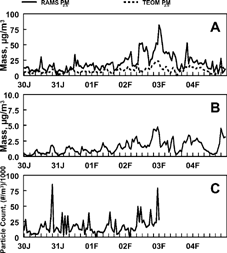
Table 1 Results of the statistical analysis of PM2.5 one– and three–hour samples
Comparison of PC–BOSS with RAMS and Aethalometer Results
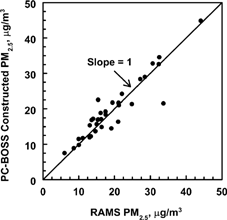
Integrated PC–BOSS samples were used to determine the mass of PM2.5, including material retained on a filter and semivolatile nitrate and organic material lost from the filter during sampling. PC–BOSS sulfate and nitrate were assumed to be present as ammonium sulfate and ammonium nitrate, respectively, since the Salt Lake City atmosphere contains excess ammonia (CitationRen 1999). It was assumed that fine particulate organic material was 61% carbon, typical of an aged urban aerosol (CitationTurpin and Lim 2001). Crustal material was estimated according to PIXE analyses results for Al and Si. Their crustal abundance and constructed mass was obtained for each PC–BOSS sample and was calculated as the sum of estimated crustal material, ammonium sulfate obtained from the Teflon filters, the ammonium nitrate from the Teflon filters, the semivolatile ammonium nitrate from the Nylon filters, the EC collected on the quartz filters, and the total organic carbonaceous material, which is the sum of the organic material on the quartz filter (defined as nonvolatile organic material) and the semivolatile organic material, defined as the organic material lost from the particles during sampling but collected on the charcoal–impregnated glass fiber filters. contains the 3 h average PM2.5 composition throughout the study period. During this sampling period, nonvolatile organic material was the major contributor to total PM2.5 mass. Significant amounts of semivolatile ammonium nitrate and SVOC were also present, which would not have been correctly determined with a single filter sampler (). The results obtained by the RAMS for the continuous determination of PM2.5 mass, including semivolatile particulate material were averaged (3 h) during the study period for comparison with results obtained from the PC–BOSS (). The linear regression of RAMS–measured versus PC–BOSS–constructed PM2.5 mass results for the six–day sampling period give R2 = 0.85 (n = 34) with a zero intercept slope of 1.00 ± 0.03 (). Results obtained with the RAMS and the PC–BOSS show that PM2.5 mass, including semivolatile species, can be accurately monitored on a short–term basis at the EPA EMPACT sampling site in Salt Lake City and that single filter samplers such as the TEOM monitor can significantly underestimate PM2.5 mass concentrations.
Figure 2Three–hour average PM2.5 composition as obtained from the PC–BOSS from 30 January to 04 February 2001.
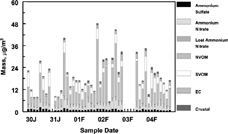
Figure 3Comparison of RAMS measured and PC–BOSS constructed PM2.5 mass for samples collected at the Salt Lake City EMPACT site from 30 January to 04 February 2001.
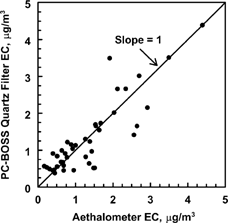
Continuous EC results obtained by the Aethalometer were averaged (3 h) during the study period and compared to the integrated EC results obtained from the quartz filter of the PC–BOSS (). The PC–BOSS–determined EC concentration has an estimated uncertainty of ±25% and is probably less precise than the Aethalometer measurement. The linear regression of Aethalometer versus PC–BOSS–determined EC for the six–day sampling period give R2 = 0.74 (n = 43) with a zero intercept slope of 0.95 ± 0.05 (). The uncertainty in this comparison (± 26%) is consistent with the estimated uncertainty in the PC–BOSS EC results. Results obtained with the Aethalometer and the PC–BOSS show that comparable results for EC can be obtained using both continuous and integrated monitoring methods.
Figure 4Comparison of Aethalometer and PC–BOSS EC results for samples collected at the Salt Lake City EMPACT site from 30 January to 04 February 2001.
Light Scattering Results
Mass–scattering coefficients (αi) were calculated by multilinear regression of chemical composition data with 3 h average bsp results (). In this analysis, the following equation was used to estimate constructed particle scattering:
Table 2 Comparison of multi–linear regression calculated and literature αi values for dry fine particulate components, m2/g
A comparison between constructed bsp from the calculated αi values and measured bsp is given in . Linear regression analysis of the results gives (n = 38, R2 = 0.67) a slope of 1.00 ± 0.04, a precision of ± 7.8 Mm−1 (18.7% of the average bsp), and a bias of −1.17 Mm−1. These results show excellent closure between the constructed and measured values for bsp, thus strengthening the assumption that changes in RH have little effect on light scattering by particulate organic material (nonvolatile and semivolatile). The absence of significant outliers in also indicates that major changes in the αi values (i.e., major changes in particle size distribution of the various species) was not present in the various samples. The 3 h average contribution of each species to light scattering is displayed in , showing the dry scattering as the solid black bar and the increase due to RH as the stacked hashed bar for ammonium sulfate and ammonium nitrate. The maximum contribution of particle bound water to light scattering occurred during the night when RH values increased with a decrease in ambient temperature (). During the six–day sampling period water increased the scattering of light by an average of 24%. The average, maximum, and minimum, 3 h dry scattering for each species and scattering due to particle–bound water are given in . These data are summarized as a percent of the total scattering in . The greatest particulate contributor to average fine particle light scattering was SVOM, corresponding to an average scattering of 13.5 Mm−1.
Figure 5Comparison of reconstructed and measured bsp.
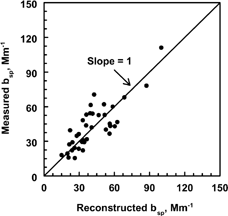
Figure 6Contribution of the various particulate components to the reconstructed light scattering for each sample period. Both the contribution expected for the dry aerosol and the contribution due to the effect of humidity are shown for ammonium sulfate and ammonium nitrate.
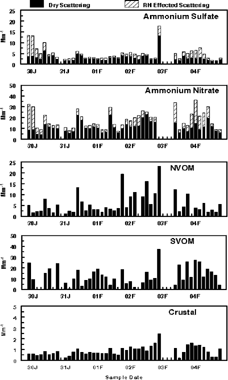
Figure 7Average contribution of fine particulate components to light scattering from 30 January to 04 February 2001.
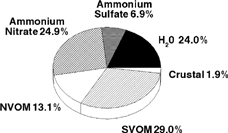
Table 3 Calculated 3–hour dry scattering, Mm−1, due to the various chemical components included in the scattering apportionment
PM2.5 Source Apportionment Results
Comparison of the RAMS and TEOM data indicated that a significant amount of PM2.5 material is lost from the collected particles at the elevated (30°C) temperature of the TEOM probe (). SVM () was calculated as the difference between the RAMS and TEOM measurement. SVM includes both organic material and nitrate lost from the TEOM probe. Possible sources of this SVM can be estimated by comparison of the SVM concentrations (RAMS–TEOM) with various potential tracers of emissions sources. Potential tracers available in the data set were EC, UV, NOx, and CO, which are expected to be emitted from most potential combustion sources. In the EMPACT study area major sources will include diesel emissions, other automotive emissions, and combustion of wood.
Figure 8One–hour average: mass (RAMS and TEOM), SVM (RAMS minus TEOM monitor results), EC, UV, NOX, and CO results at the Hawthorne sampling site from 30 January to 04 February 2001.
The temporal variations in total PM2.5 (RAMS), nonvolatile PM2.5 (TEOM), SVM (RAMS–TEOM), EC, UV, NOx, and CO at Hawthorne during the six–day sampling period are given in . These 1 h averaged concentrations obtained at the sampling site during the six–day period were input into the multivariate receptor model EPA UNMIX (CitationHenry and Norris 2002) to identify major PM2.5 sources and quantify source contributions. For the nonvolatile fraction of fine particle mass, UNMIX yielded a three–component, two–source solution () with a minimum R2 of 0.96, a minimum signal–to–noise ratio of 12.5, and a strength of 3.8 (CitationHenry and Norris 2002). The UNMIX source compositions in are shown as fractions of the average estimated source contribution. The average estimated source contributions are given in μg/m3. The 1 h average estimated source contributions to nonvolatile PM2.5 obtained from the above described analysis for the six–day period are shown in . Based on the source compositions and time patterns for the two sources, they are identified as primary emissions from mobile sources and wood smoke, as indicated in . The low concentrations of both of these sources attributed late on 1 February and again on 3 February are due to the passage of frontal systems. The patterns for nonvolatile PM2.5 from the wood smoke and mobile sources are noticeably different. Wood smoke peaks are normally observed during morning and late evening hours, corresponding to the time that people are in their homes and using wood combustion as a heating source. Mobile source peaks, however, are generally observed during late morning and early evening hours, corresponding to the daily traffic patterns in the Salt Lake City urban area. The concentrations of nonvolatile PM2.5 associated with mobile source and wood smoke emissions averaged 2.2 and 6.5 μg/m3, respectively, during the six–day sampling period (). The high impact from wood smoke may reflect the fact that the EMPACT sampling site is located in a residential area.
Figure 9Comparison of A) nonvolatile and semivolatile primary wood smoke emissions (Source 2 in and ), and B) nonvolatile and semivolatile primary mobile source emissions (Source 1 in and ) from 30 January to 04 February 2001.
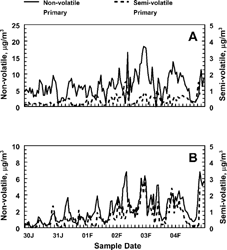
Table 4 UNMIX source compositions and average source contributions to nonvolatile PM2.5 mass determined from one–hour averaged continuous monitor results
Using the same process described above, 1 h average continuous monitor samples collected at the sampling site during the six–day period were input into UNMIX to identify major SVM sources and quantify the source contributions. For the semivolatile fraction of fine particle mass, UNMIX yielded a four–component, three–source solution () with a minimum R2 of 0.99, a minimum signal–to–noise ratio of 2.6, and a strength of 5.9. The sources 1 and 2 are identified as SVM associated with primary mobile and wood smoke emissions, respectively, based on the composition of the sources and the similarity of their time patterns to that for the corresponding nonvolatile source contributions (). The semivolatile mobile source contribution averages 37% of the nonvolatile mobile source contribution. Linear regression comparison of these two species gives R2 = 0.73. The semivolatile wood smoke contribution only averages 2% of the nonvolatile contribution, and for this reason R2 is much lower, 0.20. The results of the 1h average apportionment calculations using UNMIX for the concentrations of primary nonvolatile wood smoke PM2.5 and semivolatile PM2.5 from wood smoke are given in . Similarly, the contributions from primary nonvolatile mobile source PM2.5 and semivolatile PM2.5 from mobile sources is shown in . The small negative composition values (uncertainty includes zero) observed for source 3, , suggest that this source is not associated with primary mobile or wood smoke emissions but is secondary in nature (secondary SVM). Seventy five percent of the PM2.5 measured by the TEOM monitor during this time period is nonvolatile primary wood smoke, with the rest attributed to primary mobile source emissions. In addition, a small semivolatile primary wood smoke (∼3% of the total) and mobile source (∼5% of the total) component is not measured by the TEOM monitor. In contrast, the secondary semivolatile material, source 3, has a different time pattern and is delayed in concentration peaks for the primary wood smoke emissions by 3–6 h (). This is also reflected in the low R2 regression values 0.11, for comparison to the primary nonvolatile species, even though the concentrations are similar. These results suggest that the majority of the SVM is secondary material presumably formed by gas–phase reactions from mobile source and wood–smoke–emitted NOx and gas–phase organic material each day. For the entire sampling period, ∼8% of the SVM was primary in nature and 92% of the SVM was secondary aerosol (SVOM and semivolatile ammonium nitrate). The great majority of the SVM not measured by the TEOM monitor is the secondary organic aerosol formed from photochemical and other reactions from the organic and NOx emissions from mobile sources and wood smoke combustion (CitationLong et al. 2003a). The concentrations of primary and secondary SVM for this sampling period averaged 1.1 and 12.1 μg/m3, respectively.
Figure 10Comparison of primary nonvolatile wood smoke emissions and secondary SVM. This figure shows the time lag associated with the formation of secondary SVM compared to the appearance of the primary wood smoke emission peaks.
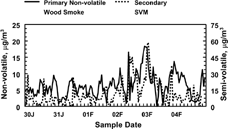
Table 5 UNMIX source compositions and average source contributions to SVM determined from one–hour averaged continuous monitor results
CONCLUSION
This study demonstrated that the PC–BOSS is suitable for integrated measurements of PM2.5 mass and composition, including semivolatile material, for short–term (3 h) sampling periods. Earlier studies have shown that the PC–BOSS is capable of PM2.5 mass measurements for hourly sampling periods (CitationEatough et al. 1999). This study also demonstrated that the real–time total ambient mass sampler (RAMS) can provide a continuous measurement of PM2.5 mass, including semivolatile material, that is in agreement with the integrated measurements of the PC–BOSS. During this study, the TEOM monitor underestimated the total PM2.5 mass by an average of 55%, compared to the measurements of the RAMS and the PC–BOSS, due to losses of semivolatile material from the heated environment of the filter. The major components of fine particles measured with the PC–BOSS during this study period were NVOM (53%), SVOM (21%), ammonium nitrate (19%), ammonium sulfate (6%), EC (6%), and crustal material (4%).
The major particulate species contributing to fine particle light scattering during the study period was SVOM accounting for an average of 29.0% of the light scattering. Ammonium nitrate and NVOM accounted for 24.9 and 13.1% of the fine particle light scattering, respectively. The increase in the mass scattering coefficient of ammonium nitrate and ammonium sulfate with an increase in RH accounted for an average of 24.0% the total fine particle light scattering. RH effects on the mass scattering coefficients of NVOM and SVOC were found to be negligible and are therefore assumed to be zero.
Major sources of nonvolatile fine particulate material at the Salt Lake City EMPACT site include mobile source (25% of the total) and wood smoke (75% of the total) emissions. SVM was a significant component of fine particulate material during the six–day sampling period. SVM is mainly secondary in nature; however, a small contribution from primary SVM (mobile source and wood smoke) was also observed.
The inclusion of semivolatile material in the measurement of PM2.5 mass on a continuous basis using the RAMS, as well as short–term integrated determination of PM2.5 mass and chemical composition with the PC–BOSS, when combined with other monitoring methods currently being used in the Salt Lake City EMPACT program, provided previously unavailable information on the composition, concentration, sources, and light of fine PM suspended in the atmosphere. This information, by providing a more complete description of the PM exposure component for health studies, should provide a better understanding of health–relevant parameters associated with exposure to fine particles.
Acknowledgments
The US Environmental Protection Agency funded and collaborated in the research described in this article under cooperative agreement CR827364 and STAR grant R827993 with Brigham Young University. The views expressed in this article are those of the authors and do not necessarily reflect the views or policies of the EPA or NPS. Mention of trade names or commercial products does not constitute endorsement or recommendation for use. The technical assistance in this research of Rupprecht and Patashnick, Schleicher and Schuell, and ARS is gratefully acknowledged. Cooperation by Art King and Neal Olson of the State of Utah Division of Air Quality in providing the gas–phase data is also gratefully acknowledged.
Notes
a Slopes are given for (1) calculated intercept and (2) zero intercept.
c NA, σcould not be calculated because the sample bias was greater than α.
a NA, αi could not be determined due to low concentrations. Literature value used to correct bsp.
b Eatough et al., 2002.
Related Research Data
REFERENCES
- Ding , Y. , Pang , Y. and Eatough , D. J. 2001 . High Volume Diffusion Denuder Sampler for the Routine Monitoring of Fine Particulate Matter: I. Design and Optimization of the PC-BOSS . Aerosol Sci. Technol. , 36 : 369 – 382 .
- Eatough , D. J. , Obeidi , F. , Pang , Y. , Ding , Y. , Eatough , N. L. and Wilson , W. E. 1999 . Integrated and Real-time Diffusion Denuder Samplers for PM2.5 Based on BOSS, PC and TEOM Technology . Atmos. Environ. , 33 : 2835 – 2844 . [CROSSREF]
- Eatough , D. J. , Eatough , N. L. , Obeidi , F. , Pang , Y. , Modey , W. K. and Long , R. W. 2001 . Continuous Determination of PM2.5 Mass, Including Semi-Volatile Species . Aerosol Sci. Technol. , 34 : 1 – 8 .
- Eatough , N. L. , Long , R. W. , Carter , C. B. and Eatough , D. J. 2002 . Comparison of PM1.0 and PM2.5 Particulate Matter Measured with TEOM and PC-BOSS on the Wasatch Front (Utah) July to September (2001) . Proceedings of A&WMA 95th Annual Conference , June (2002), Paper #(4267)8
- Eatough , D. J. , Long , R. W. , Modey , W. K. and Eatough , N. L. 2003a . Semi-volatile Secondary Organic Aerosol in Urban Atmospheres: Meeting a Measurement Challenge. . Atmos. Environ. , 37 : 1277 – 1292 . [CROSSREF]
- Eatough , D. J. , Cui , W. , Hull , J. and Farber , R. J. 2003b . “ Fine Particle Chemical Composition and Light Extinction at Meadview, Arizona ” . In preparation
- Ellis , E. C. and Novakov , T. 1982 . Application of Thermal Analysis to the Characterization of Organic Aerosol Particles . Sci. Total Environ. , 23 : 227 – 238 . [CROSSREF]
- Hänel , G. 1980 . The Properties of Atmospheric Aerosol Particles as Functions of Relative Humidity at Thermodynamic Equilibria with the Surrounding Air . Advances Geophys. , 19 : 73
- Hänel , G. and Lehman , M. 1981 . Equilibrium Size of Aerosol Particles and Relative Humidity: New Experimental Data from Various Aerosol Types and Their Treatment for Cloud Physics Application. . Atmos. Phys. , 54 : 57 – 71 .
- Hansen , A. D. A. 2002 . The Aethalometer Operating Manual http:((www.mageesci.com(Aethalometer_book_(2002).06.5.pdf, accessed September 16, (2002)
- Henry , R. C. and Norris , G. A. 2002 . EPA UNMIX 2.3 Users Guide
- Herring , S. and Cass , G. 1999 . The Magnitude of Bias in the Measurement of PM2.5 Arising from Volatilization of Particulate Nitrate from Teflon Filters . J. Air Waste Manag. Assoc. , 49 : 725 – 733 .
- Lewtas , J. , Booth , D. , Pang , Y. , Reimer , S. , Eatough , D. J. and Gundel , L. 2001 . Comparison of Sampling Methods for Semi-volatile Organic Carbon (SVOC) Associated with PM2.5 . Aerosol Sci. Technol. , 34 : 9 – 22 .
- Long , R. W. , Thompson , W. , Eatough , N. L. , Eatough , D. J. , Pope , C. A. and Wilson , W. E. 2000 . The Salt Lake City EPA EMPACT Program: I. Sampling Plan and Early Data. . Proceedings, A&WMA 93rdAnnual Conference & Exhibition , Paper No. 952.
- Long , R. W. , Thompson , W. , Eatough , N. L. , Smith , R. , Smith , S. , Eatough , D. J. , Pope , C. A. and Wilson , W. E. 2001 . The Salt Lake City EPA EMPACT Project: II. Year 1: Sampling Procedures and Results. . Proceedings, A&WMA 94thAnnual Conference & Exhibition , Paper No. 265
- Long , R. W. , Smith , R. , Smith , S. L. , Mangelson , N. F. , Eatough , D. J. , Pope , C. A. and Wilson , W. E. 2002 . Sources of Fine Particulate Organic Material Along the Wasatch Front . Energy Fuels , 16 : 282 – 293 . [CROSSREF]
- Long , R. W. , Eatough , N. L. , Mangelson , N. F. , Thompson , W. , Fiet , K. , Smith , S. , Smith , R. , Eatough , D. J. , Pope , C. A. and Wilson , W. E. 2003a . The Measurement of PM2.5, Including Semi-volatile Components, in the EMPACT Program: Results from the Salt Lake City Study . Atmos. Environ. , 37 : 4407 – 4417 . [CROSSREF]
- Long , R. W. , Eatough , N. L. , Eatough , D. J. , Meyer , M. B. and Wilson , W. E. 2003b . Continuous Determination of PM2.5 Mass in the Salt Lake City EPA EMPACT Project: A Comparison of RAMS, SES-TEOM and Conventional TEOM Monitor Results . J. Air Waste Manag. Assoc. , submitted
- Malm , W. C. , Gebhart , K. A. , Molenar , J. , Cahill , T. A. , Eldred , R. A. and Huffman , D. 1994 . Examining the Relationship between Atmospheric Aerosols and Light Extinction at Mount Rainier and North Cascades National Parks . Atmos. Environ. , 28 : 347 – 360 . [CROSSREF]
- Mangelson , N. F. , Nielson , K. K. , Eatough , D. J. , Christensen , J. J. , Izatt , R. M. and Richards , D. O. 1979 . Proton Induced X-Ray Emission Analysis of Pima Indian Autopsy Tissues. . Anal. Chem. , 51 : 1187 – 1194 . [PUBMED] [INFOTRIEVE] [CROSSREF]
- Mignacca , D. and Stubbs , K. 1999 . Effects of Equilibration Temperature on PM10Concentrations from the TEOM Method in the Lower Fraser Valley . J. Air Waste Manag. Assoc. , 49 : 1250 – 1254 .
- Musick , D. 2000 . A Summary of the Ambient Air Program for PM2.5 . Environ. Manager, , February:17–20
- Pang , Y. , Eatough , D. J. and Eatough , N. 1999 . Determination of PM2.5Sulfate and Nitrate with a PC-BOSS Designed for Routine Sampling for Semi-volatile Particulate Matter . J. Air Waste Manag. Assoc. , 49 : 69 – 75 .
- Patashnick , H. and Rupprecht , E. G. 1991 . Continuous PM10Measurements Using the Tapered Element Oscillating Microbalance . J. Air Waste Manag. Assoc. , 41 : 1079 – 1083 .
- Pitts , J. N. and Finlayson-Pitts , B. J. 2000 . Chemistry Of The Upper And Lower Atmosphere . Academic Press , : 349 – 435 . Chap. 9
- Pope , C. A. III, . 2001a . Epidemiology of Fine Particulate Air Pollution and Human Health; Biological Mechanisms and Who's at Risk? . Environ. Health Persp. , : 713 – 723 . 108(Suppl. 4)
- Pope , C. A. III, , Eatough , D. J. , Gold , D. R. , Pang , Y. , Nielsen , K. R. , Nath , P. , Verrier , R. L. and Kanner , R. E. 2001b . Acute Exposure to Environmental Tobacco Smoke and Heart Rate Variability . Environ. Health Persp. , 109 : 711 – 716 . [CSA]
- Pope , C. A. III , Eatough , D. J , Gold , D. R. , Nielsen , K. R. , Leininger , L. , Nath , P. , Modey , W. K. and Kanner , R. E. 2001c . Heart Rate Variability and Inflammatory Response to Short-Term ETS Particle Exposure . Presented at 13thConference of the International Society for Environmental Epidemiology, Germany. ,
- Ren , Y. 1999 . 1. Oxygenated Fuel Use and Formation of Sulfate in the Atmosphere; 2. Design and Evaluation of a New Boss Denuder , Utah : PhP Brigham Young University . PhD diss.
- Schaefer , G. , Hamilton , W. and Mathai , C. V. 1997 . Implementing the Revised NAAQS and the FACA Subcommittee for Ozone, Particulate Matter and Regional Haze . Environ. Manager , Oct.: 22–28.[CSA]
- Schwartz , J. , Dockery , D. W. and Neas , L. M. 1996 . Is Daily Mortality Associated Specifically with Fine Particles? . J. Air Waste Manag. Assoc. , 46 : 927 – 939 . [PUBMED] [INFOTRIEVE] [CSA]
- Sioutas , C. , Koutrakis , P. and Burton , R. M. 1994 . Development and Evaluation of a Low Cutpoint Virtual Impactor . Aerosol Sci. Technol. , 21 : 223 – 235 . [CSA]
- Sisler , J. F. , Malm , W. C. , Gebhart , K. A. , Molenar , J. and Cahill , T. 1992 . The Effect of Relative Humidity on Visibility –Continental Distributions . Proceedings, A&WMA Annual Conference & Exhibition , [CSA]
- Tang , I. N. , Wong , W. T. and Munkelwitz , H. R. 1981 . The Relative Importance of Atmospheric Sulfates and Nitrates in Visibility Reduction . Atmos. 0Environ. , 15 : 2463 – 2471 . [CROSSREF] [CSA]
- Tang , H. , Lewis , E. A. , Eatough , D. J. , Burton , R. M. and Farber , R. J. 1994 . Determination of the Particle Size Distribution and Chemical Composition of Semi-volatile Organic Compounds in Atmospheric Fine Particles . Atmos. Environ. , 28 : 939 – 947 . [CROSSREF]
- Turpin , B. J. and Lim , H. J. 2001 . Species Contributions to PM2.5Mass Concentrations: Revisiting Common Assumptions for Estimating Organic Mass . Aerosol Sc. Technol. , 35 : 602 – 610 . [CROSSREF]
- US Environmental Protection Agency (USEPA) . 1996 . Air Quality Criteria for Particulate Matter , Research Triangle Park, NC : Environmental Protection Agency . EPA(600(P-95(001aF)
- Wilson , W. E. and Suh , H. H. 1997 . Fine Particles and Coarse Particles: Concentration Relationships Relevant to Epidemiologic Studies . J. Air Waste Manag. Assoc. , 47 : 1238 – 1249 . [PUBMED] [INFOTRIEVE] [CSA]