
Abstract
Objective: To explore changes in self-reported disabilities, health, comorbidities and psychological wellbeing (PWB) in aged cohorts over two decades.
Design, setting and subjects: Cross-sectional cohort studies with postal surveys were conducted among community-dwelling people aged 75, 80, 85, 90 and 95 years in 1989 (n = 660), 1999 (n = 2598) and 2009 (n = 1637) in Helsinki, Finland.
Main outcome measures: Self-reported items on disability, self-rated health (SRH), diagnoses and PWB were compared between cohorts of the same age. Standardized mortality ratios (SMRs) were calculated for each study year to explore the representativeness of the samples compared to general population of same age.
Results: A significantly lower proportion of the 75–85-year-olds of the later study years reported going outdoors daily, although this group had improvements in both SRH and PWB scores. The number of comorbidities increased over time among 75–85-year-olds. The only significant change that could be verified among 90- and 95-year-olds between 1999 and 2009, was the lower proportion of participants going outdoors daily. The trend of leveling-off in disabilities was not explained by the SMRs (0.90, 0.71 and 0.60 for 1989, 1999 and 2009).
Conclusions: The latest older people’s cohorts showed an end to previously reported improvements in disabilities, despite having favorable trends in SRH and PWB. Primary care may be faced with increasing need of appropriate services for their senior members.
Introduction
A large proportion of general practitioners’ (GP) patients are older people. This share will increase in the future. Researchers worldwide have investigated whether increasing life expectancies of populations entail additional years of morbidity or disability among older people, or could the period of morbidity and disability be compressed [Citation1]. There are data supporting these theories in different European countries [Citation2]. Researchers have mainly investigated functional limitations or disability trends in successive cohorts [Citation3]. However, favorable trends in disability do not necessarily mean improved health and wellbeing of older people: looking further into comorbidities, self-perceptions of health and psychological wellbeing (PWB) would increase knowledge of cohort trends, and their needs for health services. Older people’s disabilities, comorbidities and wellbeing is a relevant topic when considering primary care resources.
A large number of studies have suggested that the later born cohorts of the oldest-old show less functional limitations [Citation4,Citation5] or less disabilities than the earlier born cohorts [Citation4–7]. Studies have consistently suggested that the prevalence of disability in the older population decreased over two decades until early 2000 [Citation4,Citation6,Citation8–10]. However, some studies have suggested that the prevalence of functional limitations and/or disability have remained stable thereafter or even increased in later born older cohorts [Citation11–13], especially in the younger-aged cohorts [Citation10,Citation14,Citation15]. Time trends in the oldest-old populations 85 years and older show mixed findings [Citation7,Citation9,Citation12,Citation14,Citation16] among later cohorts compared with the earlier cohorts.
Self-rated health (SRH) measures the individual’s own perceptions of her/his health status. It is significantly associated with objectively measured health, and it has prognostic value [Citation3,Citation9]. The few studies that reported time trends in SRH have shown mixed results especially from 1980 to 2003 [Citation3,Citation9]. The few studies that reported trends up to 2009 have suggested either stable or worsening SRH [Citation17]. The prevalence of diseases seems to be increasing in the later born cohorts [Citation8–11,Citation17,Citation18].
Time trends in some aspects of PWB have been studied in general adult populations. The later born 65–69-year old cohorts of the Finnish Evergreen project in 2004 found life more meaningful than their counterparts in 1996 or 1988 [Citation19]. However, there is a scarcity of studies that explore time trends in PWB of older people and the oldest old, and we are not aware of any recent published studies.
The studies that have investigated health trends between cohorts of the same age range seldom report PWB, health and disability in the same paper. We reported in our previous study in 2001 that the aged samples taken in 1999 showed improved physical functioning and PWB, compared with the samples of same age that were studied 10 years earlier [Citation20]. We have extended our research in the present study to compare previous study year (1989, 1999) samples of the same age groups to samples of the corresponding ages that were obtained in 2009. The aim of this present study was to investigate the changes in self-reported disability, SRH, comorbidities and PWB in community-dwelling cohorts of people aged 75–95 years over two decades.
Materials and methods
This study is based on Helsinki Ageing Study [Citation20] and combines data of three population-based, cross-sectional studies with census data, which were obtained in 1989, 1999 and 2009. Random samples of community-dwelling people in Helsinki, Finland, were retrieved from the population register in 1989 (N = 898; 300 each of 75- and 80-year-olds groups and 298 of the 85-year-olds group), in 1999 [N = 3921; 1000 each of 75, 80 and 85-year-olds groups in addition to all 90 (734) and also all 95-year-olds (187)], and in 2009 [N = 2633; 600 each of the four groups from 75 to 90, and also all 95-year-olds (233)]. A questionnaire with identical items was mailed to eligible people in Helsinki, Finland, and re-sent once to those not responding at each time point. We excluded persons with unknown address, the deceased and those who were permanently institutionalized. The response rates for 1989, 1999 and 2009 were 93% (n = 660), 80% (n = 2598) and 73% (n = 1637), respectively.
The survey questionnaire inter alia inquired about demographic items (education, marital status). Our cross-sectional surveys given in all three time-points 1989, 1999 and 2009 included identical items on self-reported disability (i.e. difficulties in performing some daily activities). The subjects were invited to respond to the following: whether they go outdoors daily (yes/no), they need another person’s help daily (yes/no) and they need another person’s help to get out of bed (yes/no).
Respondents were invited to evaluate their SRH, which was categorized as good (healthy/quite healthy) and poor (quite unhealthy/unhealthy). Participants were invited to report the occurrence of their diagnosed major diseases (yes/no), and the Charlson comorbidity index was calculated accordingly [Citation21].
The questionnaire evaluated PWB according to responses to six questions [Citation22,Citation23]. These six questions have shown good test–retest reliability [Citation24] and significant prognostic validity for mortality [Citation23]. The questions inquire about (1) life satisfaction (yes/no), (2) feeling useful (yes/no), (3) having plans for the future (yes/no), (4) having zest for life (yes/no), (5) feeling depressed (seldom or never/sometimes/often or always) and (6) suffering from loneliness (seldom or never/sometimes/often or always) [Citation23]. Responses ‘no’ to questions 1–4 and ‘often or always’ to questions 5 or 6 contribute 0 raw points to the aggregated score. Responses ‘sometimes’ to questions 5 or 6 contribute to the total with ½ raw points. The responses ‘yes’ to questions 1–4 and ‘seldom or never’ to questions 5 or 6 contribute 1 raw point each to the total score. We created a total PWB score from the responses to these six questions. The PWB score for each study participant was then calculated by dividing the sum total of raw points by the number of questions the participant had answered. A score of 1 represented the best possible PWB score and 0 the poorest PWB score [Citation25].
The mortality data were retrieved from the central registers during a four-year follow-up for each cross-sectional cohort. The standardized mortality ratios (SMRs) were calculated so that we could compare the mortality of each study sample with the whole Finnish population of respective age at each time point. This enables us to assess the representativeness of each sample. The expected number of deaths was calculated on the basis of sex-, age- and calendar-period-specific mortality rates of the Finnish population. The SMRs were calculated as the ratio of observed and expected number of deaths according to Statistics Finland. The corresponding 95% confidence intervals (CIs) were defined assuming a Poisson distribution of the observed number of deaths.
In the figures, we describe raw data for each age cohort. In our analyses, we compared 75–85-year-olds and 90–95-year-olds separately, because these age groups have shown somewhat different trends in disability in previous studies [Citation7,Citation9,Citation12,Citation14]. Generalized linear mixed-models were used to determine the adjusted relationships between the samples of each age groups over the study years. These basic models included the main effects (year and age) and their interaction. All these analyses performed were adjusted for gender, education and widowhood. A significant cohort trend between the study years is indicated by p < .05 for linearity for the study year effect, or for the study year effect. The age effect p < .05 remarks the obvious situation where disability/SRH/comorbidities or PWB changes with higher age in the group. These results have more power, if p for the interactions is higher than .05 indicating no other interactions. The normality of each variable was tested by using the Shapiro–Wilk W test. All analyses were performed using STATA software (version 13.1), StataCorp, LP, College Station, TX.
Results
In these cross-sectional cohorts of older community-dwelling people (1989, 1999 and 2009), the proportion of males among the 80- and 85-year-old participants increased significantly from 1989 to 2009. Widowhood among 75-, 80- and 85-year-olds decreased significantly from 1989 to 2009. Furthermore, the educational status improved significantly in all aged cohorts except among the 95-year-olds ().
Table 1. Characteristics of participants in study years 1989, 1999 and 2009.
The SMR was 0.90 (95% CI 0.78–1.03) for the 1989 sample, whereas the corresponding ratios for the 1999 and 2009 samples were 0.71 (95% CI 0.64–0.76) and 0.60 (95% CI 0.54–0.66). This indicates that the respondents represented fitter sample of population of the same age each decade.
Results concerning the research question show changes in self-reported disabilities, health, comorbidities and PWB between the independent cross-sectional cohorts over decades. illustrates changes in individual items of self-reported disability at different ages in 1989, 1999 and 2009.
Figure 1. Self-reported physical functioning among community-dwelling older people in Helsinki, Finland according to their age for the study years 1989, 1999 and 2009. Proportions reporting difficulties or need of help with 95% confidence intervals.
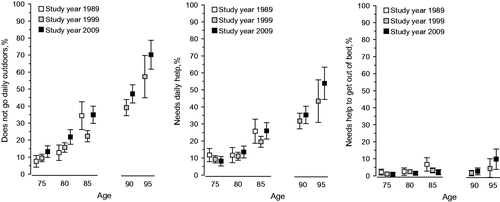
A significantly lower proportion of 75-, 80- and 85-year-olds reported going outdoors daily in the later study years (p < .001 for linearity for the study year effect, p < .001 for the age effect, p = .043 for the interactions; adjusted for gender, education and widowhood). Also a significantly lower proportion of 90- and 95-year-olds reported going outdoors daily (p = .030 for the study year effect, p < .001 for the age effect, p = .57 for the interactions; adjusted for gender, education and widowhood). Furthermore, there was only an age effect between the 75-, 80- and 85-year-olds concerning the need of another person’s daily help (p = .84 for linearity for the study year effect, p < .001 for the age effect, p = .30 for the interactions; adjusted for gender, education and widowhood), and similarly among 90- and 95-year-olds (p = .14 for the study year effect, p < .001 for the age effect, p = .56 for interactions; adjusted for gender, education and widowhood). There was a difference between 75- and 85-year-olds in needing help to get out of bed between the study years (p = .022 for linearity for the study year effect, p = .0012 for the age effect, p = .82 for the interactions; adjusted for gender, education and widowhood), but among 90- and 95-year-olds there was only an age effect (p = .18 for the study year effect, p = .019 for the age effect, p = .56 for the interactions; adjusted for gender, education and widowhood).
SRH was good in most participants at all ages at each time point. A significantly higher proportion of 75-, 80- and 85-year-olds reported good SRH in the later study years (p = .028 for linearity for the study year effect, p < .001 for the age effect, p = .32 for the interactions; adjusted for gender, education and widowhood). There were no significant differences in SRH for the 90- and 95-year-olds between the study years (p = .057 for linearity for the study year effect, p = .59 for the age effect, p = .63 for the interactions; adjusted for gender, education and widowhood). There was a significant increase in the Charlson comorbidity index among 75–85-year-olds in the later study years compared to 1989 (p < .001 for linearity for study year effect, p < .001 for the age effect, p = .13 for the interactions; adjusted for gender, education and widowhood). No significant differences were observed among 90- and 95-year-olds over the study years (p = .55 for the study year effect, p = .25 for the age effect, p = .15 for the interactions; adjusted for gender, education and widowhood). illustrates the trends in SRH and comorbidities in individual age groups in 1989, 1999 and 2009.
Figure 2. Self-rated health, the Charlson comorbidity index [Citation21] and psychological wellbeing [Citation25] among community-dwelling older people in Helsinki, Finland according to their age in study years 1989, 1999 and 2009. Proportions reporting good self-rated health with 95% confidence intervals, and the mean Charlson comorbidity index and mean psychological well-being with 95% confidence intervals.
![Figure 2. Self-rated health, the Charlson comorbidity index [Citation21] and psychological wellbeing [Citation25] among community-dwelling older people in Helsinki, Finland according to their age in study years 1989, 1999 and 2009. Proportions reporting good self-rated health with 95% confidence intervals, and the mean Charlson comorbidity index and mean psychological well-being with 95% confidence intervals.](/cms/asset/349ee860-ae1d-4536-a39f-067fa68b254d/ipri_a_1358855_f0002_b.jpg)
illustrates also the trends in PWB at different ages for 1989, 1999 and 2009. In addition, in 75-, 80- and 85-year-olds the PWB score improved significantly from 1989 to 2009 (p = .0055 for linearity of the study year effect, p < .001 for the age effect, p = .39 for the interactions; adjusted for gender, education and widowhood). Among 90- and 95-year-olds, there was no significant difference in PWB between the study years (p = .49 for the study year effect, p = .040 for the age effect, p = .50 for the interactions; adjusted for gender, education and widowhood).
Discussion
This study addresses disabilities, health, diseases and PWB, thus the domains indicating need for primary care services for community-dwelling older people. Old community-dwelling people in Finland generally feel well. However, improvements in self-reported disability in our community-dwelling cohorts could not be seen from 1989 through 1999 to 2009. A lower proportion of 75–95-year-olds go outdoors daily. Comorbidities increased from 1989 to 1999 but a further increase was not observed in 2009. The SRH and PWB data suggested improvements in 75–85-year-olds over the study years.
The strength of our study lies in it being a representative sample of community-dwelling older people in Finland. Response rates were very good, although these decreased for each study time point over the two decades, which is a common phenomenon [Citation5]. Another strength of our study is that we used identical questions at each time point.
A limitation of this study is the small number of participants particularly in the first study sample (1989). This limited the statistical power of the study to detect small differences between the three study years. Additionally, the 90- and 95-year-olds were missing in 1989, leading to exploring cohort trends among 90- and 95-year-olds in only one decade, 1999–2009. Furthermore, we had a fairly small number of items related to disability. The response rate was significantly lower in the later study years. The proportion of 75+ population institutionalized in Helsinki was 16.0%, 13.7% and 6.0% in 1989, 1999 and 2009, respectively. Most people who would have resided in nursing homes in 1989 or 1999 would now live in home-like assisted living facilities. These facilities are not, however, considered to be institutional care in today’s terminology. This change in terminology may explain why the response rate for community-dwelling older people apparently decreased in our study.
The findings of unfavorable trends in disability in our study are in line with some previous studies [Citation9,Citation10,Citation14,Citation15]. The leveling-off in self-reported functioning in 2009 amongst our community-dwelling participants cannot be explained by the lower proportion being institutionalized as suggested earlier [Citation5,Citation20], because the SMRs of our participants decreased every decade. The SMRs of our cross-sectional samples mean that survival during a four-year follow-up among our respondents in 1989 was approximately 10% higher than survival among Finnish population of respective ages (background population) in 1989. Survival of our cohorts in 1999 was 29%, and in 2009 40% higher than survival of all Finnish older people of the same ages, respectively. This indicates that the participants in our later study years survived longer than their respective background population and, thus, they represent the fitter proportion of their background population compared to the respondents of earlier study years. Seasonal weather conditions in Finland neither explain the disability trends. The questionnaires were mailed during late autumn in 1989, in slippery mid-winter in 1999, but the 2009 questionnaires were mailed in summer. Interestingly, the largest proportion of respondents not going outdoors on a daily basis was found in the summer 2009 sample. Therefore, the proportion of those presenting disability in the latest study year could plausibly be an underestimation.
Possible mechanisms for any leveling-off in functioning could be the increasing prevalence of diabetes and obesity and sedentary lifestyle, which effectively predispose subjects to frailty and mobility limitations [Citation13,Citation26–28]. These increasing trends have been reported all over the world. Our results suggest that health care services, especially primary care should be prepared for the future with increasing number of older people with more disabilities. GPs are the key persons to plan preventive services and procedures for these patients. Our results suggest that about 5% more of those aged 85 and 90, and 10% more of those aged 95 need daily help in the 2009 cohort than in the respective cohort of 1999. This means a significantly increasing burden for primary health care.
The Charlson comorbidity index measurements suggested an increase in comorbidities from 1989 to 1999, but it leveled-off thereafter. The increasing number of diseases has been reported earlier from 1980 to 1990 [Citation8,Citation9,Citation11,Citation13,Citation17,Citation18]. This may partly be explained by an increase in diagnostic activity among the oldest-old especially in primary health care after 1989. For example, failing-memory complaints or osteoporosis were diagnosed with a relatively low frequency, until dementia and osteoporosis drugs became available. However, diseases such as cancer, arthritis and diabetes show increasing trends in older later born cohorts [Citation8,Citation10,Citation13].
SRH demonstrated improvements from 1989 to 2009. There are few published studies that investigated trends in SRH. Some studies that investigated time periods from 1978 to 2003 show similar findings to ours [Citation3,Citation29] although there are also contradictory findings [Citation9]. The SRH in our samples may reflect improved social wellbeing and also improved PWB.
In contrast to the worrisome trend in disability, the PWB reflected improving wellbeing from 1989 until 2009. Higher education and lower proportions of widowed responders probably contribute to this positive finding. Several previous cohort studies have reported higher educational levels [Citation28,Citation30]. However, this is the first study to explore time trends in PWB also among the oldest-olds, as far as we are aware. Health care professionals need to understand the difference between older people and younger adults in history taking: a multimorbid older person with several relevant issues to discuss may rate SRH or PWB higher than a younger person would possibly do.
In conclusion, our study used sufficiently large samples to investigate some domains of disability, health and PWB among community-dwelling older people in Helsinki. The findings suggest a leveling-off after decades of improvements in disability, and increase in comorbidities, despite favorable trends in mortality, SRH and PWB. This may truly indicate increasing needs for appropriate, accessible and preventive primary care services in future years.
Notes on contributors
Helena Karppinen, MD, is a Clinical Teacher of General Practice and Primary Health Care at the University of Helsinki, Finland. She is responsible for the design, interpretation of the result and writing the manuscript.
Kaisu H. Pitkälä, PhD, is a Professor of General Practice and Primary Health Care at the University of Helsinki. She is a geriatrician responsible for conception of the design, gathering data and conducting the study.
Hannu Kautiainen, PhD, is a Biostatistician at the University of Helsinki, Helsinki University Hospital, and Medcare Foundation. He is responsible for statistical analyses.
Reijo S. Tilvis, PhD, is an Emeritus Professor of Geriatrics at the University of Helsinki. He started the Helsinki Ageing Study and is responsible for conception of the design, gathering data and conducting the study.
Jaakko Valvanne, PhD, is a Professor of Geriatrics at the University of Tampere. He is responsible for 1989 cohort data.
Käthe Yoder, MD in Helsinki. She participated in the design of the study.
Timo E. Strandberg, PhD, is a Professor of Geriatrics at the University of Helsinki, and responsible for conception of the design, gathering data and conducting the study.
Disclosure statement
No potential conflict of interest was reported by the author(s).
Additional information
Funding
References
- Fries JF. Aging, natural death, and the compression of morbidity. N Engl J Med. 1980;303:130–135.
- Rechel B, Grundy E, Robine JM, et al. Ageing in the European Union. Lancet. 2013;381:1312–1322.
- Martin LG, Schoeni RF, Freedman VA, et al. Feeling better? Trends in general health status. J Gerontol B Psychol Sci Soc Sci. 2007;62:S11–S21.
- Freedman VA, Martin LG, Schoeni RF. Recent trends in disability and functioning among older adults in the United States: a systematic review. JAMA. 2002;288:3137–3146.
- Moe JO, Hagen TP. Trends and variation in mild disability and functional limitations among older adults in Norway, 1986–2008. Eur J Ageing. 2011;8:49–61.
- Manton KG. Recent declines in chronic disability in the elderly U.S. population: risk factors and future dynamics. Annu Rev Public Health. 2008;29:91–113.
- Christensen K, Thinggaard M, Oksuzyan A, et al. Physical and cognitive functioning of people older than 90 years: a comparison of two Danish cohorts born 10 years apart. Lancet. 2013;382:1507–1513.
- Crimmins EM. Trends in the health of the elderly. Annu Rev Public Health. 2004;25:79–98.
- Parker MG, Thorslund M. Health trends in the elderly population: getting better and getting worse. Gerontologist. 2007;47:150–158.
- Christensen K, Doblhammer G, Rau R, et al. Ageing populations: the challenges ahead. Lancet. 2009;374:1196–1208.
- Crimmins EM, Beltrán SH. Mortality and morbidity trends: is there compression of morbidity? J Gerontol Ser B: Psychol Sci Soc Sci. 2011;66B:75–86.
- Sarkeala T, Nummi T, Vuorisalmi M, et al. Disability trends among nonagenarians in 2001–2007: vitality 90+ study. Eur J Ageing. 2011;8:87–94.
- Chen Y, Sloan FA. Explaining disability trends in the U.S. elderly and near-elderly population. Health Serv Res. 2015;50:1528–1549.
- Seeman TE, Merkin SS, Crimmins EM, et al. Disability trends among older Americans: National Health and Nutrition Examination Surveys, 1988–1994 and 1999–2004. Am J Public Health. 2010;100:100–107.
- Cambois E, Blachier A, Robine J. Aging and health in France: an unexpected expansion of disability in mid-adulthood over recent years. Eur J Public Health. 2013;23:575–581.
- Chatterji S, Byles J, Cutler D, et al. Health, functioning, and disability in older adults-present status and future implications. Lancet. 2015;385:563–575.
- Galenkamp H, Braam AW, Huisman M, et al. Seventeen-year time trend in poor self-rated health in older adults: changing contributions of chronic diseases and disability. Eur J Public Health. 2013;23:511–517.
- Hoeymans N, Wong A, van Gool CH, et al. The disabling effect of diseases: a study on trends in diseases, activity limitations, and their interrelationships. Am J Public Health. 2012;102:163–170.
- Suutama T. Meaning in life among 65–69-year-old residents of Jyväskylä in 1988, 1996 and 2004. In: Heikkinen E, Kauppinen M, Salo P, et al., editors. Are the health and functional capacity of people aged 65–69 improving and their leisure activity increasing? Observations from cohort comparisons conducted as part of the Evergreen project in 1988, 1996 and 2004. Finland: The Social Insurance Institution; 2006. p. 187–205.
- Pitkala KH, Valvanne J, Kulp S, et al. Secular trends in self-reported functioning, need for assistance and attitudes towards life: 10-year differences of three older cohorts. J Am Geriatr Soc. 2001;49:596–600.
- Charlson ME, Pompei P, Ales KL, et al. A new method of classifying prognostic comorbidity in longitudinal studies: development and validation. J Chronic Dis. 1987;40:373–383.
- Tilvis RS, Pitkala KH, Jolkkonen J, et al. Social networks and dementia. Lancet. 2000;356:77–78.
- Pitkala KH, Laakkonen ML, Strandberg TE, et al. Positive life orientation as a predictor of 10-year outcome in an aged population. J Clin Epidemiol. 2004;57:409–414.
- Savikko N, Routasalo P, Tilvis RS, et al. Loss of parents in childhood – associations with depression, loneliness, and attitudes towards life in older Finnish people. Int J Older People Nurs. 2006;1:17–24.
- Routasalo PE, Tilvis RS, Kautiainen H, et al. Effects of psychosocial group rehabilitation on social functioning, loneliness and well-being of lonely, older people: randomized controlled trial. J Adv Nurs. 2009;65:297–305.
- Robinson SM, Jameson KA, Syddall HE, et al. Clustering of lifestyle risk factors and poor physical function in older adults: the Hertfordshire Cohort Study. J Am Geriatr Soc. 2013;61:1684–1691.
- Strandberg TE, Stenholm S, Strandberg AY, et al. The “obesity paradox,” frailty, disability, and mortality in older men: a prospective, longitudinal cohort study. Am J Epidemiol. 2013;178:1452–1460.
- Martin LG, Schoeni RF. Trends in disability and related chronic conditions among the forty-and-over population: 1997–2010. Disabil Health J. 2014;7:S4–S14.
- Doblhammer G, Kytir J. Compression or expansion of morbidity? Trends in healthy-life expectancy in the elderly Austrian population between 1978 and 1998. Soc Sci Med. 2001;52:385–391.
- Laditka SB, Laditka JN. More education may limit disability and extend life for people with cognitive impairment. Am J Alzheimers Dis Other Demen. 2014;29:436–447.