
Abstract
Objective
To describe self-reported symptoms among patients in general practice and to explore the relationships between symptoms experienced by patients and diagnoses given by general practitioners.
Design
Doctor–patient questionnaires focusing on patients’ self-reported symptoms during the past 7 days and the doctors’ diagnoses.
Setting
General practices in urban and suburban areas in Southeast Norway.
Subjects
Forty-seven general practitioners who included 866 patients aged ≥18 years on a random day in practice.
Results
The most frequently reported symptoms were tiredness (46%), lower back pain (43%), neck pain (41%), headache (39%), shoulder pain (36%), and sleep problems (35%). Women had a significantly higher prevalence than men for 16 of 38 symptoms (p < 0.05). The mean number of symptoms was 7.5 (range, 0–32; women, 8.1; men, 6.5, p < 0.05). Regression analysis showed that patients who received a social security grant had 59% more symptoms than those who were employed and that people with asthenia and depression/anxiety had 44% and 23% more symptoms, respectively than those with all other diagnoses. The patterns of symptoms reported showed similar patterns across the five most prevalent diagnoses.
Conclusions
Patients in general practice report a number of symptoms and share a common pattern of symptoms, which appear to be partly independent of the diagnoses given. These findings suggest that symptoms are not necessarily an indication of disease.
Patients consulting general practitioners have a high number of self-reported symptoms.
The most frequent symptoms are tiredness, lower back pain, neck pain, headache, shoulder pain, and sleep problems.
Patients diagnosed with asthenia and depression/anxiety report the highest number of symptoms.
Selected diagnoses show similar patterns in symptom distribution.
Symptoms are not necessarily an indication of disease.
KEY POINTS
Introduction
The presentation of symptoms is the patient’s first step in the communication with the general practitioner (GP) in the consultation. However, the health-care-seeking behaviour of patients does not necessarily reflect the severity of their symptoms. There is a known discrepancy between the full range of symptoms experienced by patients and the symptoms they choose to present to their doctor [Citation1].
How a symptom is interpreted by a person depends on individual factors and preconceptions. The intensity and duration of the symptoms, and the person’s evaluation of the seriousness of the symptoms are central factors in the decision to consult a medical practitioner [Citation2]. The factors that ultimately trigger consultation with a GP vary greatly between patients.
GPs can only evaluate concerns or symptoms presented by the patient. Only 5–25% of people contact a GP because of a symptom [Citation1]. This implies that only a selection of the symptoms is deemed alarming or bothersome enough to motivate the patient to consult a doctor [Citation3]. Even among people with symptoms that could indicate a serious disease, such as blood in the urine, shortness of breath, or coughing blood, only half contact their GP about that symptom [Citation4]. On the other hand, GPs tend to overestimate to what extent their patients consult them for minor medical problems [Citation5].
There is a known discrepancy between the full range of symptoms experienced by patients and the symptoms they choose to present to the doctor [Citation1]. Among patients who disclose, before the consultation, that they have symptoms they intend to discuss with their GP, 23% of the symptoms [Citation6] and up to 25% of patient concerns are not mentioned during the consultation [Citation7]. By contrast, people who consider themselves healthy may report a higher number of symptoms [Citation8]. In most patients who undertake a routine check-up in general practice and who initially declare that they did not have any symptoms, symptoms were found to constitute a major part of their agenda [Citation9].
The commonly used definitions of symptoms relate symptoms to health problems or disease [Citation10]. The WONCA Dictionary of General/Family Practice describes symptoms as, ‘any subjective evidence of a health problem as perceived by the patient’ [Citation11]. Labelling a health problem can result in a disease diagnosis, such as diabetes, or may result in a symptom diagnosis, such as lower back pain or fatigue, both of which group patients under a label describing the main symptom according to the International Classification of Primary Care (ICPC) [Citation12].
Understanding of the process from first experiencing a symptom to receiving a diagnosis is limited. Disentangling the various roles of symptoms in making a diagnosis represents a challenge, and symptoms selected by the patient for presentation to the GP may or may not provide clues relevant to making the diagnosis. Whether a presented symptom will contribute to the final diagnosis depends on whether the GP finds the symptom relevant during the consultation. Although the diagnoses given by GPs have been found to correspond well with their notes about the patient recorded during consultations [Citation13], the diagnoses reflect only the symptoms that are communicated. Other symptoms that are not communicated, commonly referred to as the ‘submerged’ part of a symptom ‘iceberg’, may not be considered [Citation14,Citation15].
More than 20 years ago, Kroenke noted that more diagnostic information may be collected from a patient’s symptom account than from the physical examination [Citation16]. Since then, an increasing number of studies of symptoms have been conducted, but these have focused mainly on symptom prevalence. More recently, it has been acknowledged that both the type and number of symptoms can provide important information about the patient [Citation17]. Counting symptoms, an approach that has been used to study the relationship between functional ability and health in the population, has shown that reporting a high number of symptoms is associated with an increased risk of reporting poor health [Citation18] and may predict future disability benefits [Citation19], irrespective of the type and severity of the symptoms [Citation18,Citation19]. It has also been shown that the number of symptoms may provide more information about future health outcomes than the diagnosis given [Citation20]. These findings suggest that counting symptoms may be a valuable tool in general practice.
We conducted a survey among GPs and their patients in which we focused on symptoms, diagnoses, and function. Our aims were to map the occurrence of a range of common symptoms in patients, regardless of the reasons for the consultation, and to explore the associations between the patient-reported symptoms and the GP-recorded main diagnosis.
Method
We recruited GPs from meetings with counselling groups for doctors seeking to become specialists in general practice in urban and suburban areas in Southeast Norway. The inclusion period was from June 2010 to January 2012. After a brief introduction to our study, 47 GPs agreed to participate. The GPs were asked to include all consecutive patients regardless of their reason for the encounter, adding up to ≥20 patients aged ≥18 years seen on a random day of practice during the following 2 weeks. If the GP saw <20 patients on a practice day, the inclusion should continue the next practice day. At the end of each consultation, the GPs asked their patients to complete a questionnaire. The patients orally consented to participate after reading the letter accompanying the survey.
The questionnaires for both the GPs and the patients were completed separately directly after the consultation. The answers were linked by serial numbers. A pilot study was first conducted to validate and adjust the questionnaires.
Dependent variables
The patients were asked whether during the previous week they had experienced any of 38 common symptoms included in a symptom check-list without regard to whether the symptoms were discussed with the GP. The list of symptoms comprised 10 pain symptoms from the Standardised Nordic Questionnaire [Citation21] and 28 symptoms from the Subjective Health Complaints Inventory [Citation22] (). The dependent variables were the sum score of symptoms and the individual symptoms.
Table 1. Distribution of the 38 symptoms reported in general practice for the past 7 days for the total sample and for women and men separately.
Independent variables
From the GP questionnaire, we used only information about the diagnosis and possible chronic conditions. The GPs were asked to register the main diagnosis (only one) by using codes from the second edition of the ICPC (ICPC-2) or by written text, the latter of which two authors (MK and HTM) had labelled with ICPC-2 codes before the analyses. The total number of reported ICPC-2 codes was 321. If more than one main diagnosis was given, which was the case in five of the questionnaires, the first diagnosis written was used. We selected the most frequent single diagnoses for further analyses: asthenia (ICPC A04), diabetes (T89, T90), depression/anxiety (P01, P03, P74, P76), hypertension (K85, K86) and lower back pain (L02, L03, L84, L85).
The GPs were also asked to report whether or not the patient had, in addition to the current diagnosis, one or more prevalent chronic conditions from the following nine diagnostic categories: cardiovascular, respiratory, cancer, musculoskeletal, endocrinological, gastroenterological, psychological, neurological, and other. A sum score of 0, 1, 2, and 3+ prevalent chronic conditions was created. The GP questionnaire contained no questions about the symptoms reported by the patient.
In addition to the symptom checklist, the patient questionnaire included questions about the patients’ sex, age, civil status, educational level, and employment status. Age was pooled into the age categories 18–29, 30–39, 40–49, 50–59, 60–69, and 70+ years. Civil status was grouped into married, separated, widowed, and single. Educational level was registered as ≤10 years, 11–13 years, university (1–4 years), and university (>4 years). Employment status was categorized as employed, social security grant for ≤1 year, social security grant for >1 year, and retired.
Statistical methods
Frequencies and percentages were used to describe the prevalence of symptoms. The numbers of symptoms were summarized using means, and differences in means between two categories of a nominal variable were identified using the independent t-test. One-way analysis of variance (ANOVA) with a Tukey post hoc test was used to compare the mean number of symptoms of a nominal variable with ≥3 categories.
We selected the five most prevalent diagnoses and clustered the rest into ‘other’, which we used as the reference category.
We also modelled the number of symptoms using a Poisson regression model and obtained estimates (incidence rate ratios; IRRs) of the association between each of several possible socio-demographic, diagnosis and condition-count predictors, adjusted for all other predictors in the model. Poisson regression is a convenient model for estimating the association between the number of symptoms reported and various factors like age or diagnosis; the association is expressed as incidence rate ratios (IRR), which represents the change in the number of symptoms in one group relative to the change in the reference group. We fitted three separate Poisson regression models to our data and selected the best model by using the Bayesian information criterion (BIC), which states that the model with the smallest BIC should be selected.
While it is a common practice to model associations with a dichotomous outcome via a binary logistic regression model, the argument for interpreting the odds ratios (ORs) as relative risks (RRs) holds true only in cases where the outcome is rare (prevalence is ≤10%). Since the prevalence of common symptoms in studies is usually high (>10%) and with 38 symptoms to investigate, the RR, which we used as a descriptive statistic rather than an inferential statistic was preferred above OR to describe associations with our dichotomous outcome. The RR was estimated by dividing the probability of having a symptom given a diagnosis by the probability of having the same symptom if the diagnosis is not given (referent). Because the RR is a ratio of two probabilities, it follows that (1) assumptions regarding probability estimation in each group holds and (2) that the probability of having a symptom given a diagnosis in the reference group is >0. RR estimates and their 95% confidence intervals (CIs) are presented in a forest plot. Only the symptoms with significant CIs for RR are presented.
IBM SPSS Statistics 26 and Stata/SE 16 were used to analyse the data. The significance level was set at α = 0.05.
Results
In total, 1024 questionnaire pairs were distributed; 909 patient questionnaires were returned, and 866 had a corresponding answer from the doctor, giving an overall response rate of 84.6%. The mean age was 48.3 years (women, 47.2; men, 50.2 years), and 64.5% of responders were women.
The most frequent symptoms reported during the past week were tiredness (43.6%), lower back pain (42.5%), neck pain (41.3%), headache (38.7%), shoulder pain (35.6%), and sleep problems (35.0%). Women had a significantly higher prevalence than men of 16 of 38 symptoms (p < 0.05). Only chest pain and tinnitus (p < 0.05) were more commonly reported by men ().
The number of symptoms reported by each patient ranged from 0 to 32 (out of 38 possible). At least one symptom was reported by 97%, >10 symptoms were reported by 29.2%, and >15 symptoms were reported by about 1%. The overall mean number of symptoms was 7.5 (men, 6.5; women, 8.1) (p < 0.01). The highest mean number of symptoms (11.4) was found in patients receiving a social security grant >1 year. Patients aged 40–49 and 50–59 years reported more symptoms than those younger or older, and those with a chronic condition reported more symptoms than those without a chronic condition. Among the selected diagnoses, patients with hypertension reported fewer symptoms (5.6), whereas those with asthenia (11.1) and depression/anxiety (10.7) reported significantly more symptoms than did patients with all other diagnoses ().
Table 2. Mean distribution of the number of symptoms reported in the past 7 days by patients consulting their GP.
In the adjusted Poisson regression model, women reported 21% more symptoms than men (). The age groups 40–49 years and 50–59 years had 17% and 19% more symptoms than the youngest age group. Patients who had received a social security grant for >1 year had 59% more symptoms than those who were employed. Having three or more prevalent chronic conditions was associated with 36% more symptoms compared with those having no chronic condition. Patients with asthenia and depression/anxiety diagnoses reported 44% and 23% more symptoms, respectively, compared with patients with ‘all other’ diagnoses, whereas patients with hypertension reported 26% fewer symptoms. Patients with lower back pain and diabetes did not differ significantly from those with ‘all other’ diagnoses when comparing the number of symptoms.
Table 3. Estimates of incidence rate ratios (IRRs) and their 95% confidence intervals (CIs) obtained from the Poisson regression model showing socio-demographic factors and diagnoses given by GPs that were significantly associated with the number of symptoms reported in the past 7 days.
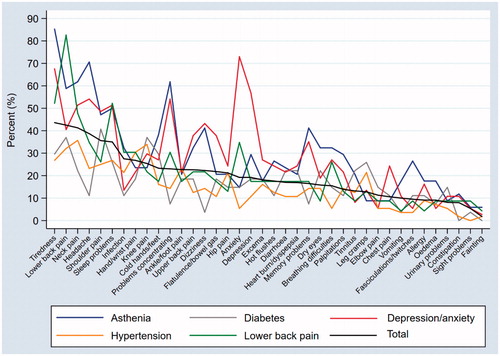
shows the prevalence of the individual symptoms for the five selected diagnoses compared with the total prevalence of symptoms in the study population. The symptoms are presented in descending order of total prevalence. The prevalence rates of the diagnoses of lower back pain, depression/anxiety, and asthenia showed symptom patterns with the same prevalence of symptoms as the total. Hypertension and diabetes followed the total prevalence of the symptoms closely, except for four and two of the 38 symptoms, respectively.
Figure 1. Prevalence of individual symptoms according to the selected diagnoses compared with the total prevalence of symptoms in the study population.
The RR of having each of the symptoms given one of the diagnoses compared with the RR of having the symptoms in those not having the diagnosis is shown in a forest plot (). In this table, only symptoms with an RR significantly different from 1 are presented.
Table 4. Relative risk (RR) estimates showing the likelihood of patients reporting the individual symptoms in the past 7 days according to the most prevalent diagnoses given by their GP.
Of the 38 symptoms, increased RRs were found for 13 symptoms in patients diagnosed with asthenia, 12 symptoms in those with depression/anxiety, three symptoms in those with lower back pain, one symptom in those with diabetes, and one symptom in those with hypertension. For the rest of the symptoms, no increased RR was found in patients with a diagnosis compared with those without the diagnosis.
We found only small variations in symptom patterns according to age and sex (data not shown).
Discussion
Summary of the main findings
Patients in general practice reported a mean of 7.5 symptoms during the week before the consultation. Tiredness, lower back pain, neck pain, headache, shoulder pain, and sleep problems were the most prevalent symptoms. Patients receiving a social security grant and being diagnosed with asthenia or depression/anxiety reported the most symptoms. The prevalence of the symptoms showed similar patterns across the most prevalent diagnoses.
Strengths and weaknesses of the study
The survey was conducted among consecutive patients seen in general practice. The group of patients is representative of Norwegian adults in terms of age and sex distribution [Citation23], except for slightly more respondents aged 30–49 and slightly fewer older than 70 years. The response rate was high, and the number of participating doctors was acceptable.
The participating GPs were recruited from counselling groups that were part of a postgraduate education required to become a specialist GP. Therefore, the doctors had limited experience. As is the case for most similar studies, the willingness to participate could have led to a selection of GPs with a particular interest in research on symptoms. Awareness of the study may have influenced the GPs in their diagnostic attribution. As we did not focus on outcome measures in meetings with the groups, this potential bias should be minor. The GPs were asked to include consecutive patients on a day in practice, but we do not know whether or how often the GPs forgot to hand out a questionnaire.
The GPs were asked to record only the main diagnosis in the consultation but, for five patients, more than one diagnosis was registered. In retrospect, we should have provided an opportunity to register more than one diagnosis.
Although there has been an increased focus on research on symptoms in recent years, the studies conducted vary in both type and number of symptoms included, and in the inclusion period, which makes comparisons difficult [Citation20,Citation24]. There is no common questionnaire that could facilitate comparisons. In this study, we created the patient questionnaire by merging two commonly used questionnaires.
We did not consider the intensity of symptoms, but previous research has shown that even symptoms considered to be less bothersome are important to self-reported health and functional ability [Citation18].
Our main objective was to map the occurrence of symptoms among patients and to compare these with a number of factors, including the diagnoses given by the doctor. We did not record which symptoms were presented to the GP during the consultation.
An important limitation of our study was the low prevalence of each diagnosis. We, therefore, selected the five most frequent diagnoses for further analysis.
Findings in relation to other studies
Studies both among patients in general practice and the general population have shown that tiredness, musculoskeletal symptoms, and headache are among the most reported symptoms [Citation1,Citation14,Citation25,Citation26], as we found in our study.
The mean number of symptoms reported was 7.5; in our previous population study, we found the mean number of symptoms was 6.0 [Citation27]. This difference may reflect that the population study including fewer symptoms (22 versus 38). However, one would expect a higher number of symptoms to be reported by people who visit a GP than in population surveys.
Our finding that women reported more symptoms than men is consistent with the results from other studies [Citation1,Citation14,Citation25,Citation26], although the sex difference was significant only for 16 of the 38 symptoms in our study. This sex difference was similar to that found in our population study, with 25% more symptoms in women in our study and 31% more in our previous study [Citation27].
In our study, the middle-aged participants reported more symptoms than the younger and older age groups. This result differs from those of some previous studies [Citation26], but is consistent with the results in large population-based studies [Citation2,Citation14].
Patients receiving a social security grant reported the highest number of symptoms. Presenting many symptoms is known to be strongly associated with low functional status and high rates of absence from work [Citation18,Citation19,Citation28]. Hence, experiencing many symptoms may be considered a sign of impaired health.
As expected, the mean number of symptoms increased with an increasing number of chronic conditions [Citation14]. The differences in the number of symptoms among the most prevalent diagnoses are clinically explainable. Patients with the diagnoses asthenia and depression/anxiety report a high number of symptoms. Asthenia (A04) is a symptom diagnosis according to ICPC-2 and may be used for tiredness/asthenia symptoms alone. However, asthenia is also associated with medically unexplained symptoms [Citation25], which in turn are strongly associated with the reporting of multiple symptoms [Citation29]. Mental health problems are also associated with a high number of symptoms [Citation30]. Diabetes can result in complications in several different organs, but diabetes patients in general practice are often in an early stage, have few diagnosis-specific symptoms, and report good health [Citation31]. Hypertension among general practice patients is as much an asymptomatic risk factor as a disease diagnosis, and most patients with hypertension also rate their health as good [Citation32]. In our study, participants with hypertension had fewer symptoms than the overall mean.
There is often a discrepancy between the experienced symptoms and the symptoms that are revealed in a medical consultation [Citation15]. Although we did not collect information about which symptoms were presented to the GP during the consultation, we have reason to believe that several symptoms were not presented because they may have been seen as irrelevant by the patient and not asked about by the doctor [Citation1].
We have explored symptom patterns for the most prevalent diagnoses. We found differences in the patterns, especially for the diagnoses of depression/anxiety and asthenia, where almost one-third of the symptoms had an increased RR for being reported. These findings suggest some important and clinically expected differences between the diagnoses. However, despite the differences, the selected diagnoses seem to share a common pattern of symptoms. For most symptoms, the RRs in patients with a diagnosis did not differ significantly from those not having the diagnosis. The similarities in the symptom patterns across the diagnoses suggest that symptoms are not necessarily a sign of a particular disease.
Patterns of symptoms have previously been explored using factor analyses [Citation22,Citation33]. A recent Danish study by Eliasen et al. found a strong correlation between symptoms within certain categories, such as the musculoskeletal, gastrointestinal, and cardiopulmonary categories [Citation34]. On the other hand, several studies have demonstrated a general factor that involves loadings from all symptoms. The findings of correlations between symptoms across body regions and organ systems [Citation34,Citation35] confirm that symptom patterns constitute a complex picture.
Reporting a high number of symptoms independent of the type or severity [Citation18] may be indicative of a patient’s future health status [Citation36]. Patients experiencing a high number of symptoms with a high symptom concern or with symptoms that affect daily activities consult a GP more often [Citation2], even though they may present only a selection of the symptoms in the consultation. Insight into the whole pattern of symptoms in patients might provide useful information for clinical evaluations by GPs about whether a patient’s symptoms can be linked to a particular disease.
Conclusion
Our results indicate that most patients report a variety of symptoms, and that these symptoms appear to be partly independent of the diagnoses given by their GP. Information about the total symptom load may provide a better understanding of the patient’s needs. On the other hand, such information might complicate the diagnostic process because symptoms are not necessarily an indication of disease, contrary to what is implied in the existing definition of symptoms.
Ethical approval
The study was presented to the Ethics Board (The Regional Committee for Medical and Health Related Research Ethics in Western Norway) but was exempted from review. Research on anonymous data not collected by the researchers themselves are exempted.
Acknowledgements
We thank the GPs and the patients who participated in this research.
Disclosure statement
The authors report no conflict of interests. The authors alone are responsible for the content and writing of the paper.
Additional information
Funding
References
- Elnegaard S, Andersen RS, Pedersen AF, et al. Self-reported symptoms and healthcare seeking in the general population – exploring “The Symptom Iceberg”. BMC Public Health. 2015;15:685.
- Elnegaard S, Pedersen AF, Sand Andersen R, et al. What triggers healthcare-seeking behaviour when experiencing a symptom? Results from a population-based survey. BJGP Open. 2017;1:bjgpopen17X100761.
- Campbell SM, Roland MO. Why do people consult the doctor? Fam Pract. 1996;13(1):75–83.
- van de Kar A, Knottnerus A, Meertens R, et al. Why do patients consult the general practitioner? Determinants of their decision. Br J Gen Pract. 1992;42(361):313–316.
- Eide TB, Straand J, Rosvold EO. Patients’ and GPs’ expectations regarding healthcare-seeking behaviour: a Norwegian comparative study. BJGP Open. 2018;2:bjgpopen18X101615.
- Paskins Z, Sanders T, Croft PR, et al. Non-disclosure of symptoms in primary care: an observational study. Fam Pract. 2018;35(6):706–711.
- Barry CA, Bradley CP, Britten N, et al. Patients’ unvoiced agendas in general practice consultations: qualitative study. BMJ. 2000;320(7244):1246–1250.
- Malterud K, Hollnagel H. Positive self-assessed general health in patients with medical problems. A qualitative study from general practice. Scand J Prim Health Care. 2004;22(1):11–15.
- Hunziker S, Schlapfer M, Langewitz W, et al. Open and hidden agendas of “asymptomatic” patients who request check-up exams. BMC Fam Pract. 2011;12:22.
- Lexico: symptom [Internet]. Oxford (UK): Oxford University Press; 2020 [cited 2020 June 6]. Available from: https://www.lexico.com/definition/symptom
- Bentzen N, Bridges-Webb C. An international glossary for general/family practice. Fam Pract. 1995;12(3):267.
- Soler JK, Okkes I, Wood M, et al. The coming of age of ICPC: celebrating the 21st birthday of the International Classification of Primary Care. Fam Pract. 2008;25(4):312–317.
- Sporaland GL, Mouland G, Bratland B, et al. General practitioners’ use of ICPC diagnoses and their correspondence with patient record notes. Tidsskr Nor Legeforen. 2019;139(15).DOI: 10.4045/tidsskr.18.0440
- McAteer A, Elliott AM, Hannaford PC. Ascertaining the size of the symptom iceberg in a UK-wide community-based survey. Br J Gen Pract. 2011;61(582):e1–e11.
- Hannay D. The symptom iceberg. London (UK): Routledge & Kegan Paul; 1979.
- Kroenke K. Symptoms and science: the frontiers of primary care research. J Gen Intern Med. 1997;12(8):509–510.
- Croft P. The question is not “have you got it”? But “how much of it have you got”? Pain. 2009;141(1–2):6–7.
- Bruusgaard D, Tschudi-Madsen H, Ihlebaek C, et al. Symptom load and functional status: results from the Ullensaker population study. BMC Public Health. 2012;12:1085.
- Kamaleri Y, Natvig B, Ihlebaek CM, et al. Does the number of musculoskeletal pain sites predict work disability? A 14-year prospective study. Eur J Pain. 2009;13(4):426–430.
- Jackson JL, Passamonti M. The outcomes among patients presenting in primary care with a physical symptom at 5 years. J Gen Intern Med. 2005;20(11):1032–1037.
- Kuorinka I, Jonsson B, Kilbom A, et al. Standardised Nordic questionnaires for the analysis of musculoskeletal symptoms. Appl Ergon. 1987;18(3):233–237.
- Eriksen HR, Ihlebaek C, Ursin H. A scoring system for subjective health complaints (SHC). Scand J Public Health. 1999;27(1):63–72.
- Statistics Norway: general practitioners consultations, by age, sex and diagnosis 2012–2019 [Internet]. Oslo (Norway): Statistics Norway; 2019 [cited 2020 May 18]. Available from: https://www.ssb.no/statbank/table/10141/tableViewLayout1/
- Zijlema WL, Stolk RP, Lowe B, et al. How to assess common somatic symptoms in large-scale studies: a systematic review of questionnaires. J Psychosom Res. 2013;74(6):459–468.
- Aamland A, Malterud K, Werner EL. Patients with persistent medically unexplained physical symptoms: a descriptive study from Norwegian general practice. BMC Fam Pract. 2014;15:107.
- Kroenke K, Price RK. Symptoms in the community. Prevalence, classification, and psychiatric comorbidity. Arch Intern Med. 1993;153(21):2474–2480.
- Kjeldsberg M, Tschudi-Madsen H, Dalen I, et al. Symptom reporting in a general population in Norway: results from the Ullensaker study. Scand J Prim Health Care. 2013;31(1):36–42.
- Mose S, Christiansen DH, Jensen JC, et al. Widespread pain – do pain intensity and care-seeking influence sickness absence? – A population-based cohort study. BMC Musculoskelet Disord. 2016;17:197.
- Tschudi-Madsen H, Kjeldsberg M, Natvig B, et al. Multiple symptoms and medically unexplained symptoms—closely related concepts in general practitioners’ evaluations. A linked doctor–patient study. J Psychosom Res. 2013;74(3):186–190.
- Burton C. Beyond somatisation: a review of the understanding and treatment of medically unexplained physical symptoms (MUPS). Br J Gen Pract. 2003;53(488):231–239.
- Badawi G, Gariepy G, Page V, et al. Indicators of self-rated health in the Canadian population with diabetes. Diabet Med. 2012;29(8):1021–1028.
- Ma C, Zhou W, Huang C, et al. A cross-sectional survey of self-rated health and its determinants in patients with hypertension. Appl Nurs Res. 2015;28(4):347–351.
- Tsai CH. Factor analysis of the clustering of common somatic symptoms: a preliminary study. BMC Health Serv Res. 2010;10:160.
- Eliasen M, Kreiner S, Ebstrup JF, et al. Somatic symptoms: prevalence, co-occurrence and associations with self-perceived health and limitations due to physical health – a Danish population-based study. PLoS One. 2016;11(3):e0150664.
- Witthoft M, Hiller W, Loch N, et al. The latent structure of medically unexplained symptoms and its relation to functional somatic syndromes. Int J Behav Med. 2013;20(2):172–183.
- Creed FH, Tomenson B, Chew-Graham C, et al. Multiple somatic symptoms predict impaired health status in functional somatic syndromes. Int J Behav Med. 2013;20(2):194–205.