
Abstract
Objective
To examine whether education level influences screening, monitoring, and treatment of hypercholesterolemia.
Design
Epidemiological cohort study.
Setting
Department of Clinical Biochemistry, Copenhagen University Hospital Hvidovre.
Subjects
Cholesterol blood test results ordered by general practitioners in Greater Copenhagen were retrieved from 2000-2018. Using the International Standard Classification of Education classification, the population was categorized by length of education in three groups (basic education; up to 10 years, intermediate education; 11-12 years, advanced education; 13 years or more). The database comprised 13,019,486 blood sample results from 653,903 patients.
Main Outcome Measures
Frequency of lipid measurement, prevalence of statin treatment, age and comorbidity at treatment initiation, total cholesterol threshold for statin treatment initiation, and achievement of treatment goal.
Results
The basic education group was measured more frequently (1.46% absolute percentage difference of total population measured [95% CI 0.86%–2.05%] in 2000 and 9.67% [95% CI 9.20%–10.15%] in 2018) over the period compared to the intermediate education group. The advanced education group was younger when receiving first statin prescription (1.87 years younger [95% CI 1.02–2.72] in 2000 and 1.06 years younger [95% CI 0.54–1.58 in 2018) compared to the intermediate education group. All education groups reached the treatment goals equally well when statin treatment was initiated.
Conclusion
Higher education was associated with earlier statin prescription, although the higher educated group was monitored less frequently. There was no difference in reaching treatment goal between the three education groups. These findings suggest patients with higher education level achieve an earlier dyslipidemia prevention intervention with an equally satisfying result compared to lower education patients.
Little is known about the role of social inequality as a possible barrier for managing hypercholesterolemia in general practice.
Increasing education level was associated to less frequent measurement and less frequent statin treatment.
Patients with higher education level were younger, and less comorbidity at first statin prescription.
Education level had no effect on frequency of statin treatment-initiated patients reaching the treatment goal was found.
Key Points
Introduction
Dyslipidemia is commonly defined as high levels of total cholesterol (TC), low-density lipoprotein (LDL), triglyceride, and low levels of high-density lipoprotein (HDL) [Citation1,Citation2], and composes a major risk factor in cardiovascular disease [Citation1,Citation3]. Especially TC and LDL values over 5 mmol/L and 3 mmol/L, respectively are pathologically essential in the formation of atherosclerotic plaques in adults [Citation1]. Statins are the most prevalent agent for treating dyslipidemia, inhibiting HMG-CoA reductase which limits the production of cholesterol in the liver among other functions [Citation4].
The general perception of dyslipidemia has changed from a personal dietary problem to a major public health issue over the past few decades. Screening and treatment, with statins primarily, have drastically increased, while a decrease in blood cholesterol levels has been observed over the last two decades [Citation5,Citation6], possibly also explained partially by reduced smoking and alcohol consumption [Citation7]. The screening and treatment of dyslipidemia of most patients in Denmark are managed by general practitioners, and this poses a source of inequality in the screening and treatment of dyslipidemia patients since the decision by the general practitioner of initiation of statin treatment is an assessment of the specific patient’s risk factors and the possibility of achieving a healthier blood lipid status through lifestyle changes [Citation1]. The frequency of visits to primary healthcare providers differs between socioeconomic groups. In Denmark, patients with lower socioeconomic status are more regular visitors in general practice, whereas higher socioeconomic status patients see practicing specialists more often than patients with a lower status [Citation8–11].
Absolute differences in lipid levels between education groups have been investigated previously in studies from multiple countries, but whether screening and treatment of dyslipidemia are similar among groups with different education levels has been investigated sparsely, unlike in for example, hypothyroidism, acute myocardial infarction, and cancer [Citation12–14]. The aim of this study, therefore, is to examine the association between education level, as a proxy for socioeconomic status, and screening, monitoring, and treatment of dyslipidemia in primary care, and the development of the association over the past decades. Exploring mechanisms of socioeconomic differences in the screening and treatment of dyslipidemia in general practice can be a valuable step in the process of identifying and reducing inequality in primary healthcare.
Methods
Study population and data sources
A combination of subpopulations from the Copenhagen Primary Care Laboratory (CopLab) database and data from the Laboratory Information System (LABKA II) in The Capital Region of Denmark was analysed in this study [Citation15]. Until the end of 2009 lipid results were obtained exclusively from fasting patients. Changes in fasting requirements led to lipid results being obtained from both fasting and non-fasting patients after 2009 [Citation18]. Further information about the data can be found in the article from 2021 by Engell et al. [Citation5] All non-biochemical information was extracted from different national research registries from Statistics Denmark (see Supplementary Material).
The subset of the CopLab-database contained all TC, LDL, HDL, triglyceride and Hb-A1c blood sample results with various supplementary information. A total of 16,077,499 results from 823,086 patients were available before exclusion criteria were applied. Patients with missing or duplicate results, no sex or birthday registered, age below 30 at blood sample date, pregnant patients at blood sample date, no registered education status, patients with residence outside Denmark over 10 years or with over 10 migrations during the period were excluded (see Supplementary Flowchart 1). Education level was classified into the following three categories: ≤10 years of education, classified as basic level education. 11–12 years of education classified as intermediate-level education. ≥13 years of education classified as advanced level education. The grouping of education levels corresponded to the International Standard Classification of Education (ISCED) from 1997 and 2011, with basic, intermediate, and advanced education corresponding to respectively ISCED-11 levels 0–2, level 3, and levels 4–8 [Citation16].
Categorization of comorbidity
The Danish Society of Cardiologists guideline [Citation17], recommends a lower cholesterol threshold for treatment initiation in patients with the following conditions: Ischemic stroke, acute myocardial infarction, coronary artery disease, heart failure, or diabetes mellitus type 2 (see Supplementary Material for diagnosis codes). Therefore, patients were categorized as comorbid if they were diagnosed with at least one of the latter conditions.
Statistical analysis
TC by year was calculated as a mean of all patients in a certain education group for each year (see Supplementary Material).
Frequency of measurement included patients, who were biochemically measured at least once. Prevalence of statin treatment included patients with at least one statin prescription. Both frequencies of measurement and prevalence of statin treatment were calculated as percentages of the total number of people in each education group in Greater Copenhagen each year.
Patients were categorized as treatment initiated if a novel prescription was present during the timespan. The year 2000 was used as a washout period, where all patients with a prescription in the year 2000 were excluded, to prevent patients already in treatment before 2000 to be falsely included as patients with novel prescriptions. Age at statin treatment initiation was calculated as the mean age of all treatment-initiated patients for each education group each year. Comorbidity at statin treatment initiation was calculated as the percentage of all treatment-initiated patients for each education group each year.
TC before statin treatment initiation was limited to results up to six months before the first statin prescription. If a patient had multiple results in the time frame, a mean of those results was used. Treatment goal was based on results from a minimum of six months to a maximum of two years after treatment initiation. Treatment goals were a TC below 5 mmol/L and/or an LDL under 3 mmol/L for non-comorbid patients, and TC below 4 mmol/L and/or LDL below 2 mmol/L for comorbid patients (see Categorization of Comorbidity in Methods). These thresholds were based on the paper by Nordestgaard et al. from 2009 [Citation18]. Finally, a subanalysis exploring the effect of treatment with statins for primary versus secondary prevention in relation to reaching the treatment goal was performed.
Statistical analysis was conducted in SAS 9.4. Multiple regression analysis was performed as differences compared to the intermediate group as a reference corrected for age, sex, and comorbidity, either as absolute difference or as an odds ratio. Multiple regression analyses can be found in the supplementary material. In all analyses, the level of statistical significance was set at p < 0.05. Sensitivity analyses were conducted with HDL, LDL and triglyceride results substituting TC, and with subpopulations of males only and females only.
Results
The basic characteristics are shown in . A total of 13,019,486 out of 16,077,499 (81%) test results from 653,903 out of 823,086 (79%) unique patients were included in the final dataset after exclusion criteria were applied (see supplementary material).
Table 1. Characteristics of Population at First Blood Sample Collection.
Total cholesterol over time
The analysis included 3,579,335 results from 652,951 patients. TC levels decreased from a mean of 5.71 mmol/L (95% CI of 5.70 to 5.73) to 4.93 mmol/L (95% CI of 4.92 to 4.93) from 2000 to 2018. Initially, in 2000 the mean TC level in the basic education group was 0.075 mmol/L (95% CI of 0.052 to 0.099) higher compared to the intermediate education group, whereas the TC level of the advanced education group was 0.161 mmol/L (95% CI of 0.135 to 0.190) lower compared to the intermediate education group. The difference among the education groups was reversed over the period, with the advanced education group having a 0.070 mmol/L (95% CI of 0.058 to 0.082) higher TC level compared to the intermediate education group, and the basic education group was 0.117 mmol/L (95% CI of 0.105 to 0.128) lower compared to the intermediate education group in 2018 (see Figure S1 and S1a in Supplementary).
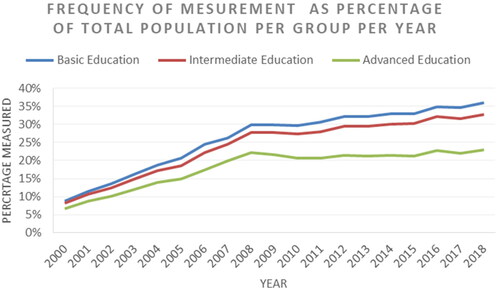
Figure 1. Each line represents an education group’s frequency of measurement as a percentage of the group’s total population per year.
Frequency of blood sample measurement
The analysis included 2,727,385 measured years from 652,951 patients. Frequency of measurement increased from 46,894/595,694 (7.9%) of the total population measured in 2000 to 196,070/673,980 (29.1%) in 2018. The basic education group was measured more frequently compared to the intermediate group with an absolute percentage difference of 0,60% (95% CI 0.02% to 1.18%, p = 0.0438) in 2000 and a difference of 3.33% (95% CI 2.79% to 3.87%, p < 0.0001) in 2018. Whereas the advanced education group was measured less frequently compared to the intermediate group with an absolute percentage difference of 1.46% (95% CI 0.86% to 2.05%, p < 0.0001) in 2000 and a difference of 9.67% (95% CI 9.20% to 10.15%, p < 0.0001) in 2018 ().
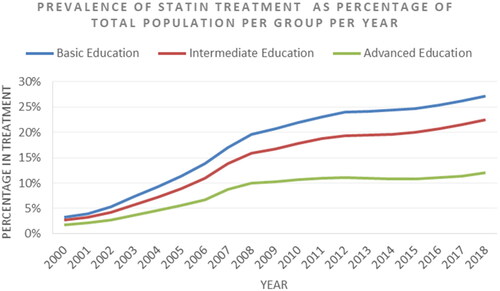
Prevalence of statin treatment
The analysis included 216,256 patients, who in total had 1,564,341 years with prescriptions collectively. Prevalence of statin treatment increased from 15,519/595,694 (2.6%) of the total population with prescriptions in 2000 to 126,836/673,980 (18.8%) in 2018. The basic education group was equal compared to the intermediate group in 2000, but the basic education group was treated more frequently in 2018 with an absolute percentage difference of 4.64% (95% CI 4.07% to 5.22%, p < 0.0001). Whereas the advanced education group was treated less frequently compared to the intermediate group with an absolute percentage difference of 1.00% (95% CI 0.35% to 1.59%, p = 0.0032) in 2000 and a difference of 10.48% (95% CI 9.99% to 10.96%, p < 0.0001) in 2018 ().
Figure 2. Each line represents an education group’s prevalence of treatment as a percentage of the total population of that group per year.
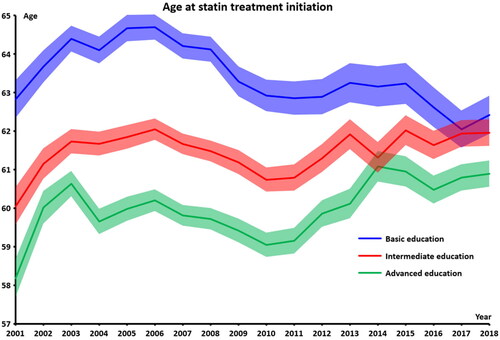
Age at statin treatment initiation
The analysis included 196,434 statin-initiated patients. Age at statin treatment initiation increased from 60.7 (95% CI of 60.6 to 60.9) in 2000 to 61.7 (95% CI of 61.6 to 61.8) in 2018. The basic education group was older at first statin prescription compared to the intermediate education group with an age difference of 2.78 years (95% CI of 2.08 to 3.47) in 2000, and 0.46 years (95% CI of −0.13 to 1.06) in 2018. The advanced education group was younger at first statin prescription compared to the intermediate education basic education.87 years (95% CI of 1.02 to 2.72) in 2000, and 1.06 (95% CI of 0.54 to 1.58) in 2018 ().
Figure 3. Each line represents the mean age a certain year of each education group at the first statin prescription an education group per year. The coloured areas represent 95% confidence intervals.
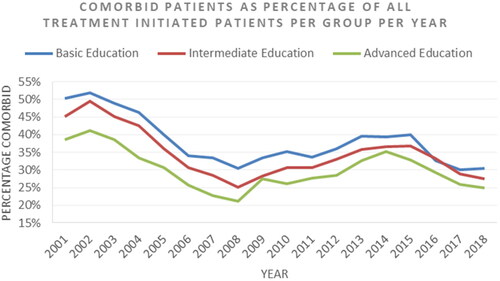
Comorbidity at statin treatment initiation
The analysis included 196,434 statin-initiated patients. Prevalence of comorbidity decreased from 2123/4640 (45.8%) of the treatment-initiated patients in 2000 to 2672/16733 (23.8%) in 2008, but then increased again to 3459/9797 (35.3%). The basic education group was more comorbid compared to the intermediate group in 2000, with an absolute percentage difference of 5.1% (p < 0.0001), and a difference of 3.0% (p < 0.0001) in 2018. Whereas the advanced education group was healthier compared to the intermediate group with an absolute percentage difference of 6.6% (p < 0.0001) in 2000 and a difference of 2.6% (p < 0.0001) in 2018. See .
Figure 4. Each line represents an education group’s comorbidity prevalence at treatment-initiation as a percentage of all patients with new statin prescription per year.
Total cholesterol level before statin prescription initiation
The analysis included 124,213 statin-initiated patients with TC results before initiation. TC threshold for treatment initiation decreased from 6.96 mmol/L (95% CI of 6.91 to 7.01) in 2001 to 6.19 mmol/L (95% CI of 6.16 to 6.22) in 2018. The cholesterol level prior to statin treatment initiation was equal for all education groups in 2000. The cholesterol level at treatment initiation was higher for the advanced education group compared to the intermediate education group, with a difference of 0.102 mmol/L (95% CI of 0.033 to 0.171) and the level for the basic education group was higher compared to the intermediate group, with a difference of 0.122 mmol/L (95% CI of 0.060 to 0.184) in 2018 (see Figure S2 and S2a in Supplementary).
Statin Treatment Goal
The analysis included 101,187 patients with treatment initiation and a subsequent result. Frequency of patients reaching treatment goals increased from 128/453 (28.3%) of patients in 2000 to 8,156/10,461 (78.0%) in 2018. All groups reached the treatment goal equally in all years (see Figure S3 and S3a). Sub-analyses with the population grouped by primary or secondary prevention treatment, showed similar equality in reaching the treatment goal among the education groups (see ).
Sensitivity analysis
Sensitivity analyses were conducted for LDL, HDL, and triglyceride over time, where a similar pattern regarding differences between the education levels was observed for LDL and HDL compared to TC. Triglyceride concentration over time was different from TC over time, with triglyceride levels for basic, intermediate and advanced education groups of respectively 2.07 mmol/L (95% CI of 2.03 to 2.11), 2.00 mmol/L (95% CI of 1,96 to 2.03), 1.73 mmol/L (95% CI of 1.70 to 1.76) in 2000, 1.56 mmol/L (95% CI of 1.55 to 1.57), 1.49 mmol/L (95% CI of 1.48 to 1.50), 1.34 mmol/L (95% CI of 1.33 to 1.35) in 2008, 1.75 mmol/L (95% CI of 1.74 to 1.76), 1.67 mmol/L (95% CI of 1.66 to 1.68), and 1.52 mmol/L (95% CI of 1.51 to 1.52) in 2018.
All analyses were repeated with only females and only males, respectively. A difference in ‘frequency of measurement’ was observed for the basic education group where men in the basic education group were measured less frequently than men in the intermediate group, but still more than the advanced group, in contrast to women, which showed the same result as presented earlier for the total population. For men the ‘age at first statin prescription’ the basic and advanced education groups showed similar ages at statin treatment initiation from 2011 and onwards with the intermediate group being the oldest at statin prescription in this period.
Multiple regression analysis
Multiple regression analysis was performed for ‘Total Cholesterol Over Time’, ‘Total Cholesterol Level Before Statin Prescription Initiation’, and ‘Statin Treatment Goal’. With corrections for age, sex and comorbidity only minor changes were observed for the previous mentioned analyses, with no impact on significance. These results can be found in Supplementary Material (Figures S1, S2, and S3).
Discussion
In this study, we report the differences among three education groups between cholesterol levels, frequency of cholesterol measurement, characteristics at first statin prescription, cholesterol threshold for statin treatment initiation, and a fraction of statin treatment-initiated patients reaching treatment goals. Increasing education level was associated with less frequent measurement, less frequent statin treatment, but younger age, and less comorbidity at first statin prescription, but has a small effect on the cholesterol threshold for initiation of statin treatment, and no effect on the frequency of statin treatment-initiated patients reaching the treatment goal. Especially the age and comorbidity status at first prescription is interesting, as it points towards the higher education group having a more productive interaction with healthcare services when considering the higher education group also are less frequently measured and treated with statins. Multiple regression analysis and sensitivity analysis did not change the results significantly.
Several limitations should be taken into consideration when evaluating this study. A selection bias is unavoidable in this study, since the database comprises patients measured in the primary sector, thus meaning the conclusions of this study are not to be generalized to patients followed in the secondary sector, the tertiary sector, private health care, health care outside Greater Copenhagen, and persons with no contact to the healthcare system in general. Statin prescription also posed a problem, since the medicine register does not have data regarding whether prescribed in primary or secondary healthcare care, or if the prescription was meant as primary or secondary prevention. Another limitation was the lack of data on other mediating factors associated with dyslipidemia such as smoking, dietary habits, alcohol consumption and so on. Having access to data related to lifestyle might provide valuable insights through multiple regression analysis.
This study had multiple strengths, a large and complete non-volunteer population over a long period in a geographically well-defined area. A wide variety of variables on patient information such as medical register, migration, pregnancies, and diagnoses. Data from few laboratories: one laboratory from 2000 to 2015 and from three laboratories from 2016 to 2018. A posthoc sample size estimation showed a power of 99.9999997% with a significance level of 5%.
Numerous studies have examined the association between education level and dyslipidemia, with inconsistent and often diverging results. A Korean study from 2013 including 19041 people concluded that lower education level was associated with high TC, high LDL, low HDL and high triglyceride, but when adjusting for confounders, the relationship was reversed for males but remained unchanged for females [Citation19]. In a study of 43,706 Americans from 2006 with data spanning over 30 years, the authors concluded that there was no association between education level and TC or LDL [Citation20]. In 2019 a Chinese study of 9525 people over the age of 45 found lower socioeconomic status to be linked to high TC, high LDL and low HDL, but not to high triglyceride, but when adjusting for confounders none of these relationships remained significant [Citation21]. An Australian study, published in 2010 with a population of 11247 people, found a confounder-adjusted correlation between education and high triglyceride, but not with low HDL [Citation22]. In 2012 an Indian study including 6198 people found lower education level to be correlated when adjusting for confounders with low HDL and high triglyceride, but an inverse correlation was found when looking at TC [Citation23].
A few studies have examined cholesterol measurement and treatment patterns in relation to education level. Higher education level was linked to more screening in an American study from 2021 with 16680 people [Citation24]. Whereas a Japanese study from 2018 found no association between education level and the prevalence of hypercholesterolemia and similarly no association when looking at prevalence of treatment for these hypercholesterolemia patients [Citation25]. The results from these seven studies agree with the results presented in this article, namely that lower education has little or no effect on higher absolute values of TC or LDL, especially when adjusting for confounders.
Several possible developments over the years can be suspected to influence the cholesterol levels, treatment, and measurement habit for dyslipidemia patients. The changes to reimbursement on statins in 2006 [Citation26], and the expiration of the patent of atorvastatin in 2011 and simvastatin in 2006 resulting in a steep reduction in price, with both measures increasing the accessibility of treatment in Denmark. The banning of trans-fat acids in 2003 in Denmark and 2021 in the EU [Citation27,Citation28], was a determining factor for lower triglyceride levels especially, but also influence LDL and TC [Citation1]. Additionally, changing views on smoking, alcohol consumption, physical activity and dietary habits has been promoted by a plethora of campaigns over the 19-year period. Lastly changes in demographic composition regarding age, may have an influence, as TC increases for men, but decreases for women when reaching 50 years of age [Citation5]. The differences in age and comorbidity among education groups at treatment initiation could be an indicator of intrinsic motivation to seek preventive medical screening, in addition to better health literacy unique to higher education patients. Future studies should focus on establishing and isolating mediators and confounders in the complex relation between education level and socioeconomic status and dyslipidemia, furthermore the distinction of statin treatment as either secondary or primary prevent should be taken into consideration.
Conclusion
An association was found between increasing education level and less frequent measurement, less frequent statin treatment, younger age, and less comorbidity at first statin prescription. But increased educational level has a small effect on the cholesterol threshold for initiation of statin treatment, and no effect on the frequency of statin treatment-initiated patients reaching the treatment goal. Multiple regression analysis provided no change to the results. This points towards a difference in the interaction with primary healthcare among the education groups, as the higher education group are treated earlier, although counterintuitively the lower education groups are more frequently measured and treated with statins altogether. Further research on this subject is needed to draw definitive conclusions.
Supplemental Material
Download MS Word (196.2 KB)Disclosure statement
No potential conflict of interest was reported by the author(s).
Correction Statement
This article has been corrected with minor changes. These changes do not impact the academic content of the article.
References
- Grundy SM, Arai H, Barter P, et al. An international atherosclerosis society position paper: global recommendations for the management of dyslipidemia-full report. J Clin Lipidol. 2014;8(1):29–60.
- Alberti KGMM, Eckel RH, Grundy SM, et al. Harmonizing the metabolic syndrome. Circulation. 2009;120(16):1640–1645.
- Emini Veseli B, Perrotta P, De Meyer GRA, et al. Animal models of atherosclerosis. Eur J Pharmacol. 2017;816:3–13.
- Sirtori CR. The pharmacology of statins. Pharmacol Res. 2014;88:3–11.
- Engell AE, Jørgensen HL, Lind BS, et al. Decreased plasma lipid levels in a statin-free Danish primary health care cohort between 2001 and 2018. Lipids Health Dis. 2021;20(1):1–9.
- Walley T, Folino-Gallo P, Stephens P, et al. Trends in prescribing and utilization of statins and other lipid lowering drugs across Europe 1997-2003. Br J Clin Pharmacol. 2005;60(5):543–551. Nov
- Sundhedsstyrelsen. Danskernes sundhed. Den nationale sundhedsprofil 2021. Rosendahls A/S 2021;1:166–170.
- Dalsgaard EM, Vedsted P, Fenger-Grøn M, et al. Socioeconomic position and contact to general practice among persons with diabetes. Prim Care Diabetes. 2012;6(4):313–318.
- Hoebel J, Rattay P, Prütz F, et al. Socioeconomic status and use of outpatient medical care: the case of Germany. PLOS One. 2016;11(5):e0155982.
- Sørensen TH, Olsen KR, Vedsted P. Association between general practice referral rates and patients’ socioeconomic status and access to specialised health care. Health Policy. 2009;92(2–3):180–186.
- Vikum E, Johnsen R, Krokstad S. Social inequalities in patient experiences with general practice and in access to specialists: the population-based HUNT study. BMC Health Serv Res. 2013;13(1):240.
- Møllehave LT, Jacobsen RK, Linneberg A, et al. Influence of educational level on test and treatment for incident hypothyroidism. Clin Endocrinol. 2021;94(6):1025–1034.
- Siegel R, Ward E, Brawley O, et al. Cancer statistics, 2011. CA Cancer J Clin. 2011;61(4):212–236.
- Kriegbaum M, Hougaard CØ, Andersen I, et al. Life course analysis on income and incident AMI: a Danish register-based cohort study. J Epidemiol Community Health. 2019;73(9):810–816.
- The Copenhagen Primary Care Laboratory Database [Internet]. [cited 2020 Apr 1]. Available from: https://publichealth.ku.dk/research/databases-for-collaboration/coplab/.
- UNESCO. http://uis.unesco.org/sites/default/files/documents/international-standard-classification-of-education-isced-2011-en.pdf. ISCED 2011. 2012. p. 33–7.
- Bork C, Henriksen FL, Kanstrup H, et al. MH. 28. Dyslipidæmi. Dansk Cardiol Selsk. 2022;1:1.
- Nordestgaard BG, Hilsted L, Stender S. Plasmalipider hos ikkefastende patienter og signalværdier på laboratoriesvar. Ugeskr Læger. 2009;171(13):1093.
- Nam GE, Cho KH, Park YG, et al. Socioeconomic status and dyslipidemia in Korean adults: the 2008–2010 Korea national health and nutrition examination survey. Prev Med. 2013;57(4):304–309.
- Kanjilal S, Gregg EW, Cheng YJ, et al. Socioeconomic status and trends in disparities in 4 major risk factors for cardiovascular disease among US adults, 1971–2002. Arch Intern Med. 2006;166(21):2348–2355.
- Song P, Zha M, Yang X, et al. Socioeconomic and geographic variations in the prevalence, awareness, treatment and control of dyslipidemia in middle-aged and older Chinese. Atherosclerosis. 2019;282:57–66.
- Kavanagh A, Bentley RJ, Turrell G, et al. Socioeconomic position, gender, health behaviours and biomarkers of cardiovascular disease and diabetes. Soc Sci Med. 2010;71(6):1150–1160.
- Gupta R, Deedwania PC, Sharma K, et al. Association of educational, occupational and socioeconomic status with cardiovascular risk factors in Asian Indians: a cross-sectional study. PLOS One. 2012;7(8):e44098.
- Lueckmann SL, Hoebel J, Roick J, et al. Socioeconomic inequalities in primary-care and specialist physician visits: a systematic review. Int J Equity Health. 2021;20(1):58.
- Fujiyoshi N, Arima H, Satoh A, et al. Associations between socioeconomic status and the prevalence and treatment of hypercholesterolemia in a general Japanese population: NIPPON DATA2010. J Atheroscler Thromb. 2018;25(7):606–620.
- Friis ML. Indstilling til tilskudsstatus for lipidsænkende lægemidler, ATC-gruppe C10. MEDICINTILSKUDSNÆVNET. 2006;1:1-5.
- Marschang S. EU (nearly) trans fats free. Eur Public Health. 2021; 1:1.
- The Danish Veterinary and Food Administration Trans-fatty acid content in food. Minist Food Agric Fish. 2021;1:1.