
Abstract
This study analyzes the optimal harvesting of uneven-aged Norway spruce (Picea abies (L.) Karst.), Scots pine (Pinus sylvestris L.), and birch (Betula pendula Roth. and B. pubescens Ehrh.) stands. The analysis is based on an economic description of uneven-aged forestry using a size-structured transition matrix model and a single-tree model. The optimization problem is solved in its general dynamic form using gradient-based interior point methods. Increasing the harvesting interval decreases the annual volume yield. Assuming natural regeneration, this suggests that volume yield is maximized by uneven-aged rather than even-aged management. The present value of stumpage revenues is maximized after saw timber and pulpwood prices, interest rate, and a 15-year harvesting interval are included. The economically optimal solution with a 3% interest rate produces an annual yield of 1.9, 6.2, and 3.1 cubic meters for Scots pine, Norway spruce, and birch, respectively. Both the optimal volume yield and net present value maximization solutions converge to unique species- and site-type-specific steady states with constant harvests. The transition matrix model typically used in optimization studies is computationally less demanding than the single-tree model, but the differences in optimal solutions are more remarkable than earlier studies suggest.
Introduction
Traditional forest industry and timber production are declining in Europe, Canada, and the USA, while paper and pulp production are increasing in tropical countries. Among other factors, in Nordic countries this is shifting the focus from traditional forest policy emphasizing maximum sustainable yield to forestry that emphasizes biodiversity and forest owners’ economic objectives. Prior forest policy in Finland and in Sweden has been strongly oriented toward even-aged management (Siiskonen Citation2007; Lundmark et al. Citation2013). However, according to a recent study, the majority of Finnish forest owners now prefer alternatives for even-aged forest management and clear-cuts in particular (Kumela & Hänninen Citation2011). Finnish forest legislation has consequently undergone its largest change in decades at the beginning of 2014. The main goal of the new forest policy is to expand the alternatives open to forest owners. Although these changes have actively been discussed and there is urgent need to understand various aspects of uneven-aged forestry, the number of studies on the economics of uneven-aged forestry in Nordic conditions remains low. One reason for this has been the limited ecological knowledge on the growth of Nordic forests under uneven-aged structure. Our study aims to increase economic understanding on uneven-aged management by applying an uneven-aged growth model (Bollandsås et al. Citation2008) that is possibly the first stand growth model estimated for uneven-aged Norway spruce, Scots pine, and birch using Nordic data.
The seminal paper on optimal uneven-aged forestry is by Adams and Ek (Citation1974). They present a transition matrix model and use dynamic optimization but apply several simplifications. Although these simplifications are typical for many following studies, some early studies have been able to solve the complicated numerical optimization problem in general form (e.g. Haight Citation1985, Citation1987; Getz & Haight Citation1989). However, only a few studies optimizing uneven-aged management in Fennoscandian conditions exist. Wikström (Citation2000) specifies an uneven-aged growth model with fixed regeneration and optimizes Norway spruce harvesting under a minimum constraint on stand volume. According to his findings uneven-aged management yields about 10% lower net present value compared to even-aged management. Andreassen and Øyen (Citation2002) find similar results by estimating economic output in an empirical experiment. However, in their study, the high net present value of even-aged forestry may be influenced by the initial state of the stand. Tahvonen (Citation2009) applies a transition matrix growth model for Norway spruce by Kolström (Citation1993). According to this growth model, natural regeneration in uneven-aged stands is not a limitation and uneven-aged management consequently becomes economically superior. Pukkala et al. (Citation2009) estimate a single-tree model for Norway spruce, Scots pine, and birch. In their simulation with no optimization, Norway spruce yields 5–7 m3 ha−1 a−1. Pukkala et al. (Citation2010) apply this model to optimization using the “Investment Efficient” model. The approach deviates from general economic principles and is criticized, e.g. in Haight (Citation1985). According to Pukkala et al. (Citation2010), uneven-aged solutions are economically superior for both Norway spruce and Scots pine when compared to even-aged solutions. Tahvonen et al. (Citation2010) estimate a transition matrix model for Norway spruce from two long-term experiments and optimize Norway spruce harvesting for one-site type. According to their dynamic optimization framework, the solutions converge to steady states where trees with diameter more than 23–27 cm are harvested every 12–15 years, and timber flow is constant over time. Even-aged management is found to yield the highest volume output, while uneven-aged management is found to be superior in economic terms. Tahvonen (Citation2011) uses the growth model by Pukkala et al. (Citation2009) and optimizes the single-tree model for Norway spruce. One of his findings is that due to fluctuations in stand density and regeneration, the optimal steady-state size structure is serrated, thus deviating from the classic, inverted-J structure.
Existing economic studies for Nordic conditions are more or less based on two ecological growth models (Kolström Citation1993; Pukkala et al. Citation2009). This is potentially problematic, as studies on even-aged forestry show that economic results may be very sensitive to the growth model used (Tahvonen et al. Citation2013). Bollandsås et al. (Citation2008) specify a stand-level growth model for single- and mixed-species uneven-aged Norway spruce, Scots pine, and birch forests. So far this model has only been applied in economic studies by Buongiorno et al. (Citation2012), where mixed-species stand management is optimized with a focus on carbon storage using the Investment Efficient approach. The aim of our study is to utilize the growth model by Bollandsås et al (Citation2008) and compute optimal uneven-aged solutions for single-species Norway spruce, Scots pine, and birch stands based on the general dynamic economic optimization approach (cf. Getz & Haight Citation1989, p. 263). This yields completely novel results for uneven-aged Scots pine and birch and valuable results comparable with earlier studies for Norway spruce.
Materials and methods
The growth model and the optimization problem
Let xst, denote the number of trees in age class s at period t. Denote
, t = 0, 1, … and
where δst is the diameter at breast height of age class s at period t. Natural mortality is given by µs(xt, δt),
ingrowth by
and harvests by hst,
Denote the 5-year diameter increment of a single tree in age class s by
Stand development can now be given as follows:
Bollandsås et al. (Citation2008) simplify this single-tree model into a transition matrix model by dividing the 5-year diameter increment with the width of the size class, i.e. , where βs(xt) denotes the fraction of trees moving to size class s + 1 at period t and w the width of the size class. The fraction remaining in the same size class is denoted by
. With this simplification, stand development can be given as follows:
Denoting the discount factor as , where r is the interest rate (pa), the objective function is:
where vs1 and vs2 denote the saw log and pulpwood volumes (in m3) of a tree in size class s and p1 and p2 the stumpage prices for saw timber and pulpwood, respectively. In Equation (8), the objective is to maximize the present value of stumpage revenues as, e.g., in Haight and Monserud (Citation1990). An alternative is to include a harvesting cost model and roadside prices. This would change the stumpage price level if the yield per harvest is low. According to the harvesting cost model by Nieminen et al. (Citation2006), the cost per m3 is approximately constant if harvest is 25 m3 or higher. In our economic solutions, the stand is harvested every 15 years, implying that the yield per harvest typically exceeds 25 m3, i.e. using roadside prices, and a harvesting cost model should not cause any major changes in the optimal solutions. In the case of the single-tree model, timber assortment volumes are given as a functions of diameter, . When maximizing volume production, we simply set
In addition to Constraints (1)–(4), or (5)–(7) with the transition matrix model, the solution must satisfy:
The optimal solutions will be computed applying different harvesting intervals, i.e. assuming that
The optimization problem specified by the objective function (8) and the restrictions given by Equations (1)–(4), or (5)–(7) in the case of transition matrix model, and Equations (9)–(11), are a discrete-time nonlinear optimal control problem. All functions are continuously differentiable and optimization can be based on the Karush–Kuhn–Tucker theorem of nonlinear programming. We apply Knitro optimization software that includes gradient-based interior point algorithms (Byrd et al. Citation1999, Citation2006). Optimization results have been calculated using Knitro versions 7.0.0 and 8.1.1 (results are independent of the version used). To increase the probability of finding the global optimum, multiple (5–50) random starting points are used. The dynamic solutions are computed using a planning horizon of 750–1500 years to obtain a satisfactory approximation of optimal infinite horizon solutions.
The optimization codes used are available at http://blogs.helsinki.fi/ee-opt/optimization-codes/.
Models on forest growth and economic parameters
We apply the forest growth model from Bollandsås et al. (Citation2008) for Norway spruce, birch, and Scots pine. For each species, the number of size classes is 12, ranging from 75 mm to 625 mm at 50 mm intervals. For single-tree specification, the number of age classes is set between 20 and 40 to guarantee that the number of classes does not restrict the optimal solutions. Harvest activities are optimized for four site types, with the height of the dominant trees at the age of 100 (40) being 15 (6), 20 (11), 24 (15) and 27 (17) m (referred to as H100=15, H100=20, H100=24, and H100=27). The dominant height at age 40 is used in Bollandsås et al. (Citation2008), but as the height at age 100 is more commonly used in Finland, we transform the H40 site indices to H100 site indices using height development measurements in Vuokila and Väliaho (Citation1980). We omit the most productive and least productive sites for Scots pine and birch, respectively, as growing these species at these sites is less common. Unlike Bollandsås et al. (Citation2008), we assume that harvests are carried out at the end of the growing period without any essential changes occurring in the results.
Ahti et al. (Citation1968) state that despite the oroarctic zone dominating Norway, the valleys of Southern Norway are highly continental sections belonging to the same section as the southern boreal zone in Sweden and in Finland. Andreassen and Øyen (Citation2011) show that even-aged stand growth models from Norway, Sweden, and Finland predict similar levels of growth. Therefore, results obtained by using a growth model estimated from Norwegian data should be comparable with studies based on Finnish and Swedish data. To demonstrate this, we compare the model by Bollandsås et al. (Citation2008) with a model based on Finnish data (Pukkala et al. Citation2009).
Given some typical uneven-aged structures with a total basal area of approximately 19 m2 ha−1, the model by Bollandsås et al. (Citation2008) produces a slightly higher growth rate compared to that of Pukkala et al. (Citation2009; ) for all species. Decreasing basal area causes the growth rate of Pukkala et al. (Citation2009) to exceed that of Bollandsås et al. (Citation2008). Ingrowth of Pukkala et al. (Citation2009) is lower with higher basal areas but becomes very high as the basal area approaches zero (). This applies to all species. A small difference exists between the models concerning the mortality of trees under 30 cm in diameter, but as tree diameter increases even further, mortality in the model by Bollandsås et al. (Citation2008) increases, while it remains approximately zero in Pukkala et al. (Citation2009; ). Mortality’s diameter dependency in Bollandsås et al. (Citation2008) allows the model to depict forest development assuming no harvests, while the low mortality in Pukkala et al. (Citation2009) restricts the model’s reliable range. Overall, although some differences do exist, the models appear comparable, and there are no a priori reasons to expect that the model by Bollandsås et al. (Citation2008) is unable to describe the growth of uneven-aged stands reasonably well in Fennoscandia outside Norway.
![Figure 1a–c. Diameter increment, ingrowth, and mortality of Norway spruce using growth models by Pukkala et al. (Citation2009) and Bollandsås et al. (Citation2008), with size-distribution x = [300,180,120,80,50,30,18,10,2,0,0,…].](/cms/asset/33938f1c-0eb9-40b5-bc44-8c0ddee1afc4/sfor_a_982166_f0001_oc.jpg)
In addition to the model presented by Bollandsås et al. (Citation2008), a height model is needed to calculate volumes as described in Heinonen (Citation1994). As uneven-aged stands grow substantially differently than even-aged stands, the model has to be estimated using uneven-aged data. We will therefore use the height model from Pukkala et al. (Citation2009).
Stumpage prices are presented in . They are calculated using the average from Finnish deflated stumpage prices from 2000 to 2011 (Forest Statistics Information Service Citation2012) at the level of 2011.
Table 1. Saw log and pulpwood stumpage prices for Scots pine, Norway spruce, and birch, € m−3.
Results
Stand basal area development with no harvests
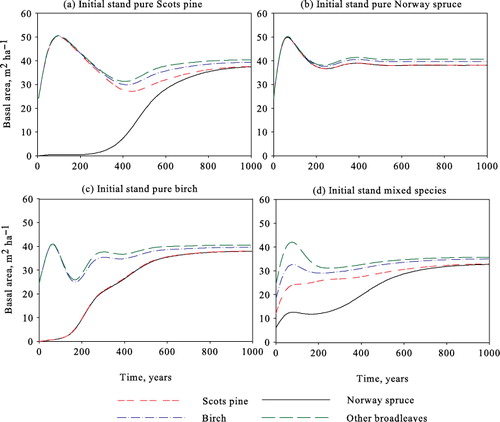
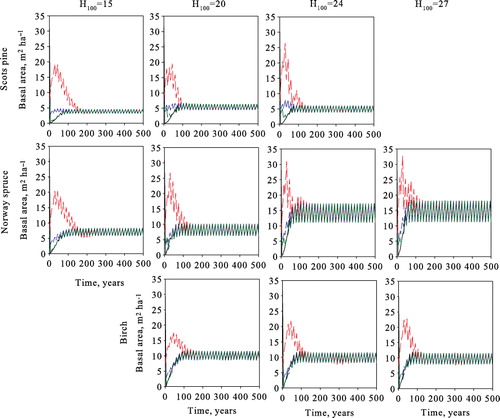
In , we ensure our application of the ecological model by comparing stand development without harvests with the outcomes presented by Bollandsås et al. (Citation2008). Comparisons of their Figures 2–3 and Table IX show that the outcomes are equivalent with sufficient accuracy. The only slight differences to be found occur when the initial stand consists of pure Scots pine (), where the basal area increase is slightly lower during the first 100 years and tree mortality is somewhat higher during the following 100–300 years. The model predicts that all the sites will be dominated by Norway spruce in the long run, as shown in .
Maximizing volume yield
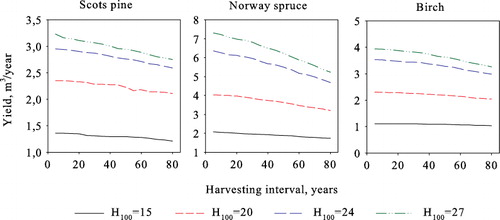
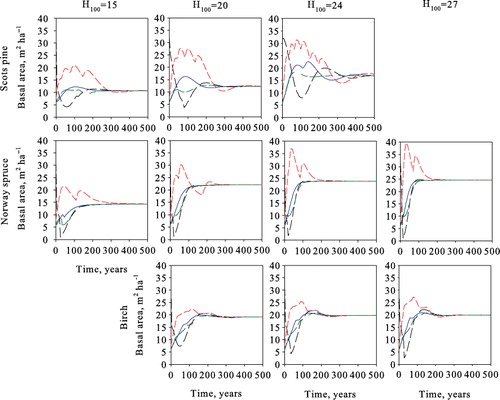
When comparing model results with earlier studies it is useful to first analyze the optimization outcomes in the simplest possible (and theoretical) case of maximizing volume yield. As shown in , the highest average annual steady-state yield is obtained by harvesting the stands during each period for all species and at all sites. This reveals that according to this model, volume production based on natural regeneration is maximized under uneven-aged rather than even-aged management and clear-cuts. We, therefore, focus our maximum volume yield analysis on the five-year harvesting cycle. As seen in , the different initial states converge to the same species- and site-type-specific steady states, i.e. the optimal long-run steady state is independent of the initial stand state.
Optimal steady-state solutions for the volume yield maximization problem are presented in . Both yield and basal area increase with site productivity for all species. As site productivity increases, the number of trees per hectare in Scots pine and birch stands decreases from 329 to 245 and from 795 to 726, respectively. This can be explained by the fact that a smaller portion of trees moves to the next size class at sites with lower productivity. This combined with either decreasing (Scots pine) or stable (birch) ingrowth results in a higher number of trees at less productive sites (). The ingrowth of Norway spruce increases, as does the number of trees per hectare as site productivity increases.
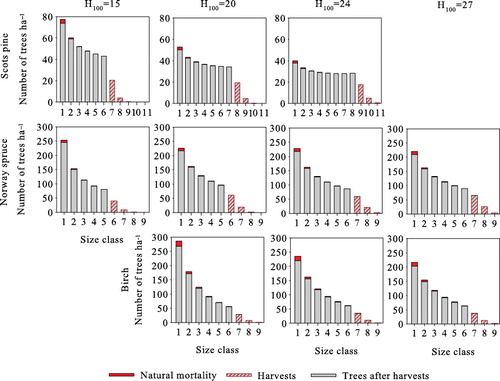
Table 2. The optimal steady-state solution when maximizing volume yield for Scots pine, Norway spruce, and birch using a 5-year harvesting interval.
In the steady state, the number of harvested trees per hectare per year decreases from 1.8 to 1.2 for Scots pine as site productivity increases, but increases from 3.6 to 7.2 and from 2.6 to 3.8 for Norway spruce and birch, respectively. The diameter at breast height of harvested Scots pine trees is 35–39.9 cm at H100=15, and it increases with site productivity. Norway spruce and birch are harvested when they reach a diameter of 30 cm at H100=15 and 35 cm at other sites. With all species the yield is mainly saw log (not shown).
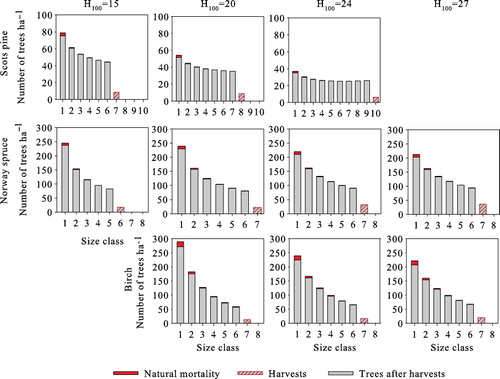
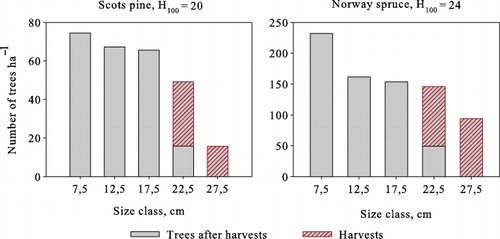
shows the optimal steady-state structures of all species at all site types. The number of trees per hectare is the highest in the smallest size classes and decreases with size, resembling the classic inverted-J structure. However, for Scots pine, differences between size classes of over 20 cm are small, especially at more productive sites. In all cases, the harvested trees belong to the largest size class, i.e. harvests are from above, and the harvested size class is harvested completely. Natural mortality is lowest for Scots pine, where on average 0.2% of trees die every year. This figure is 0.5% for Norway spruce, and the highest for birch at 0.8%. Natural mortality of all species is highest in the smallest size class (), being 4.4–6.2% for Scots pine, 3.3–4.6% for Norway spruce, and 5.8–6.7% for birch.
Maximizing forestry income with zero interest rate
The price difference between saw logs and pulpwood in addition to interest rate is implemented into the optimization to maximize forestry income. First, the interest rate is set to zero. We also include a constraint to only allow harvests every 15 years, or every third period, which implicitly takes into account fixed harvesting cost and the fact that too low yield may not be merchantable.
Compared to volume yield maximization, maximizing forestry income under a zero interest rate decreases the average annual yield by 1–5% (). Harvests are heavier in all cases due to the longer harvesting interval, with the size threshold of harvested trees being the same as in volume yield maximization, apart from Scots pine at H100=24 where the harvesting threshold decreases by one size class. This is due to the quickly decreasing growth rate at diameters over 50 cm. The three largest size classes are harvested completely in all cases ().
Table 3. Optimal steady-state solutions when maximizing the net present value of forestry income with a 0% interest rate for Scots pine, Norway spruce, and birch using a 15-year harvesting interval
As in volume yield maximization, both yield and stand basal area increase when site productivity increases. The number of trees per hectare decreases for Scots pine and birch and increases for Norway spruce. Average natural mortality increases and ingrowth decreases from the volume yield maximization, but the differences are small. An exception to these is Scots pine at H100=24, where average basal area decreases due to the lower harvesting threshold, decreasing natural mortality, and increasing ingrowth slightly.
Maximizing present value of forestry income with a 3% interest rate
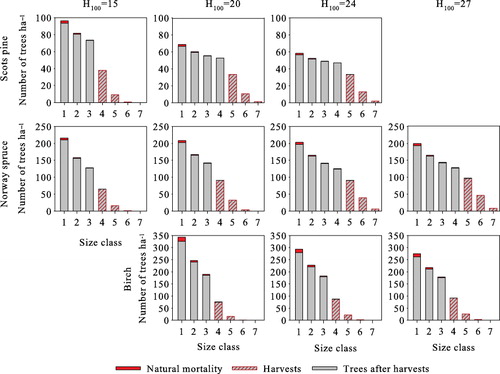
The optimal steady-state results of maximizing the net present value of forestry income with a 3% interest rate are presented in . Increases in the interest rate decreases the annual yield and revenues per harvest at all sites. Additionally, the size of harvested trees decreases by several size classes. The number of harvested trees per harvest increases significantly, varying around 48, 83–152, and 92–120 trees ha−1 for Scots pine, Norway spruce, and birch, respectively. Basal area decreases by approximately 10 m2 ha−1 from the zero interest rate solution, increasing ingrowth and decreasing natural mortality for all species at all site types. As with volume yield maximization, different initial stands converge to the same species- and site-type-specific optimal steady states ().
Table 4. Optimal steady-state solutions when maximizing the net present value of forestry income with a 3% interest rate for Scots pine, Norway spruce, and birch using a 15-year harvesting interval.
As with volume yield maximization and zero interest rate steady states, the stand size class structures satisfy the classical inverted-J form with a 3% interest rate as well (). Harvests target the three largest size classes, which are harvested completely. Revenues per harvests increase with site productivity, and in the steady state, they are €664–€1514 ha−1 for Scots pine, €1166–€4836 ha−1 for Norway spruce, and €1222–€1926 ha−1 for birch. Assuming an initial state where and a time horizon of 1000 years, growing Norway spruce produces the highest net present value of forestry income at all sites.
Optimization based on the single-tree model specification
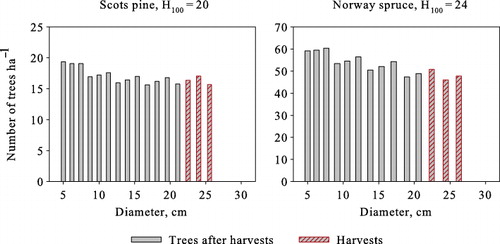
We next compute the solutions without the transition matrix simplification. The optimal steady-state solutions with a 3% interest rate and a 15-year harvesting interval are presented in . The average annual yield and revenues per harvests of both cases are substantially lower than in the optimal steady state computed using the transition matrix model. In addition, basal areas are 1–5 m2 ha−1 lower both before and after harvests. Regardless of the growth model type used, the three largest age/size classes are harvested completely (–), with the number of harvested trees being almost equal, as well as the lower size threshold of harvested trees. The size of the largest harvested trees, on the other hand, is clearly lower with the single-tree model. In the optimal steady states obtained with single-tree model, the number of trees in lower diameters is higher (–), resulting in higher natural mortality. Additionally, the average annual ingrowth is slightly higher due to the lower average basal area.
Table 5. Optimal steady states based on the single-tree model. The site for Scots pine is H100 = 20 and H100 = 24 for Norway spruce. An interest rate of 3% and a harvesting interval of 15 years.
The optimal steady-state structures obtained using the single-tree model deviate from the inverted-J structure and rather follow a serrated form (). With trees grouped into the same size classes as in the transition matrix model, the number of trees per hectare is highest in the smallest size class and decreases with increasing diameter, but the structure still clearly deviates from the structure obtained with transition matrix model ().
Discussion
In our study, we have computed optimal solutions for uneven-aged forest management for pure Scots pine, Norway spruce, and birch stands. Optimization is carried out at three to four site types, depending on tree species. This is the first study where optimal harvesting is solved for uneven-aged Scots pine in Fennoscandian conditions using dynamic optimization. In addition, no earlier studies optimizing the management of uneven-aged birch exist.
According to the classic view, the size structure of uneven-aged forests resembles the inverted-J shaped form (De Liocourt Citation1898; Usher Citation1966). In our study, the optimal steady-state structures resemble this classic structure in all cases based on the transition matrix model, although in pure Scots pine stands, the differences in the number of trees between size classes over 20 cm are small because of very low mortality. The inverted-J shape follows directly from the characteristics of the transition matrix model. The structure could deviate from the classic inverted-J structure if the transition rate of smaller size classes exceeded the transition rate and the mortality of larger size classes. As seen from various growth models, this is not the case in smaller size classes due to undergrowth competition (e.g. Kolström Citation1993; Bollandsås et al. Citation2008; Pukkala et al. Citation2009). However, the growth rate in larger size classes begins to decrease and mortality to increase, making it optimal to harvest the trees before the stand deviates from the classic structure. The classic structure has been typically found optimal in studies using transition matrix models (e.g. Adams & Ek Citation1974; Buongiorno & Michie Citation1980; Tahvonen et al. Citation2010). However, as single-tree models lack the simplification of fixed size classes, we found that the steady-state structure may deviate from the inverted-J structure as in Tahvonen (Citation2011).
Our results show that the annual ingrowth for Scots pine is low, approximately two trees per hectare at H100=24. Using our volume yield maximization steady-state solution at H100=24, the ingrowth function from Pukkala et al. (Citation2009) annually produces the same two trees per hectare on average.
To understand whether Scots pine’s low yield is a consequence of low ingrowth, we vary the ingrowth and compare it to the baseline solution. Multiplying the ingrowth function by 2 increases the annual yield by 32%. The number of harvested trees increases by a factor of 2.33, but simultaneously it becomes optimal to harvest trees when they enter size class 42.5 cm, instead of the baseline where they are harvested from size class 52.5 cm. The switch happens because otherwise the basal area would become high due to the increased number of trees per hectare and would have a strong negative impact on ingrowth. If ingrowth is set exogenously at a level about twice as high as in the baseline solution, the yield once again increases only by approximately 33% and density increases are avoided by harvesting trees from size class 47.5 cm. This shows that the low yield of uneven-aged Scots pine is an outcome of the density-dependence effects, both in ingrowth and in the transitioning of trees between the size classes. This is understandable because Scots pine is a shade-intolerant tree species (Assmann Citation1970, p. 44).
We note that the diameter growth of Scots pine obtained by the model by Bollandsås et al (Citation2008) is rather high if compared, e.g. to process based even-aged model used in Tahvonen et al. (Citation2013) where the mean diameter at clear-cut seldom exceeds 30 cm. This may partly follow from lower stand density in uneven-aged solutions and partly because the transition matrix simplification may overestimate the diameter growth for Scots pine similarly as for Norway spruce.
Uneven-aged Norway spruce has been studied in several papers, but the growth model by Bollandsås et al. (Citation2008) has previously not been integrated with general dynamic optimization. Wikström (Citation2000) uses single-tree model (with trees classified into diameter groups, fixed ingrowth, and lower bound constraints to stand volume), Tahvonen (Citation2009) and Tahvonen et al. (Citation2010) use transition matrix models, and Pukkala et al. (Citation2010) use the Investment Efficient model and Tahvonen (Citation2011) dynamic optimization and single-tree models from Pukkala et al. (Citation2009) without simplifications. Getz and Haight (Citation1989, p. 250–259) compare single-tree and transition matrix models (without optimization) and find that their performance and projections are rather similar.
According to the (infinite time horizon approximation) results, in Wikström (Citation2000) optimal steady-state basal area varies between 16 and 24 m2 ha−1, trees are cut before they reach 28–34 diameter class, and the long-term annual volume output of H100 = 28 Norway spruce site varies between 3.1 m3 ha−1 and 3.2 m3 ha−1 given a 3% interest rate. Compared to our results () the main difference is that our steady-state volume output is 6.2 m3 ha−1 for H100=27 site. Wikström (Citation2000) assumes a fixed ingrowth equal to 10 trees per year, while our endogenous ingrowth is 12.5 trees per year. This explains about 2 m3 ha−1 difference in volume output. In addition, Wikström (Citation2000) does not allow stand volume to decrease below 150 m3 ha−1, while our optimal steady-state stand volume after harvest is 77 m3 ha−1. This restriction may explain the remaining difference in volume output.
When maximizing the net present value of forest revenues using a 3% interest rate, the yield in the optimal steady state in Tahvonen (Citation2009) is approximately 1.5 m3 ha−1 a−1 higher compared to our results. This difference follows mainly from the high level of ingrowth predicted by the ingrowth model in Kolström (Citation1993).
The annual yield in optimal steady state in Tahvonen et al. (Citation2010) is approximately 6 m3 ha−1, which is close to our results. The size of the harvested trees is approximately the same as in our results, but basal area and the number of trees per hectare is clearly lower in their study. Tahvonen et al. (Citation2010) show that the ingrowth’s sensitivity to increasing density is the cause for a low basal area. The ingrowth function for Norway spruce in Bollandsås et al. (Citation2008) is clearly less sensitive to high densities, as we obtain similar ingrowth levels with significantly higher basal areas.
Pukkala et al. (Citation2010) use the growth model from Pukkala et al. (Citation2009) and a static approach for solving an “Investment Efficient,” or IE, model instead of the generic dynamic problem. Though, as discussed in Haight (Citation1985), Getz and Haight (Citation1989, p. 287–295), Tahvonen and Viitala (Citation2006) and Tahvonen (Citation2011), the IE model lacks theoretical basis and may lead to more or less incorrect economic solutions. Pukkala et al. (Citation2010) additionally follow Bare and Opalach (Citation1987) and require the postharvest structure to resemble the Weibull distribution and optimize the parameters of this function instead of the number of trees directly. This may simplify computation but will yield an additional deviation from the correct steady-state solution. Thus, our results and results by Pukkala et al. (Citation2010) must be compared with caution.
The maximized volume yield in our steady-state solution for Scots pine is approximately 3 m3 ha−1 a−1 at H100=24 (), whereas Pukkala et al. (Citation2010) obtained an annual yield of approximately 4.5 m3 ha−1. In the steady states maximizing annual net income, Pukkala et al. (Citation2010) have a higher number of trees per hectare. However, the trees are harvested at a considerably smaller size, resulting in lower basal areas, especially immediately after harvests.
The annual yield in Pukkala et al. (Citation2010) for Norway spruce is 5.3 m3 ha−1, approximately 1 m3 ha−1 less than in our results. The yield in our results consisted almost solely of saw logs, whereas in Pukkala et al. (Citation2010), the portion is only 64%. Even when maximizing saw log production, the harvested trees in Pukkala et al. (Citation2010) are smaller than in our volume yield maximization solutions (), resulting in a lower saw log yield. The reason for this lies in the differences between the economic model specifications and in the Weibull simplification in Pukkala et al. (Citation2010).
According to the “Investment Efficient” or IE model (Pukkala et al Citation2010), the problem is to find cuttings over the stand size structure in order to maximize “the Net Present Value of all future incomes and costs (also called Land Expectation Value)” defined as follows:
where NT is the net income obtained in cuttings after every T years, and CT is “the value of the initial investment.” The latter is the stumpage value of residual trees after each harvest and is interpreted in the IE setup as “an investment the forest owner must make if she wants to use uneven-sized management.” According to the argument, this makes the model resemble the Faustmann rotation model. To obtain results for the relative profitability of even- vs. uneven-aged management NPVT is compared to the present value net revenues from even-aged management.
To offer numerical results on how the outcome of the IE model (applied in various forms, e.g. in Buongiorno & Michie Citation1980; Bare & Opalach Citation1987; Buongiorno et al. Citation1995; Trasobares & Pukkala Citation2004; Liang et al. Citation2005; Pukkala et al. Citation2010; Buongiorno et al. Citation2012) deviates from the solution obtained by dynamic optimization, we compare the results in . These are based on the Bollandsås et al. (Citation2008) model and the on economic parameters of the study in hand. The IE solutions are computed by Equation (12) but without the Weibull simplification. The objective function values for the dynamic models (1)–(11) are computed assuming that the initial stand state is the state after harvests of the IE solution.
Table 6. Comparison of the dynamic optimization results for Norway spruce at H100 = 24 and the Investment Efficient (IE) model. Harvesting interval:15 years.
The results in show that the steady states of the dynamically computed solutions and the steady states obtained by the IE model differ and the sign and the relative magnitude of the deviation depend on interest rate. Additionally, the present values of future forest income levels, i.e. the values of the objective functions, become different.
We note that the IE model contains a number of problems. The term CT or “the value of the initial investment” is understood as an income that is lost, given the harvest is partial instead of being clear-cut. Such a term refers to opportunity cost, i.e. to revenues that could be obtained by following an alternative decision. When correctly computed, this type of term must be included in profitability comparisons of uneven- and even-aged management, but when searching the optimal uneven-aged solution such implicit cost should not play any role. Thus, the NPVT given by Equation (12) does not represent any real measure for the present value of net income from uneven-aged forestry nor the “Land Expectation Value.” Furthermore, applying Equation (12) may yield a correct solution to uneven-aged forestry only accidentally. The model is also very restrictive since it cannot describe optimal trajectories toward uneven-aged steady-state solutions from various given initial stand states.
In , the IE “investment cost” is €1289 and €948 for interest rates 3% and 5%, respectively. Thus, the present value of revenues determined by the IE setup (NPVT + CT in Equation 12) equal €4401 + €1289 = €5699 for r = 0.03 and €1710 + €948 = €2658 for r = 0.05. Both of these values are lower compared to values obtained by the dynamic setup, i.e. the IE setup does not produce the solution that maximizes the present value of revenues from uneven-aged forestry.
Compared to the dynamic optimization results based on Tahvonen (Citation2011), all our optimal steady-state attributes are higher. When maximizing net present value of forest revenues using a 3% interest rate at H100=24, the annual yield in our solution is approximately 1 m3 ha−1 higher, with a basal area approximately 7 m2 ha−1 higher. The size of harvested trees is larger, resulting in a higher saw log portion. In addition, the number of trees per hectare after harvests is approximately 250 trees higher in our results. When our results obtained with the single-tree model are compared to Tahvonen (Citation2011), the difference in annual yield becomes smaller. The average annual yield in our results is approximately equal, but basal area both before and after harvests is still higher. On average, the trees are harvested at a slightly larger size than in Tahvonen (Citation2011), as the stand is not harvested as heavily. This results in a 7 m2 ha−1 higher basal area and 300 trees more per hectare after harvests. These differences are mainly because the growth model by Pukkala et al. (Citation2009) is more sensitive to higher stand densities.
The single-tree model produces 13–24% lower yields compared with the model with the transition matrix simplification. This combined with the lower steady-state basal area implies that the transition matrix model overestimates the growth of trees, resulting in higher yields. As in the transition matrix model, a portion of trees is assumed to grow with the width of the size class (i.e. 50 mm) over a 5-year period, and the convexity of the volume development (Appendix) causes this simplification to result in an overestimation in volume increment. This is in line with similar comparisons discussed in Tahvonen (Citation2011). The serrated steady-state structure () is due to the 15-year harvesting interval and the associated variation of basal area and ingrowth. Basal area is low after each harvest, resulting in higher ingrowths. During subsequent periods, the stand density increases, decreasing ingrowth and resulting in smaller age classes.
As far as we know, no earlier studies optimizing the management of uneven-aged birch exist. The annual yield in our study is relatively low, but all optimal steady-state solutions remain well within the range of original empirical data presented in Bollandsås et al. (Citation2008). Unlike with Scots pine, the low yield is not due to low ingrowth but to a low growth rate, especially at size classes below 20 cm.
Conclusions
The model by Bollandsås et al. (Citation2008), integrated with optimization, produces a rather coherent picture of the economics of uneven-aged forestry. Specific results of optimizing Scots pine and birch management are difficult to compare with earlier studies due to, e.g. different optimization methods and growth models used. Compared to earlier studies on uneven-aged Norway spruce stands, our optimal steady states tend to have more trees per hectare and higher basal areas, while annual yields are relatively similar. The differences in results are mainly due to differences in growth models, with the model by Bollandsås et al. (Citation2008) being less sensitive to higher basal areas. Regardless, in all cases, the optimal steady-state solutions are well within the empirical data presented in Bollandsås et al. (Citation2008).
Bollandsås et al. (Citation2008) use the transition matrix simplification in their simulations, but our results indicate that the differences between model types may not be minor. This is in line with previous discussion that maintaining the inverted-J structure may be an oversimplification in uneven-aged stands (Puettmann et al. Citation2009; Tahvonen Citation2011). Noting the differences between the models is important, as almost all economic studies rely on transition matrix models.
As discussed earlier, the optimization results can be heavily influenced by the growth model used. Hence, economic studies on uneven-aged management would benefit from further development of growth and yield models. Analyses should also be extended to optimize not only harvests’ intensity but also harvesting interval, which in earlier studies (excluding Wikström Citation2000) on uneven-aged forest management have only been set to a fixed interval. The question of optimizing harvests from multiple-species stands applying dynamic framework in Nordic conditions additionally remains more or less open.
Acknowledgments
We thank the Sustainable Energy and the Ficca Programs of the Academy of Finland and the Maj and Tor Nessling Foundation for financial support.
References
- Adams DM, Ek AR. 1974. Optimizing the management of uneven-aged forest stands. Can J For Res. 4:274–287. 10.1139/x74-041
- Ahti T, Hämet-Ahti L, Jalas J. 1968. Vegetation zones and their sections in northwestern Europe. Ann Bot Fenn. 5:169–221.
- Andreassen K, Øyen B-H. 2002. Economic consequences of three silvicultural methods in uneven-aged mature coastal spruce forests of central Norway. Forestry. 75:483–488. 10.1093/forestry/75.4.483
- Andreassen K, Øyen B-H. 2011. Comparison of selected Nordic stand growth models for Norway spruce, Scots pine and birch. Forestry Studies | Metsanduslikud Uurimused. 55:46–59.
- Assmann E. 1970. The principles of forest yield study. Oxford: Pergamon Press; 506 p.
- Bare BB, Opalach D. 1987. Optimizing species composition in uneven-aged forest stands. For Sci. 33:958–970.
- Bollandsås OM, Buongiorno J, Gobakken T. 2008. Predicting the growth of stands of trees of mixed species and size: a matrix model for Norway. Scand J For Res. 23:167–178.
- Buongiorno J, Michie BR. 1980. A matrix model of uneven-aged forest management. For Sci. 26:609–625.
- Buongiorno J, Peyron J-L, Houllier F, Bruciamacchie M. 1995. Growth and management of mixed-species, uneven-aged forest in the French Jura: implications for economic returns and tree diversity. For Sci. 41:397–429.
- Buongiorno J, Halvorsen EA, Bollandsås OM, Gobakken T, Hofstad O. 2012. Optimizing management regimes for carbon storage and other benefits in uneven-aged stands dominated by Norway spruce, with a derivation of the economic supply of carbon storage. Scand J For Res. 27:460–473. 10.1080/02827581.2012.657671
- Byrd RH, Hribar ME, Nocedal J. 1999. An interior point algorithm for large-scale nonlinear programming. SIAM J Optim. 9:877–900. 10.1137/S1052623497325107
- Byrd RH, Nocedal J, Waltz RA. 2006. KNITRO: an integrated package for nonlinear optimization. In: di Pillo G, Roma M, editors. Large-scale nonlinear optimization. New York: Springer; p. 35–59.
- De Liocourt F. 1898. De L’aménagement des sapinieres [The management of Silver fir forests]. Bull Soc Franche-Comté et Belfort. 396–409.
- Forest Statistics Information Service. 2012. MetInfo. Vantaa: Finnish Forest Research Institute. Available from: http://tilastot.metla.fi/
- Getz WM, Haight RG. 1989. Population harvesting: demographic models for fish, forest and animal resources. Princeton (NJ): Princeton University Press.
- Haight RG. 1985. Comparison of dynamic and static economic models of uneven-aged stand management. For Sci. 31:957–974.
- Haight RG. 1987. Evaluating the efficiency of even-aged and uneven-aged stand management. For Sci. 33:116–134.
- Haight RG, Monserud RA. 1990. Optimizing any-aged management of mixed-species stands. II: effects of decision criteria. For Sci. 36:125–144.
- Heinonen J. 1994. Koealojen puu- ja puustotunnusten laskentaohjelma KPL. Käyttöohje [Software for computing tree and stand characteristics for sample plots. User's manual]. Reseach Reports. Vantaa: Finnish Forest Research Institute; 504 p. Finnish.
- Kolström T. 1993. Modeling the development of an uneven-aged stand of Picea abies. Scand J For Res. 8:373–383.
- Kumela H, Hänninen H. 2011. Metsänomistajien näkemykset metsänkäsittelymenetelmien monipuolistamisesta [Forest owner views on diversifying silvicultural methods]. Vantaa: Working Papers of the Finnish Forest Research Institute; 203 p. Finnish.
- Liang J, Buongiorno J, Monserud RA. 2005. Estimation and application of a growth and yield model for uneven-aged mixed conifer stands in California. Int For Rev. 7:101–112.
- Lundmark H, Josefsson T, Östlund L. 2013. The history of clear-cutting in northern Sweden – driving forces and myths in boreal silviculture. For Ecol Manage. 307:112–122.
- Nieminen T, Korpunen H, Uusitalo J. 2006. Time consumption analysis of the mechanized cut-to-length harvesting system. Silva Fennica 40:335–363.
- Puettmann KJ, Coates KD, Messier C. 2009. A critique of silviculture: managing for complexity. Washington (DC): Island Press.
- Pukkala T, Lähde E, Laiho O. 2009. Growth and yield models for uneven-sized forest stands in Finland. For Ecol Manage. 258:207–216.
- Pukkala T, Lähde E, Laiho O. 2010. Optimizing the structure and management of uneven-sized stands of Finland. Forestry. 83:129–142. 10.1093/forestry/cpp037
- Siiskonen H. 2007. The conflict between traditional and scientific forest management in the 20th century Finland. For Ecol Manage. 249:125–133. 10.1016/j.foreco.2007.03.018
- Tahvonen O. 2011. Optimal structure and development of uneven-aged Norway spruce forests. Can J For Res. 41:2389–2402. 10.1139/x11-130
- Tahvonen O, 2009. Optimal choice between even-and uneven-aged forestry. Nat Resour Model. 22:289–321. 10.1111/j.1939-7445.2008.00037.x
- Tahvonen O, Pukkala T, Laiho O, Lähde E, Niinimäki S. 2010. Optimal management of uneven-aged Norway spruce stands. For Ecol Manage. 260:106–115.
- Tahvonen O, Pihlainen S, Niinimäki S. 2013. On the economics of optimal timber production in boreal Scots pine stands. Can J For Res. 43:719–730. 10.1139/cjfr-2012-0494
- Tahvonen O, Viitala E-J. 2006. Does Faustmann rotation apply regulated forest. Forest Sci. 52:23–30.
- Trasobares A, Pukkala T. 2004. Optimising the management of uneven-aged Pinus sylvestris L. and Pinus nigra Arn. mixed stands in Catalonia, north-east Spain. Ann For Sci. 61:747–758. 10.1051/forest:2004071
- Usher MB. 1966. A matrix approach to the management of renewable resources, with special reference to selection forests. J Appl Ecol. 3:355–367. 10.2307/2401258
- Vuokila Y, Väliaho H. 1980. Viljeltyjen havumetsiköiden kasvatusmallit [Growth and yield models for conifer cultures in Finland]. Commun Inst For Fenn. 99:1–271.
- Wikström P. 2000. A solution method for uneven-aged management applied to norway spruce. For Sci. 46:452–463.