
ABSTRACT
The effectiveness of generating virtual transects on unmanned aerial vehicle-derived orthomosaics was evaluated in estimating the extent of soil disturbance by severity class. Combinations of 4 transect lengths (5–50 m) and five sampling intensities (1–20 transects per ha) were used in assessing traffic intensity and the severity of soil disturbance on six post-harvest, cut-to-length (CTL) clearfell sites. In total, 15% of the 33 ha studied showed some trace of vehicle traffic. Of this, 63% of was categorized as light (no visible surface disturbance). Traffic intensity varied from 787 to 1256 m ha−1, with a weighted mean of 956 m ha−1, approximately twice the geometrical minimum achievable with CTL technology under perfect conditions. An overall weighted mean of 4.7% of the total site area was compromised by severe rutting. A high sampling intensity, increasing with decreasing incidence of soil disturbance, is required if mean estimation error is to be kept below 20%. The paper presents a methodology that can be generally applied in forest management or in similar land-use evaluations.
Introduction
Soil disturbance is an unavoidable consequence of timber harvesting but the severity of its impact is variable, and can be managed through good planning and operations (Ares et al. Citation2005). Soil compaction and wheel rutting can be detrimental to forest ecosystems for reasons including the physical, physiological and pathogenic consequences to residual trees (Wästerlund Citation1994; Quesnel and Curran Citation2000; Sirén et al. Citation2013) caused by damage to the roots, and the effects of reduction in hydraulic conductivity and gaseous exchange capacity (Startsev and McNabb Citation2009). On slopes, soil disturbance can lead to channelling where erosional energy increases with the length of the rut (Startsev and McNabb Citation2000). Ruts can also impede passage to fauna or recreational users of the forest and are widely considered to have a strongly negative aesthetic impact (Gundersen and Frivold Citation2008). Newer technologies are being applied in addressing wheel rutting; Jönsson and Lagergren (Citation2017) describe the latest approaches in seasonal forecasting in supporting operational planning, while Karlsson et al. (Citation2004) show how such data, together with machine specifications, can be used for effective decision support. Also, the advent of large scale LiDAR surveys has provided a basis for detailed decision support to machine operators in the form of soil moisture prediction such as the topographic wetness index and depth to water mapping, effectively identifying areas to avoid or take special regard of (Seibert et al. Citation2007; Murphy et al. Citation2011; Campbell et al. Citation2013; Ågren et al. Citation2014), potentially at a day-to-day level (Jones and Arp Citation2017).
However, there has been a tendency to focus soil disturbance research on determining causes and effects to a greater degree than determining their extent at a spatial scale (Cambi et al. Citation2015). Further, a good deal of the work that has included an assessment of the spatial extent of vehicle impact is related to whole tree harvesting systems, while it is the cut-to-length (CTL) system (harvester/forwarder) that is rapidly expanding internationally. Processing in the stand means branches and tops are available for creating a protective brush mat which has been shown to have a positive effect on reducing compaction and rutting (Eliasson and Wästerlund Citation2007; Labelle and Jaeger Citation2012). However, rationalization in forestry has led to the maximization of payloads during timber extraction (Tiernan et al. Citation2004), with the largest forwarders today having gross vehicle weights of around 40 Mg (Nordfjell et al. Citation2010), while little is known of the extent of on-site traffic under real operational conditions.
Irrespective of the causes of soil disturbance and the efforts made to reduce these, reliable quantitative approaches for estimating the extent and severity of the problem are required if the problem is to be managed (McDonald et al. Citation2002). The literature illustrates that a wide variety of sampling designs have been used to estimate soil disturbance after harvest. For example, McMahon (Citation1995) evaluated the 4 ha nearest the landing to estimate disturbance on a 26 ha site. Reeves et al. (Citation2012) walked line transects from stand boundary to boundary, perpendicular to skid trails. McNeel and Ballard (Citation1992) laid out transects 4 m in width, at 20 m intervals across the entire stand, while Lanford and Stokes (Citation1995) used a two-tier system, sampling disturbance perpendicularly to selected trails at 25 ft. (7.6 m) intervals, then systematically sampling stand-wise disturbance by installing 3 parallel lines across the site and evaluating conditions every 40 ft. (12 m) along these lines. Han et al. (Citation2009) measured soil disturbance at GNSS points every 15 m along the centreline of all visible trails. The latter approach is similar to the method described by Pohjankukka et al. (Citation2016) and Friberg and Bergkvist (Citation2016) who also use GNSS to evaluate trails, and provided a relative measure of disturbance in relation to total trail length. Affek et al. (Citation2017) made an effort to assess logging trails on a wide scale using aerial borne LiDAR (ALS), and compared these with the GNSS centrelines obtained from a ground survey. While the above cited literature illustrates several examples of systematic sampling designs for soil disturbance after harvest, extensive field-based soil disturbance monitoring is labour intensive and cost prohibitive (Reeves et al. Citation2012). Also, while systematic sampling is appealing from a perspective of implementation in the field, using non-random sampling approaches for a phenomenon that follows a systematic pattern (more traffic close to landings and to parallel trails to a large extent) risks providing strongly biased estimates.
To estimate the amount of soil disturbance after harvesting, we propose the utilization of unmanned aerial vehicle (UAV)-derived orthomosaics in conjunction with desktop-based line interception sampling. UAV imagery is a relatively low cost and easily accessible data source that can be captured by forest managers in the course of their daily duties (Torresan et al. Citation2016). Orthomosaics can be developed using commercial image processing software or freeware (Pierzchała et al. Citation2014), and display a high degree of precision (Harwin and Lucieer Citation2012). However, the application of UAVs in making assessments related to forest operations is relatively new and there is a recognized need for developing methods in doing so (Talbot et al. Citation2017a). The line interception method on the other hand, was developed by Canfield in the 1940s to estimate vegetation cover in grasslands (Canfield Citation1941). Today, the use of line intercept sampling is widespread in forestry, especially with focus on coarse woody biomass (Hély et al. Citation2000).
The aim of this work was to (i) contribute to the limited knowledge base on the actual extent of CTL machine traffic on a forest site, and (ii) to develop a robust method for categorizing both the severity and extent of wheel tracks in the stand after harvesting, through the combination of UAV-based orthomosaics and a desktop line intersect sampling procedure.
Materials and Methods
Sites
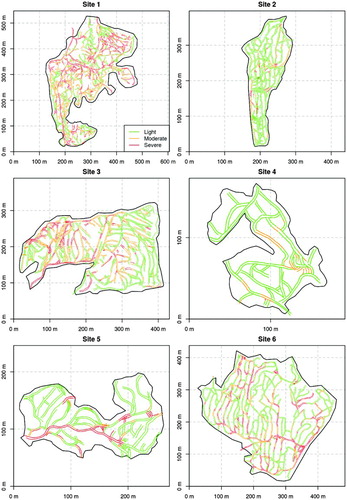
Six clear-fell sites harvested with the CTL system in the south eastern part of Norway were used in the study (). The sites were not selected on the basis of any criteria other than some variation in conditions was sought and that harvesting had been carried out within 3 months of the study. The sites were flown and imaged from an UAV, a rectified high resolution orthomosaic was produced and machine traffic evaluated as per the descriptions below.
Table 1. Description of three categories used to characterize the condition of the trail/ extent of the damage.
Image capturing
A DJI Phantom 2 UAV fitted with a GoPro Hero 4 Silver camera was used in capturing aerial images on five of the six sites, while for site 3, a DJI Phantom 4 fitted with DJIs own camera was used. Both cameras use a 1/2.3 inch sensor with a maximum image size of 4000 × 3000 pixels, a 94 degree field of view, and f-stop of 2.8. The image capturing process involved laying out 6–10 fixed ground control points (GCPs) using a Topcon GR5 DGNSS. The GCPs allow for the camera poses to be accurately estimated and for the model to be correctly geo-referenced and scaled. Flight paths were predetermined and flown using DJI Groundstation software for the Phantom 2 and Autopilot from Autoflight Logic for the Phantom 4 as both facilitate waypoint flying. Flight altitudes were between 30 and 40 m above take-off point.
Image processing
All images were processed in Agisoft Photoscan (Agisoft Citation2016) which takes a series of images as an input and estimates camera intrinsic and extrinsic parameters. The software allows camera pose optimization (position and orientation) to be carried out on the basis of GCPs. We output one rectified orthomosaic in GeoTiff format for each site. The resolution of the orthomosaics was high, with pixel sizes of between 1 and 2 cm providing a detailed backdrop on which to make the assessment.
Traffic assessment
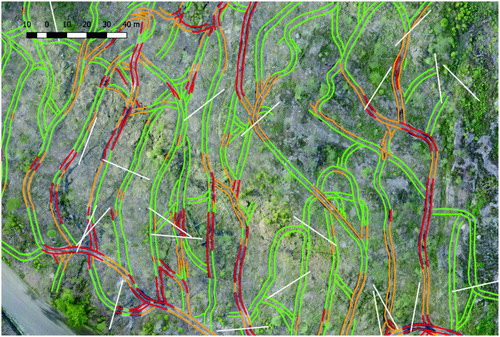
All evidence of vehicle traffic was manually traced as polylines against the orthomosaic from each stand in a GIS (QGIS Citation2017) environment, similar to the procedure described by Affek et al. (Citation2017). Wheel tracks on either side of the machine were assessed visually, traced, and assigned to the categories Light, Moderate and Severe (). In cases where there were multiple parallel or intersecting tracks, a new track was traced when the lateral distance between track centrelines exceeded an assumed wheel track width of 800 mm. The 800 mm buffered track included a marginal allowance for steel tracks and off-tracking between the front and rear wheels, on the assumption that the most common 710 mm width tyres had been used. This ensured that the total area trafficked on the site, including at intersections, was fully represented in the statistics for each template. The polyline segment lengths and areas were summed and the percentage representation calculated for each disturbance category per hectare. These traced polylines were then considered as the true representation of machine traffic against which evaluations could be made using virtual desktop transects.
As the severity of impact differs on each side of a machine, a distinction was made between a wheel track (one side of the machine) and a machine trail (including both wheel tracks). The machine trail length was simply determined by halving the lengths of the measured wheel tracks, and therefore only approximated a given distance of disturbance. A single wheel track was assumed to be 800 mm wide, while a machine trail was assumed to have a width of 3200 mm measured from the outside edge of the tires on either side.
The orthomosaics were also used in determining the area and perimeter of the actual harvested site (). Convexity, calculated as the ratio of the area of the stand polygon to that of the area of a convex hull encompassing its extremities, and the isoperimetric ratio, calculated as the ratio of the area of the stand to the area of a circle having the same perimeter, and perimeter alone, were used as indices of stand shape (Machl et al. Citation2013). A simple regression was carried out to determine whether stand size and shape indices could be used to predict the extent of moderate and severe disturbance on the site.
Table 2. Summary statistics for the wheel tracks and machine trails per site.
Desktop line intercept sampling
Estimation of wheel rutting by severity class is a similar problem to that of vegetation cover by species for which the line intercept method was developed (Canfield Citation1941). To follow this method, a number of transects are established across the site and each transect is considered a sampling unit. The extent of cover is estimated by summing intercept lengths and expressing this total as a proportion of transect length, as demonstrated in a similar setting by McNeel and Ballard (Citation1992). In line intercept sampling the percentage cover of soil disturbance in a given severity category can be estimated using Equation (1) and the variance of the estimate can be estimated with Equation (2).
Where n is the number of transects, xi is the observed length of intersects with the soil damage in a given transect i, and li is the length of transect i. is the mean cover in all the sampled transects.
The conceptual idea behind desktop line intercept sampling is a simple three-step procedure: First, one automatically generates a number of randomly located transects (of a given length) with origin within the stand boundaries using software that handles spatial dimensions (e.g. GIS). Following standard practices for line intercept sampling (Gregoire and Monkevich Citation1994), transects that cross the stand boundary are folded back on top of themselves and any soil disturbance in the fold-back area of the transect is double counted. Secondly, the transects are overlayed onto the UAV-based orthomosaics and the length of intersected soil disturbance along each transect is measured using GIS software. Finally, the soil disturbance by cover class is estimated using Equations (1) and (2).
Effect of sampling intensity estimated error of the soil disturbance estimate
To evaluate how different sampling intensities influence the sampling error associated with the soil disturbance estimate, a simulation of different sampling intensities both in terms of the number of transects and the length of transects was carried out. The simulations illustrate how sampling intensity influences the sampling error for both desktop line intercept sampling as well as for field-based line intercept sampling.
The simulation was carried out by generating different sampling intensities for the six stand traffic templates. Transect sampling intensities were varied across five classes (1, 2, 5, 10 and 20 transects per ha), while transect lengths were simulated in four classes (5, 10, 25 and 50 m per transect). For each combination of transect sampling intensity and transect length, 100 replications were simulated on each stand. The prevalence of wheel tracks was estimated based on the proportion of overlap of a transect on the wheel track in the orthomosaic, and classified by the given severity class (). The process was repeated for each combination of sampling intensity and transect length per site, and the distributions of the wheel rut estimates were recorded. Error was calculated as the difference between the estimate and the observed distance. This analysis was conducted in R (Team Citation2017) using the sf package for spatial operations (Pebesma Citation2017).
Figure 1. An example showing a section of the orthomosaic from site 6, overlayed with the 800 mm buffered wheel track tracelines (green = Light, orange = Moderate, red = Severe), as well as the automatically generated transects (white).
Results
Extent of soil disturbance after CTL harvesting
The full census of tracks in the six stands provides an insight into the amount of soil disturbance and machine tracks within a stand after the CTL harvesting operations observed. Results are presented both per wheel track (single line) and per machine trail (includes wheel tracks on both sides of the machine). Traffic intensity varied from 787 (site 6) to 1256 m ha−1 (site 2) with a weighted mean of 956 m ha−1 on the six stands (). Of this, 63% was classified as Light on average, while the categories Moderate and Severe had an area weighted share of approximately 21% and 16% respectively (). The incidence of moderate and severe rutting ranged from 14% (site 4) to 69% (site 1) of the total trail length on site, in absolute numbers some 235–1430 m ha−1. This equated to 118 m ha−1 and 715 m ha−1 of machine trail respectively. On the assumption that the entire area beneath the machine measured from the outer edges of the wheel on either side is compromised in the instance of moderate to severe rutting, 4% of the site area in the best case, and 23% of the area in the worst case could be categorized as being so.
Figure 2. Overview of the stand shape and traffic intensity as categorized on the six sites (green = Light, orange = Moderate, red = Severe). Note that the spatial extent differs between sites, as indicated in the x- and y-axes.
The area of soil driven on by wheels (i.e. area of wheel tracks) varied from 1260 (site 6) to 2010 m2 ha−1 (site 2) or 12.6% to 20.1% of the site, assuming a wheel track width of 800 mm, while the areas that experienced actual soil disturbance (moderate and severe) range from 188 (1.9%) to 1144 m2 ha−1 or 11.4% of the site ().
When considering the whole area under the machine (machine trail area covered), this ranged from representing 376 m2 ha−1 or 4% (site 4) to 2288 m2 ha−1 or 23% of the site (site1). This is reported for a combination of moderate and severe trails only as it is assumed that for the category Light, the area between the wheels remains accessible to plant roots and conducive to growth.
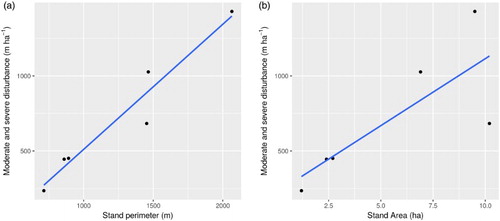
Simple geometrical variables provided coefficients of determination (R2) of 0.62 for stand size and 0.93 for stand perimeter in univariate regressions estimating the extent of moderate and severe disturbance based on pooled data from all six sites (). The more complex variables convexity (R2 0.03) and isoperimetric ratio (R2 0.04), which combine size and shape, showed no relationship. In multivariate regression models convexity and isoperimetric ratio as well as their interactions with other shape variables improved the model fits.
Figure 3. Moderate and severe disturbance plotted against stand area (left) and stand perimeter (right) with linear regression lines.
Estimating the extent of soil disturbance with desktop line intercept sampling
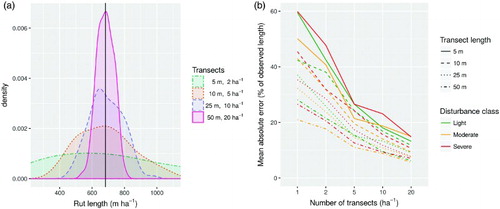
As expected the desktop sampling provides unbiased estimates of the track lengths in the combined category of moderate and severe disturbance (). The simulation of sampling intensities illustrates that a considerable sampling intensity is required in order to reduce the sampling error to a reasonable level ().
Figure 4. Estimated vs. observed length of wheel track (m ha−1) in the combined disturbance classes Moderate and Severe, for each of the six sites (symbol), and by increasing transect length (5,10, 25 and 50 m, columns) and transect intensities (1, 2, 5, 10 and 20 transects per ha, rows). Bars show 1 standard deviation.
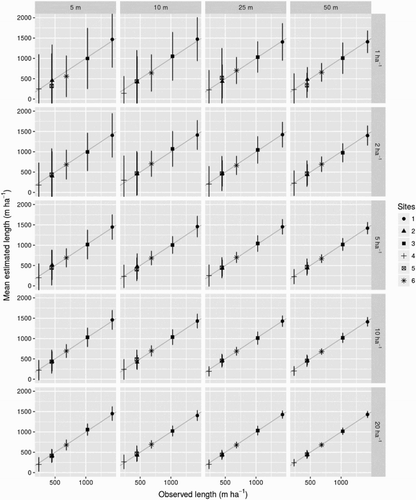
The error obtained at a given sampling intensity varies considerably between sites. The two largest sites (site 1 at 9.5 ha and site 6 at 10.2 ha) show the lowest mean absolute error. However, for site 1, mean error is almost equal for each of the severity categories, while for site 6, the error estimate for category light is consistently lower than the others, for a given transect length. The smaller sites (site 2, site 4 and site 5) have the lowest occurrence of moderate or severe disturbance () and exhibit far larger mean error for these poorly represented categories. The error estimate for categories Moderate and Severe for site 4 are especially uncertain which is due to the fact that the site only has 2 m of category severe per ha.
The effect of sampling intensity on the error estimates is further illustrated with examples from site 1 and 6 given in . The distribution of estimates for site 1 (left) illustrates how the variability in estimates reduces with increasing sampling intensities. (right) shows the decrease in mean error with increasing number of transects on site 6, where error is reduced from 20% to 7% for the Moderate category and from 60% to 17% for the Severe category.
Figure 5. Effect of sampling intensity on the variability of the estimated rut length and error of the estimates. The left pane illustrates the distribution of estimates obtained under the different sampling intensities for site 1. The right pane illustrates the overall reduction in mean absolute error (in percentage) for the three severity categories, by number of transects, for site 6.
Discussion
The aim of this work was to evaluate the utility of a method that could easily be adopted into everyday forest management routines. UAV-derived orthomosaics appear to provide high resolution and accurate records of site disturbance during harvesting, despite potential local limitations in detection from harvesting slash or retention trees. Manually tracing and categorizing vehicle traffic on the basis of orthomosaics provides a more comprehensive record of site disturbance with lower resource inputs than previously described methods.
Traffic extent was found to vary from 787 (site 6) to 1034 m ha−1 (site 1) where even the lower value substantially exceeds the theoretical minimum of 500 m ha−1, and the 532–561 m ha−1 found by Han et al. (Citation2009). Two of the six stands analysed showed intensities exceeding 1000 m ha−1 which can be considered high, although for the highest one (site 2), 82% of trails were categorized as only having light disturbance. These results equate to wheel-track areas of between 13% and 20% of the site (assuming a tire width of 800 mm), with an area weighted mean of 15.3%. Machine trail area covered between 4% and 23% of the site, with an area weighted mean of 11%. Bettinger et al. (Citation1994) found, for example, that the CTL system they studied resulted in logging trails on 23.5% of the site, Han et al. (Citation2009) found a trail area covering 19–20% of the site, while Eliasson (Citation2005) estimated this to be around 12.5% and Cudzik et al. (Citation2017) arrived at a figure of 9.5% of the site. The latter case was in a late thinning, which restricts the options for driving on multiple tracks and is not directly comparable.
The high extent of driving on Site 2, although with 85% of the trails being classified as light, opens an interesting discussion on whether to assign traffic to designated extraction trails or not. Williamson and Neilsen (Citation2000) suggest that this decision should be made on a stand-by-stand basis, depending on the amount of soil damage, compaction or disturbance incurred after the first few passes. Uusitalo et al. (Citation2015) also recommended wider logging trails with fewer duplicate passes on the same wheel tracks for peat soils. However, the notion of spreading the trails over wider areas is strongly refuted by, for example, Vossbrink and Horn (Citation2004) and Horn et al. (Citation2007), and forest certification bodies typically advocate the use of fixed and permanent skid trails.
Relationship between stand size, shape and soil damage
Stand perimeter incorporates both stand size and convexity and showed a strong relationship to combined moderate and severe disturbance, while the more complex variables convexity and isoperimetric ratio alone only explained a marginal part of the variation. However, due to the small number of stands the values of the goodness of fit of the linear regression models should be used with some caution. From an operational point of view it is generally known that stand size and shape influence the driving pattern and number of passes in a given track, and influences the ability to plan the operations. The number of machine passes is an important factor in soil compaction or rut formation (Eliasson Citation2005; Sakai et al. Citation2008) and is directly related to these factors. In this study, five of the six sites were on flat terrain, and the influence of slope or other factors on the driving pattern was not considered.
Implications for field-based sampling for soil disturbance
As expected, the transect sampling simulation illustrated that the mean error decreases with increasing sampling intensity. Based on the simulation results presented in and , it seems that at least five transects per ha of 25 m in length are advisable in reducing mean absolute error to under 20%.
Extensive field-based evaluation of soil disturbance is labour intensive (Reeves et al. Citation2012). Prior to GPS becoming widely available, Bettinger et al. (Citation1994) had multiple people follow and map machine movements on a single site for 4 days, and McMahon (Citation1995) made a field evaluation of 40,000 points on a 1 × 1 m grid. Even using a GNSS, the results shown by Friberg and Bergkvist (Citation2016) required the mapping of some 360 km of trails on foot. In practice however, most operational mappings of soil disturbance in a post-harvest sense would apply a far lower sampling intensity, often with only two or three transects. However, the simulation performed in this study illustrates that a very high sampling intensity is required in order to obtain soil disturbance estimates with high precision.
The layout of skidder trails (tree formed) and forwarding trails (parallel) can be expected to vary considerably within a stand and the selection of only part of a stand for reducing workload can be expected to influence the obtained estimates. Stand shape, topography, larger obstacles, or the existence of two or more landings, would influence results in different ways, depending on sampling method. McMahon (Citation1995) showed that rigid sampling grids resulted in less consistent estimates of disturbances which were systematically orientated, parallel to the extraction direction, confirming the need for randomized sampling approach.
Desktop line intersect sampling as a method for soil disturbance estimation
In this paper we proposed desktop intercept sampling as a simple three-step procedure: First, in a GIS software one automatically generates a number of randomly located transects (of a given length) with origin within the stand boundaries. Secondly, the transects are overlayed on the UAV-based orthomosaic and the length of intersected soil disturbance within each transect is measured within the GIS software. Finally, the soil disturbance by severity class is estimated using Equations (1) and (2).
The main advantages of the suggested approach are that it requires only a low-cost UAV and that the analysis can also be done using open source software (Pierzchała et al. Citation2016). Further, the method is simple and rapid to implement. The relatively rapid desktop procedure allows for high sampling intensity hence opening the possibility for obtaining relatively low cost estimates with high precision.
Alternatively to the line intercept sampling, a full outline of all tracks can be made from the orthomosaic. However, the manual tracing of all machine trails against the orthomosaic is a laborious task, but was necessary in establishing the ground-truth for the sampling simulation in this study. For smaller stands, or stands with very little moderate or severe disturbance, estimation error might be reduced by making a full measurement of the poorly represented categories in a GIS environment while generating transects in estimating only the most predominant category.
We applied a visual, subjective method of categorizing soil disturbance to three classes; Light, Moderate and Severe. This risks introducing subjectivity with different levels of severity occurring between sites, but visual evaluation cannot be avoided as no automated detection methods accurate enough in identifying all disturbance are currently known. As Reeves et al. (Citation2012) state, regardless of the source of visual (qualitative) monitoring systems, they include recognition that severity classes are necessary within a disturbance classification system. Pohjankukka et al. (Citation2016) also used a three-level categorization system of no damage, slight damage and damage. McMahon (Citation1995) applied a system consisting of 15 conditions in the field, structured in a hierarchy summarizing to three classes (undisturbed and shallow disturbance, deep disturbance, and compaction), while Ares et al. (Citation2005) categorized disturbance seen in their study according to five conditions. A broader application of the method described in the present paper would likely benefit from a standardized and absolute classification of severity. Ultimately, it could reflect tolerance thresholds of either management, ecological, or economic importance.
The use of UAVs is new but rapidly becoming commonplace in forest management (Torresan et al. Citation2016), although the use of aerial photography in assessing harvesting related soil disturbance was demonstrated decades ago (Firth et al. Citation1984). While the benefits of aerial photography over ground surveying were recognized, the lower resolution images presented difficulties in identifying less severe disturbance, or disturbance on sites without distinct colour differences between surface and subsoils (McMahon Citation1995). The benefits of using modern UAVs in providing these orthomosaics today include the extremely high resolution (1–2 cm / pixel) of the images given by the low flying altitude (around 40 m above ground level) and especially the fact that flight intervals are not restricted to national aerial imaging campaigns, but can be done immediately after harvesting. While they do handle relatively high windspeeds, UAVs are susceptible to rain and snow, and the camera outputs are somewhat dependent on light conditions, especially strong contrasts.
The laying out of GCPs was necessary in ensuring a high precision model with accurate scaling for the basis of this study. However, this laborious task can be omitted in practice, as an orthomosaic geo-referenced solely on GNSS data stored in the image EXIF file generally does provide sufficient accuracy for assessing trail length and severity of rutting (Talbot et al. Citation2017b). In instances where harvesting slash is present in the rut, the interpreted surface can differ from the actual terrain surface, as photogrammetry provides only surface models (Pierzchała et al. Citation2016). The presence of brash mats in some areas was not considered to have serious consequences on the results of the present study as the image resolution was high enough to allow the assessor to make a detailed evaluation on the condition of the mat, and that person had also been present in the field. Nonetheless, in some cases it might be difficult to assess how much damage the brash mat is obscuring, and this is a shortcoming of image-based analysis.
To provide accurate output, relatively good visibility of the ground surface from the air is required. In Scandinavia, a sparse form of retention forestry is generally practiced in the final cut (Simonsson et al. Citation2015). Retention trees did not prove problematic on the six sites we studied, partly as they were mostly deciduous (Betula spp.) and imaged in winter months, but the method would have limitations in denser continuous cover forestry as practiced in parts of central Europe. ALS does offer an alternative source for evaluation although Affek et al. (Citation2017) did not have the resolution to detect damage at the level demonstrated here. On the other hand, Giannetti et al. (Citation2017) demonstrated a portable laser scanner (PLS) which provided a high resolution model (1 cm) useful for specific rutting assessments, but would be time demanding at site level. An advantage of using a PLS is that data can be more easily collected below canopy. High density UAV-based ALS technology could combine the positive attributes of laser scanners with the site level approach, but these are not yet economically feasible at a management level. Also, the temporal scale of national LiDAR campaigns is too long for the intended management applications (Talbot et al. Citation2017a).
Further potential development in mapping of soil disturbance
Given that the orthomosaic construction process also outputs a highly detailed point cloud, it is conceivable that moderate and severe disturbance could be automatically detected using algorithms similar to those used by, for example, Beck et al. (Citation2015) in extracting forest road geometry.
The number of machine passes is an important factor in soil compaction or rut formation (Eliasson Citation2005) and although not directly relevant for the purposes of this study, it might have been included in severity estimates, as done by Bettinger et al. (Citation1994) and McDonald et al. (Citation2002), as modern forwarders do continuously log GNSS data (Manner et al. Citation2013). Augmenting the post-harvest orthomosaic with such traffic frequency data would provide more comprehensive documentation on site disturbance, especially in relation to determining the efficacy of terrain trafficability mapping, for which, for example, Niemi et al. (Citation2017) manually logged 13 km of trails. However, using GNSS data in determining number of passes would require more structured driving patterns than those seen on sites 1, 2 and 3, or the use of high precision RTK-GNSS on the forwarder, as the accuracy of standard GNSS receivers would typically be too low to distinguish between number of passes on close lying tracks.
In addition to the quantitative data on wheel tracks, the mapping method presented in this work can be used (i) as a pedagogical tool in training new forwarder operators or improving the performance of existing operators, (ii) in planning regeneration and identifying areas requiring amelioration, (iii) in evaluating the accuracy of bearing capacity maps and predictions on terrain trafficability, and (iv) in providing a basis for longer term vegetation mapping and studying the effect of machine trails on tree growth.
The development of methods and procedures for correctly utilizing the new source of information provided from UAVs, or indeed from portable scanners (Giannetti et al. Citation2017) is considered timely and needed. However, the method shown here is not mature, and a more efficient solution might include an automatic rut detection procedure, either through pattern recognition or 3D point-cloud analysis. This would significantly reduce the workload and improve the applicability of the stand level assessments shown in this paper.
Acknowledgements
The authors wish to acknowledge the voluntary assistance of Kärt Kängsepp for the many weekends spent in fieldwork, and Kea Permin Talbot for assistance with digitizing tracks on some of the sites.
Disclosure statement
No potential conflict of interest was reported by the authors.
ORCID
Bruce Talbot http://orcid.org/0000-0003-1935-5429
Additional information
Funding
References
- Affek AN, Zachwatowicz M, Sosnowska A, Gerlée A, Kiszka K. 2017. Impacts of modern mechanised skidding on the natural and cultural heritage of the Polish Carpathian Mountains. For Ecol Manage. 405:391–403. doi: 10.1016/j.foreco.2017.09.047
- Agisoft. 2016. Agisoft Photoscan Professional Version. Version 1.2.6 build.
- Ares A, Terry TA, Miller RE, Anderson HW, Flaming BL. 2005. Ground-based forest harvesting effects on soil physical properties and douglas-fir growth. Soil Sci Soc Am J. 69(6):1822–1832. doi: 10.2136/sssaj2004.0331
- Ågren A, Lidberg W, Strömgren M, Ogilvie J, Arp P. 2014. Evaluating digital terrain indices for soil wetness mapping – a Swedish case study. Hydrol Earth Syst Sci. 18(9):3623–3634. doi: 10.5194/hess-18-3623-2014
- Beck SJC, Olsen MJ, Sessions J, Wing MG. 2015. Automated extraction of forest road network geometry from aerial LiDAR. Eur J For Eng. 1(1):21–33.
- Bettinger P, Armlovich D, Kellogg LD. 1994. Evaluating area in logging trails with a geographic information system. Trans ASAE. 37(4):1327–1330. doi: 10.13031/2013.28214
- Cambi M, Certini G, Neri F, Marchi E. 2015. The impact of heavy traffic on forest soils: a review. For Ecol Manage. 338:124–138. doi: 10.1016/j.foreco.2014.11.022
- Campbell DMH, White B, Arp PA. 2013. Modeling and mapping soil resistance to penetration and rutting using LiDAR-derived digital elevation data. J Soil Water Conserv. 68(6):460–473. doi: 10.2489/jswc.68.6.460
- Canfield RH. 1941. Application of the line interception method in sampling range vegetation. J For. 39(4):388–394.
- Cudzik A, Brennensthul M, Białczyk W, Czarnecki J. 2017. Damage to soil and residual trees caused by different logging systems applied to late thinning. Croatia J For Eng. 38(1):83–95.
- Eliasson L. 2005. Effects of forwarder tyre pressure on rut formation and soil compaction. Silva Fenn. 39(4):549–557.
- Eliasson L, Wästerlund I. 2007. Effects of slash reinforcement of strip roads on rutting and soil compaction on a moist fine-grained soil. For Ecol Manage. 252(1–3):118–123. doi: 10.1016/j.foreco.2007.06.037
- Firth J, Van Dijk WAJ, Murphy G. 1984. A preliminary study of techniques for estimating harvesting-related soil disturbance from aerial photographs. Forest Research Institute bulletin no. 85 (In McMahon S. 1995. Accuracy of two ground survey methods for assessing site disturbance. Int J For Eng. 6(2):27).
- Friberg G, Bergkvist I. 2016. How operational procedures and depth-to-water maps can reduce damage on soil and water and rutting in Swedish forestry. Uppsala Swedish Forest Research Institute – Skogforsk.
- Giannetti F, Chirici G, Travaglini D, Bottalico F, Marchi E, Cambi M. 2017. Assessment of soil disturbance caused by forest operations by means of portable laser scanner and soil physical parameters. Soil Sci Soc Am J. 0:0–0.
- Gregoire TG, Monkevich NS. 1994. The reflection method of line intercept sampling to eliminate boundary bias. Environ Ecol Stat. 1(3):219–226. doi: 10.1007/BF00571393
- Gundersen VS, Frivold LH. 2008. Public preferences for forest structures: a review of quantitative surveys from Finland, Norway and Sweden. Urban For Urban Greening. 7(4):241–258. doi: 10.1016/j.ufug.2008.05.001
- Han S-K, Han H-S, Page-Dumroese DS, Johnson LR. 2009. Soil compaction associated with cut-to-length and whole-tree harvesting of a coniferous forest. Can J For Res. 39(5):976–989. doi: 10.1139/X09-027
- Harwin S, Lucieer A. 2012. Assessing the accuracy of georeferenced point clouds produced via multi-view stereopsis from unmanned aerial vehicle (UAV) imagery. Remote Sens. 4(6):1573. doi: 10.3390/rs4061573
- Hély C, Bergeron Y, Flannigan MD. 2000. Coarse woody debris in the southeastern Canadian boreal forest: composition and load variations in relation to stand replacement. Can J For Res. 30(5):674–687. doi: 10.1139/x99-256
- Horn R, Vossbrink J, Peth S, Becker S. 2007. Impact of modern forest vehicles on soil physical properties. For Ecol Manage. 248(1–2):56–63. doi: 10.1016/j.foreco.2007.02.037
- Jones M-F, Arp PA. 2017. Relating cone penetration and rutting resistance to variations in forest soil properties and daily moisture fluctuations. Open J Soil Sci. 7:149–171. doi: 10.4236/ojss.2017.77012
- Jönsson AM, Lagergren F. 2017. Potential use of seasonal forecasts for operational planning of north european forest management. Agricultural and Forest Meteorology. 244:122–135. doi: 10.1016/j.agrformet.2017.06.001
- Karlsson J, Rönnqvist M, Bergström J. 2004. An optimization model for annual harvest planning. Can J For Res. 34(8):1747–1754. doi: 10.1139/x04-043
- Labelle ER, Jaeger D. 2012. Quantifying the use of brush mats in reducing forwarder peak loads and surface contact pressures. Croatia J For Eng. 33(2):249–274.
- Lanford BL, Stokes BJ. 1995. Comparison of two thinning systems. Part 1. Stand and site impacts. For Prod J. 45(5):74–79.
- Machl T, Donaubauer A, Auernhammer H, Kolbe TH. 2013. Shape and ergonomics: methods for analyzing shape and geometric parameters of agricultural parcels. Sustainable agriculture through ICT innovation 24–27 June 2013; Torino, Italy.
- Manner J, Nordfjell T, Lindroos O. 2013. Effects of the number of assortments and log concentration on time consumption for forwarding. Silva Fenn. 47(4):1–19. doi: 10.14214/sf.1030
- McDonald TP, Carter EA, Taylor SE. 2002. Using the global positioning system to map disturbance patterns of forest harvesting machinery. Can J For Res. 32(2):310–319. doi: 10.1139/x01-189
- McMahon S. 1995. Accuracy of two ground survey methods for assessing site disturbance. Int J For Eng. 6(2):27–33.
- McNeel JF, Ballard TM. 1992. Analysis of site stand impacts from thinning with a harvester-forwarder system. Int J For Eng. 4(1):23–29.
- Murphy PN, Ogilvie J, Meng F-R, White B, Bhatti JS, Arp PA. 2011. Modelling and mapping topographic variations in forest soils at high resolution: a case study. Ecol Model. 222(14):2314–2332. doi: 10.1016/j.ecolmodel.2011.01.003
- Niemi MT, Vastaranta M, Vauhkonen J, Melkas T, Holopainen M. 2017. Airborne LiDAR-derived elevation data in terrain trafficability mapping. Scand J For Res. 32(8):762–773. doi: 10.1080/02827581.2017.1296181
- Nordfjell T, Björheden R, Thor M, Wästerlund I. 2010. Changes in technical performance, mechanical availability and prices of machines used in forest operations in Sweden from 1985 to 2010. Scand J For Res. 25(4):382–389. doi: 10.1080/02827581.2010.498385
- Pebesma E. 2017. Sf: simple features for R. [cited 2017 October 20]. Available from: https://cran.r-project.org/web/packages/sf/vignettes/sf1.html.
- Pierzchała M, Talbot B, Astrup R. 2014. Estimating soil displacement from timber extraction trails in steep terrain: application of an unmanned aircraft for 3D modelling. Forests. 5(6):1212–1223. doi: 10.3390/f5061212
- Pierzchała M, Talbot B, Astrup R. 2016. Measuring wheel ruts with close-range photogrammetry. For Int J For Res. 89(4):383–391.
- Pohjankukka J, Riihimäki H, Nevalainen P, Pahikkala T, Ala-Ilomäki J, Hyvönen E, Varjo J, Heikkonen J. 2016. Predictability of boreal forest soil bearing capacity by machine learning. J Terramech. 68:1–8. doi: 10.1016/j.jterra.2016.09.001
- QGIS. 2017. QGIS geographic information system. http://www.qgis.org/: open source geospatial foundation project.
- Quesnel HJ, Curran MP. 2000. Shelterwood harvesting in root-disease infected stands – post-harvest soil disturbance and compaction. For Ecol Manage. 133(1–2):89–113.
- Reeves DA, Reeves MC, Abbott AM, Page-Dumroese DS, Coleman MD. 2012. A detrimental soil disturbance prediction model for ground-based timber harvesting. Can J For Res. 42(5):821–830. doi: 10.1139/x2012-034
- Sakai H, Tomas N, Suadicani K, Talbot B, Bøllehuus E. 2008. Soil compaction on forest soils from different kinds of tires and tracks [Vitenskapelig foredrag]. Croatia J For Eng. 29(1):15–28.
- Seibert J, Stendahl J, Sørensen R. 2007. Topographical influences on soil properties in boreal forests. Geoderma. 141(1–2):139–148.
- Simonsson P, Gustafsson L, Östlund L. 2015. Retention forestry in Sweden: driving forces, debate and implementation 1968–2003. Scand J For Res. 30(2):154–173. doi: 10.1080/02827581.2014.968201
- Sirén M, Ala-Ilomäki J, Mäkinen H, Lamminen S, Mikkola T. 2013. Harvesting damage caused by thinning of Norway spruce in unfrozen soil. Int J For Eng. 24(1):60–75.
- Startsev AD, McNabb DH. 2000. Effects of skidding on forest soil infiltration in west-central Alberta. Can J Soil Sci. 80(4):617–624. doi: 10.4141/S99-092
- Startsev AD, McNabb DH. 2009. Effects of compaction on aeration and morphology of boreal forest soils in Alberta, Canada. Can J Soil Sci. 89(1):45–56. doi: 10.4141/CJSS06037
- Talbot B, Pierzchała M, Astrup R. 2017a. Applications of remote and proximal sensing for improved precision in forest operations. Croatia J For Eng. 38(2):327–336.
- Talbot B, Pierzchała M, Astrup R. 2017b. Variability in the precision of UAV based surface models in a post-harvest survey. Precision forestry symposium 2017 producing more from less: towards optimising value in the bio-economy from data driven decisions; Stellenbosch University.
- Team RC. 2017. R: a language and environment for statistical computing. Vienna (Austria): R Foundation for Statistical Computing.
- Tiernan D, Zeleke G, Owende PMO, Kanali CL, Lyons J, Ward SM. 2004. Effect of working conditions on forwarder productivity in cut-to-length timber harvesting on sensitive forest sites in Ireland. Biosys Eng. 87(2):167–177. doi: 10.1016/j.biosystemseng.2003.11.009
- Torresan C, Berton A, Carotenuto F, Di Gennaro SF, Gioli B, Matese A, Miglietta F, Vagnoli C, Zaldei A, Wallace L. 2016. Forestry applications of UAVs in Europe: a review. Int J Remote Sens. 38:8–10.
- Uusitalo J, Salomaki M, Ala-Ilomaki J. 2015. The effect of wider logging trails on rut formations in the harvesting of peatland forests. Croatia J For Eng. 36(1):125–130.
- Vossbrink J, Horn R. 2004. Modern forestry vehicles and their impact on soil physical properties. Eur J For Res. 123(4):259–267. doi: 10.1007/s10342-004-0040-8
- Wästerlund I. 1994. Environmental aspects of machine traffic. J Terramech. 31(5):265–277. doi: 10.1016/0022-4898(94)90001-9
- Williamson JR, Neilsen WA. 2000. The influence of forest site on rate and extent of soil compaction and profile disturbance of skid trails during ground-based harvesting. Can J For Res. 30(8):1196–1205. doi: 10.1139/x00-041